| Param | Original file | Final file |
|---|---|---|
| Filename | modeM0/AS1T01_209T01_9000001758_11885cztM0_level2.evt | modeM0/AS1T01_209T01_9000001758_11885cztM0_level2_quad_clean.evt |
| Size (bytes) | 479,744,640 | 102,412,800 |
| Size | 457.5 MB | 97.7 MB |
| Events in quadrant A | 3,362,369 | 665,796 |
| Events in quadrant B | 3,951,375 | 672,583 |
| Events in quadrant C | 3,008,834 | 669,302 |
| Events in quadrant D | 3,754,634 | 630,076 |
| Mode M0 | |||
|---|---|---|---|
| Quadrant | BADHDUFLAG | Total packets | Discarded packets |
| A | 0 | 14312 | 3 |
| B | 0 | 15995 | 2 |
| C | 0 | 13490 | 2 |
| D | 0 | 15474 | 2 |
| Mode SS | |||
|---|---|---|---|
| Quadrant | BADHDUFLAG | Total packets | Discarded packets |
| A | 0 | 136 | 0 |
| B | 0 | 136 | 0 |
| C | 0 | 136 | 0 |
| D | 0 | 136 | 0 |
| Mode M9 | |||
|---|---|---|---|
| Quadrant | BADHDUFLAG | Total packets | Discarded packets |
| A | 0 | 17 | 0 |
| B | 0 | 17 | 0 |
| C | 0 | 17 | 0 |
| D | 0 | 18 | 0 |
| Quadrant | Total seconds | Saturated seconds | Saturation percentage |
|---|---|---|---|
| A | 6649 | 66 | 0.992630% |
| B | 6649 | 222 | 3.338848% |
| C | 6649 | 28 | 0.421116% |
| D | 6649 | 77 | 1.158069% |
Noise dominated data is calculated using 1-second bins in cleaned event files. If a bin has >2000 counts, and if more than 50% of those come from <1% of pixels, then it is considered to be noise-dominated and hence unusable.
| Quadrant | # 1 sec bins | Bins with >0 counts | Bins with >2000 counts | High rate bins dominated by noise | Noise dominated (total time) | Noise dominated (detector-on time) | Marked lightcurve |
|---|---|---|---|---|---|---|---|
| A | 7735 | 6651 | 6 | 6 | 0.08% | 0.09% | 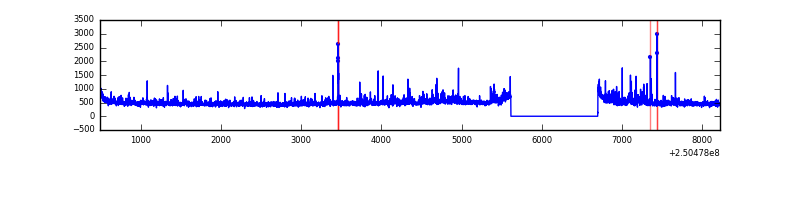 |
| B | 7735 | 6651 | 78 | 78 | 1.01% | 1.17% | 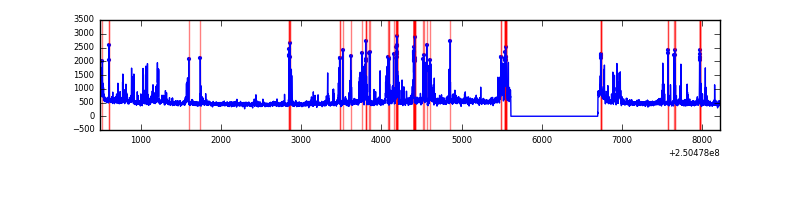 |
| C | 7735 | 6651 | 0 | 0 | 0.00% | 0.00% | 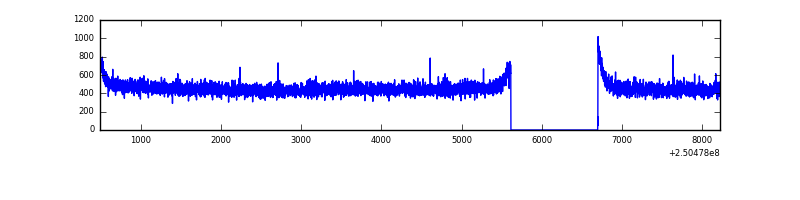 |
| D | 7735 | 6651 | 44 | 44 | 0.57% | 0.66% | 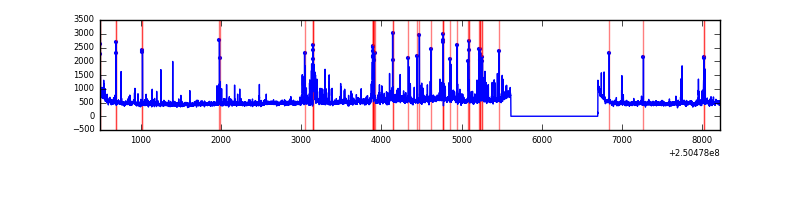 |
Top three noisy pixels from each quadrant. If the there are fewer than three noisy pixels in the level2.evt file, extra rows are filled as -1
| Pixel properties | Quadrant properties | ||||||
|---|---|---|---|---|---|---|---|
| Quadrant | DetID | PixID | Counts | Sigma | Mean | Median | Sigma |
| A | 7 | 144 | 117831 | 743.56 | 778 | 761 | 157.4 |
| A | 1 | 162 | 82698 | 520.41 | 778 | 761 | 157.4 |
| A | 1 | 178 | 42242 | 263.46 | 778 | 761 | 157.4 |
| B | 4 | 239 | 621853 | 4252.85 | 784 | 765 | 146.0 |
| B | 15 | 204 | 107570 | 731.34 | 784 | 765 | 146.0 |
| B | 0 | 214 | 59730 | 403.76 | 784 | 765 | 146.0 |
| C | 8 | 128 | 7725 | 39.63 | 767 | 771 | 175.5 |
| C | 13 | 61 | 5790 | 28.6 | 767 | 771 | 175.5 |
| C | 8 | 112 | 4719 | 22.5 | 767 | 771 | 175.5 |
| D | 8 | 195 | 393204 | 2184.7 | 755 | 733 | 179.6 |
| D | 12 | 233 | 148220 | 820.99 | 755 | 733 | 179.6 |
| D | 13 | 104 | 73932 | 407.46 | 755 | 733 | 179.6 |
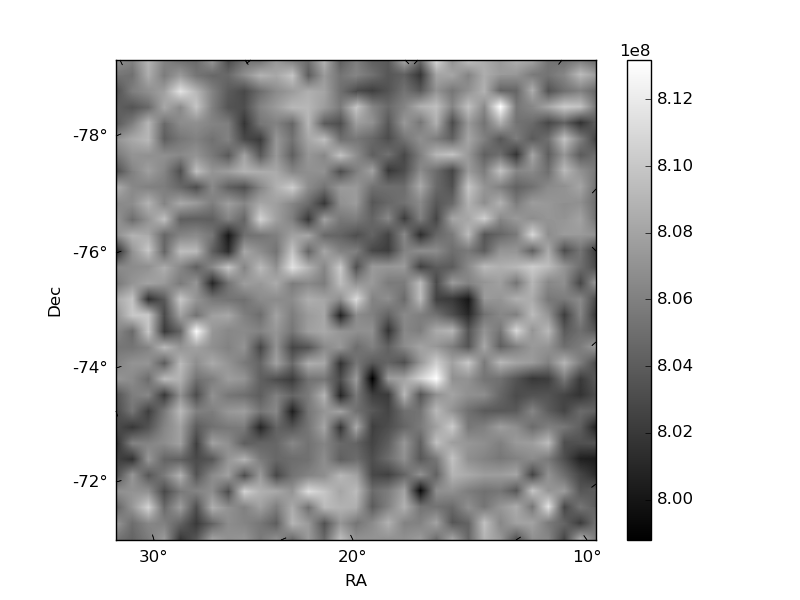
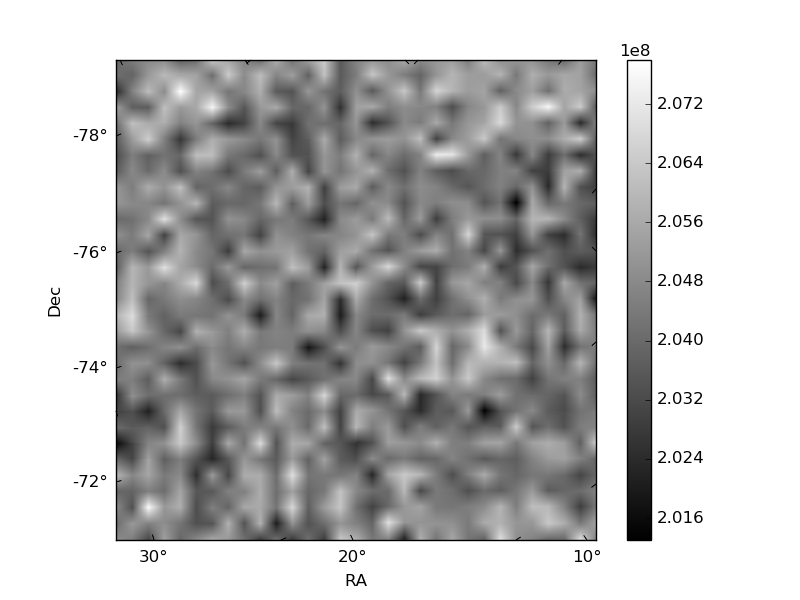
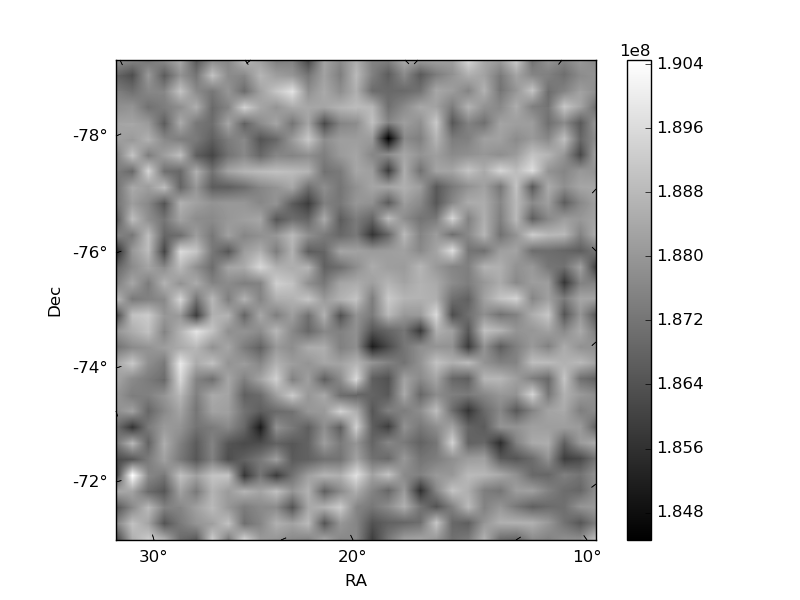
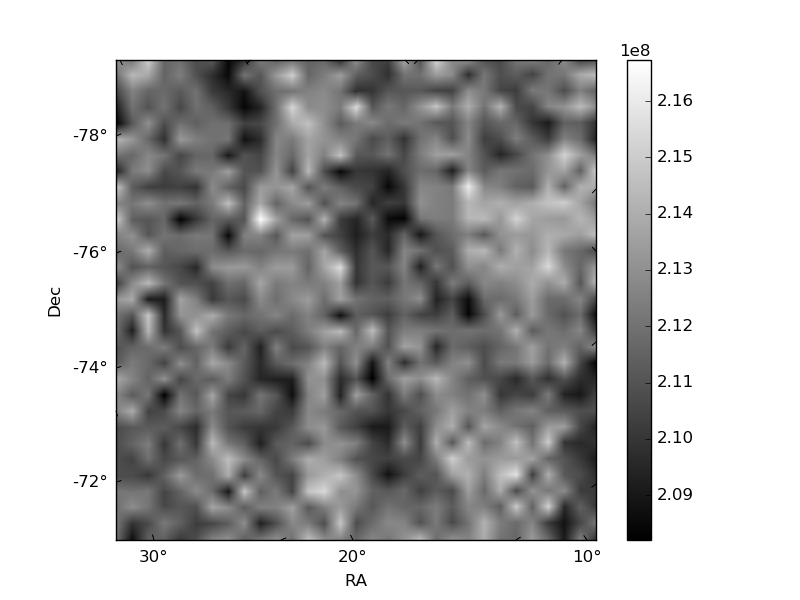
Histogram calculated using DETX and DETY for each event in the final _common_clean file
| Quadrant A | 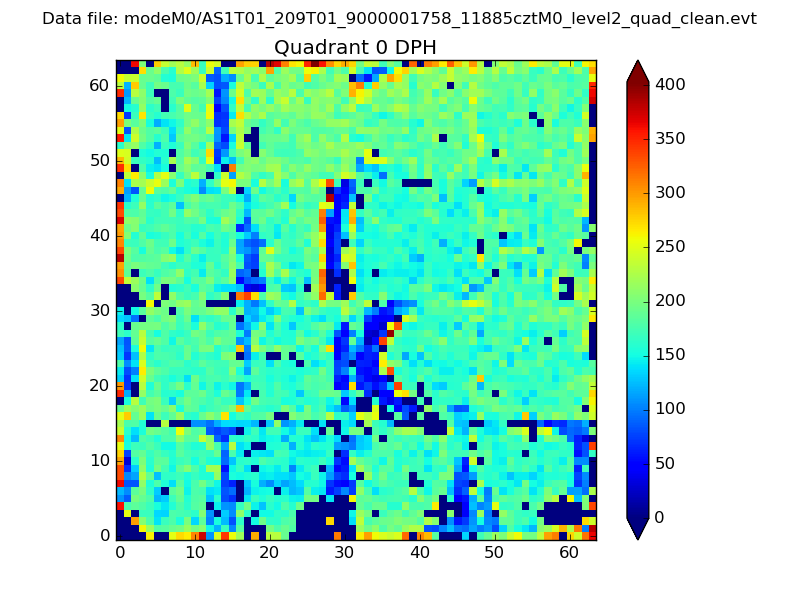 |
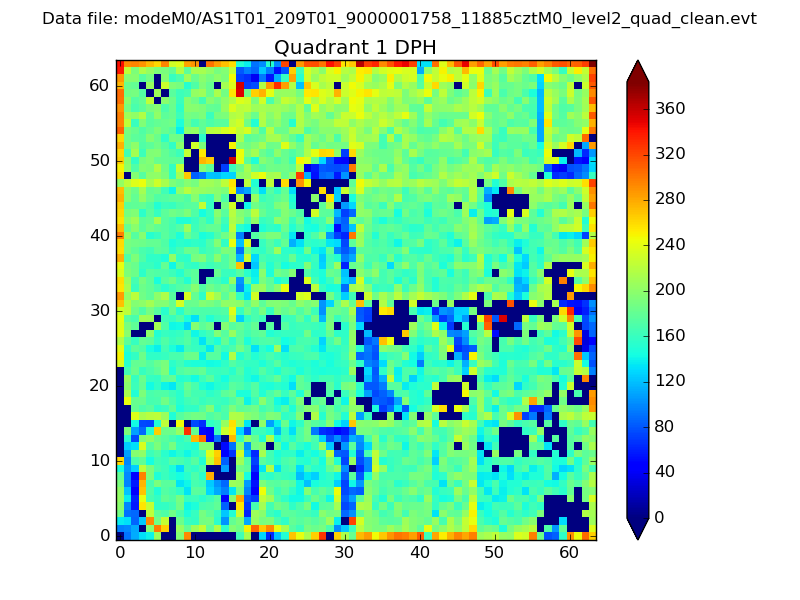 |
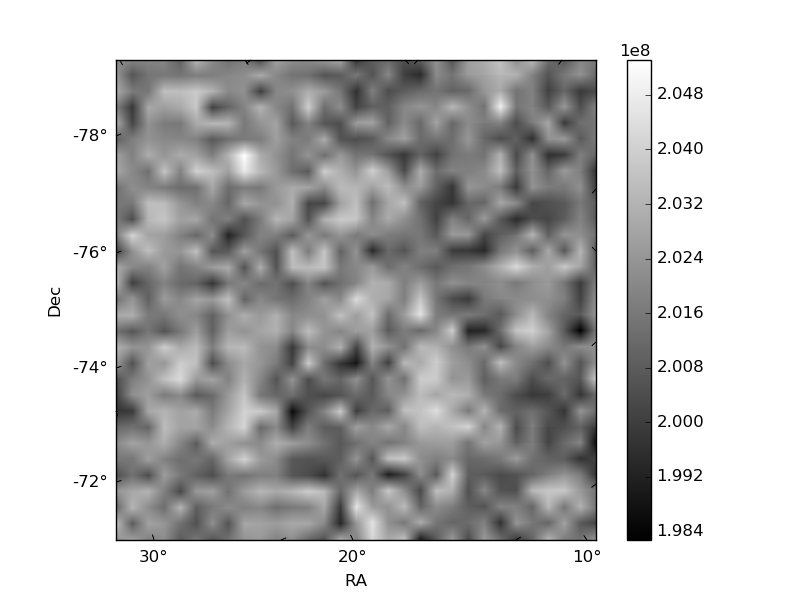
Quadrant B |
|---|---|---|---|
| Quadrant D | 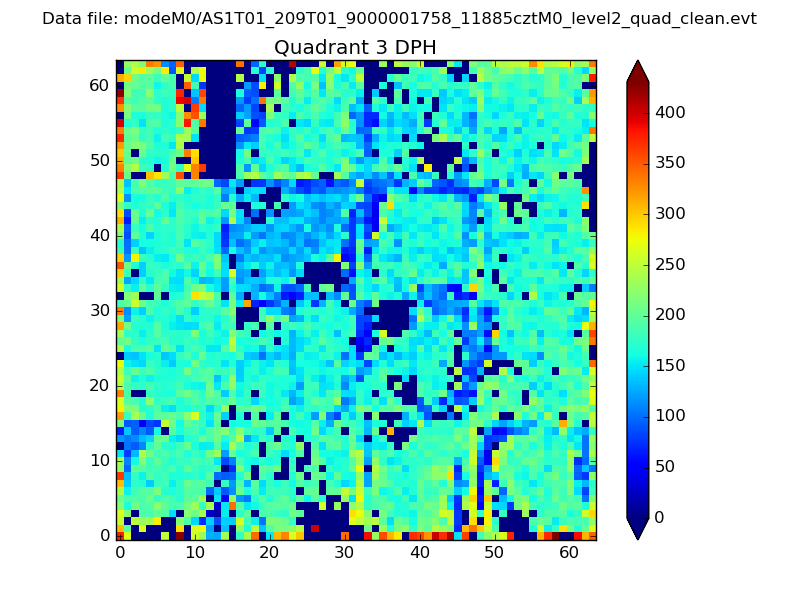 |
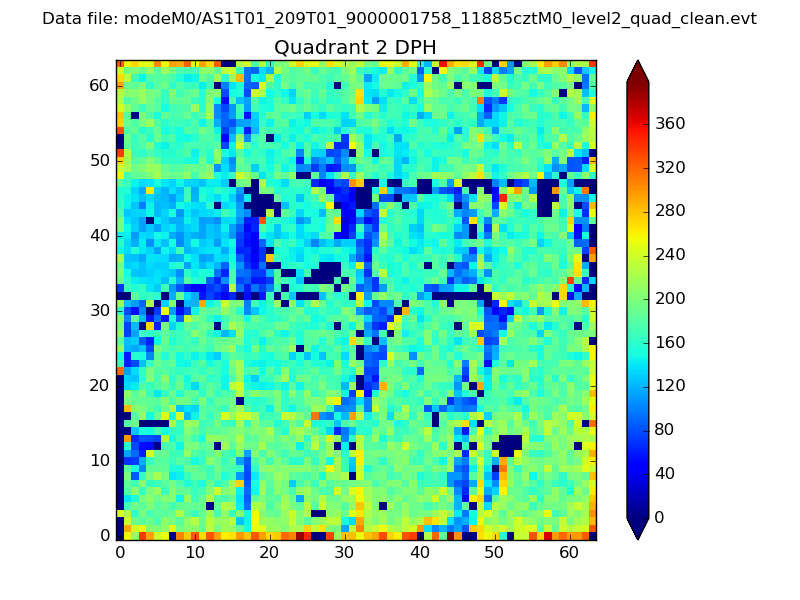 |
Quadrant C |
| Plot type | Count rate plots | Images |
|---|---|---|
| Comparison with Poisson distribution Blue bars denote a histogram of data divided into 1 sec bins. Red curve is a Poisson curve with rate = median count rate of data. |
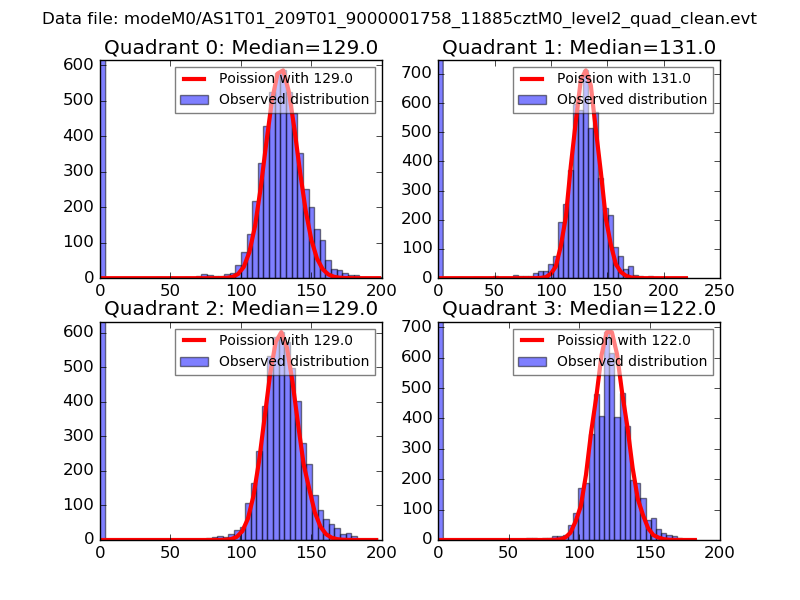 |
 |
| Quadrant-wise count rates Data is divided into 100 sec bins |
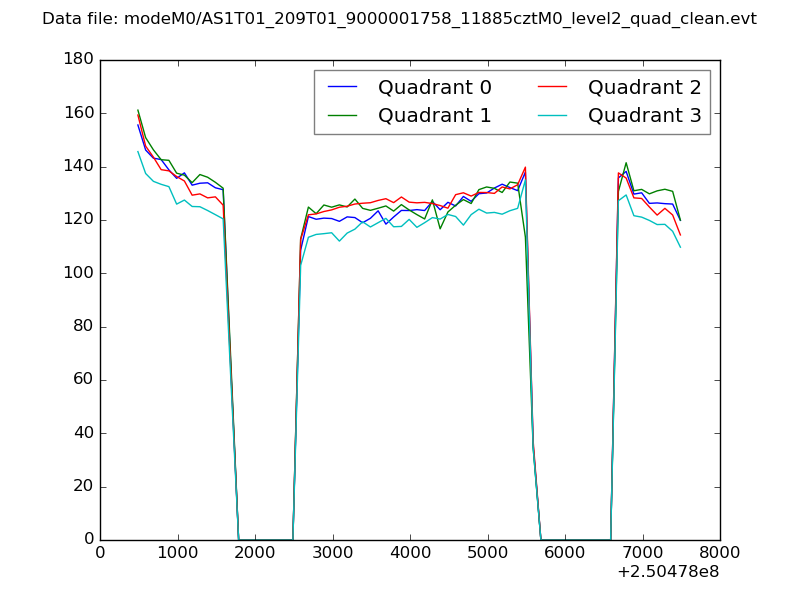 |
|
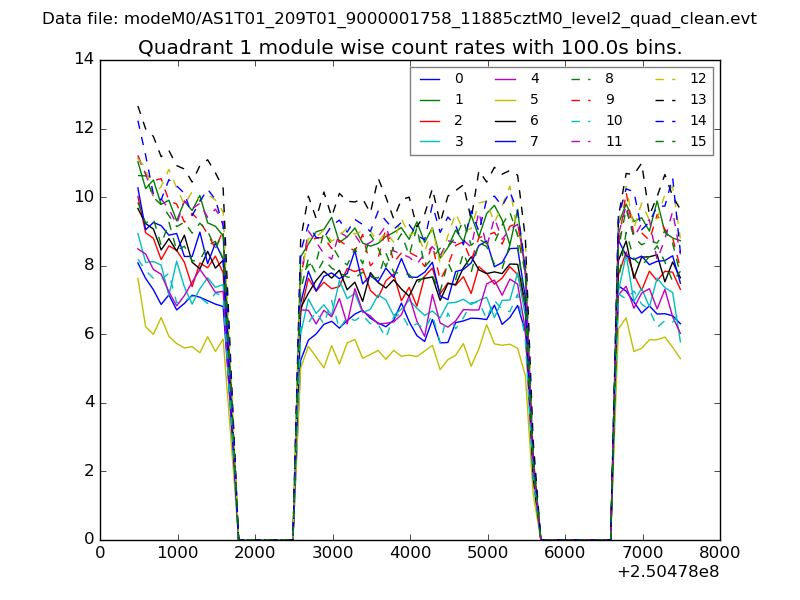
| Module-wise count rates for Quadrant A Data is divided into 100 sec bins |
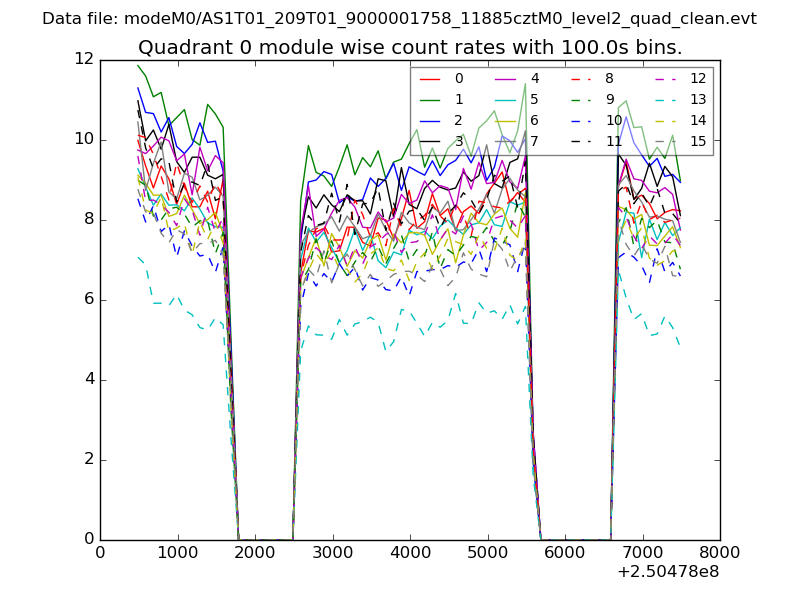 |
 |
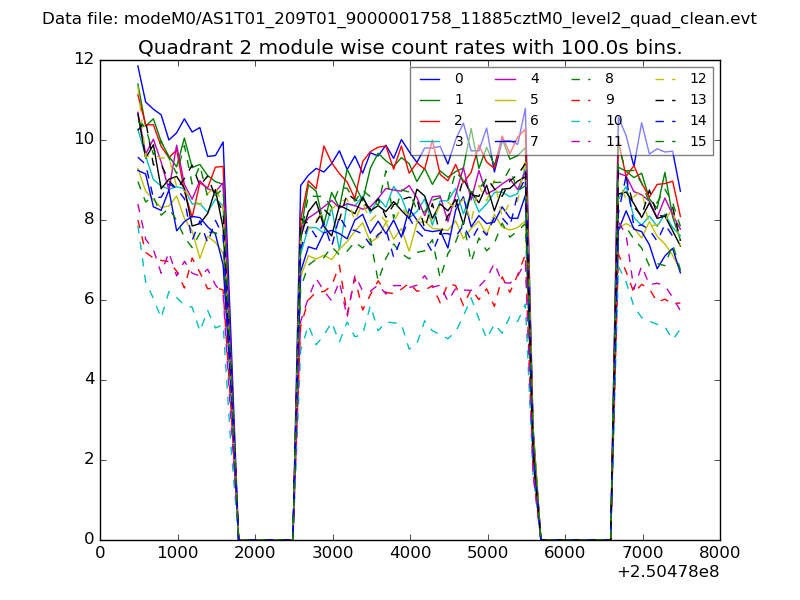
| Module-wise count rates for Quadrant B Data is divided into 100 sec bins |
 |
 |
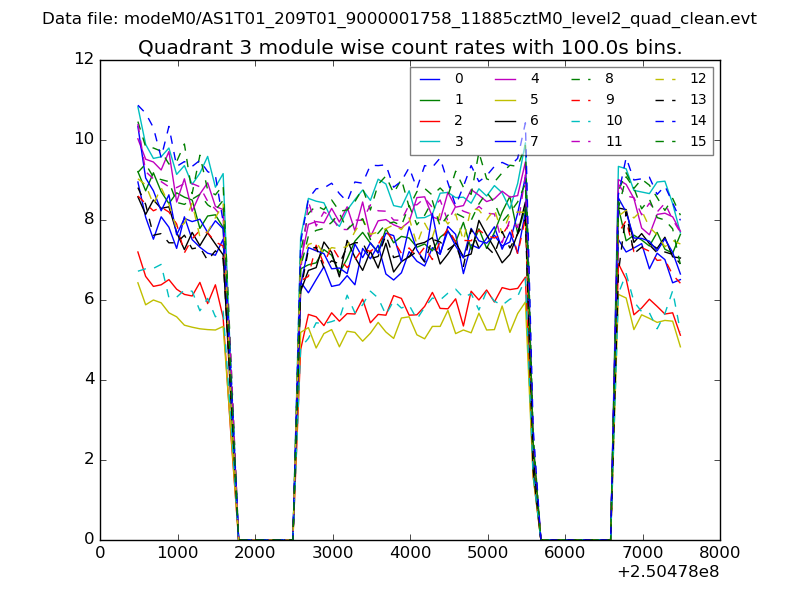
| Module-wise count rates for Quadrant C Data is divided into 100 sec bins |
 |
 |
| Module-wise count rates for Quadrant D Data is divided into 100 sec bins |
 |
 |
| Parameter | Plot |
|---|---|
| CZT HV Monitor | 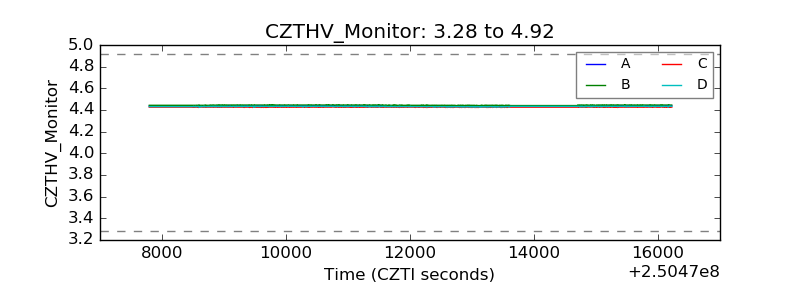 |
| D_VDD | 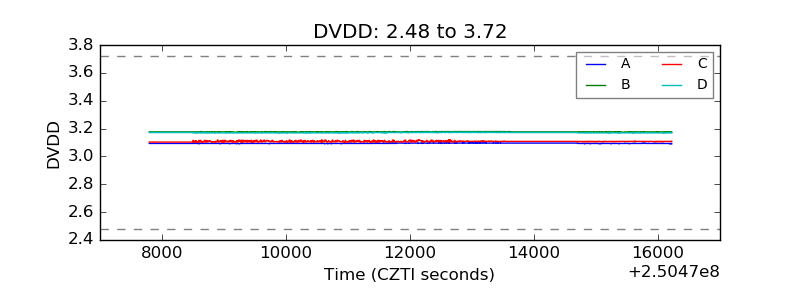 |
| Temperature 1 | 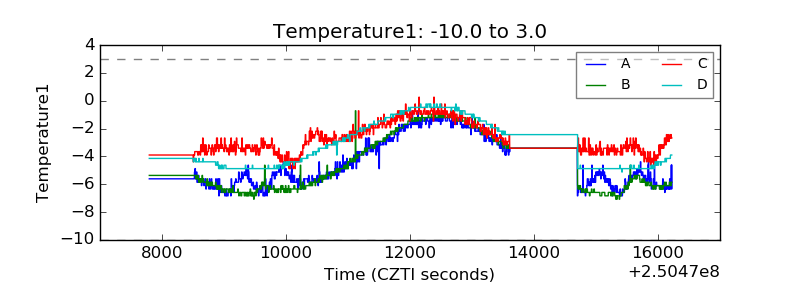 |
| Veto HV Monitor | 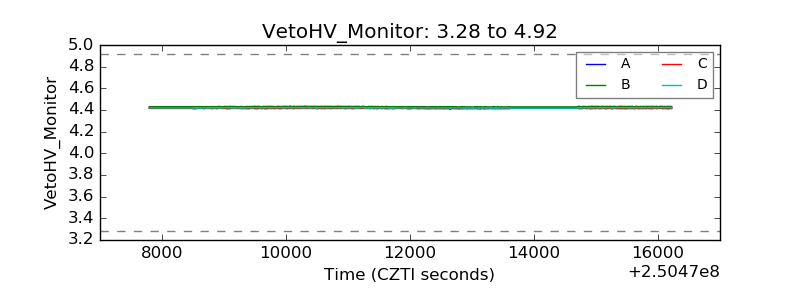 |
| Veto LLD | 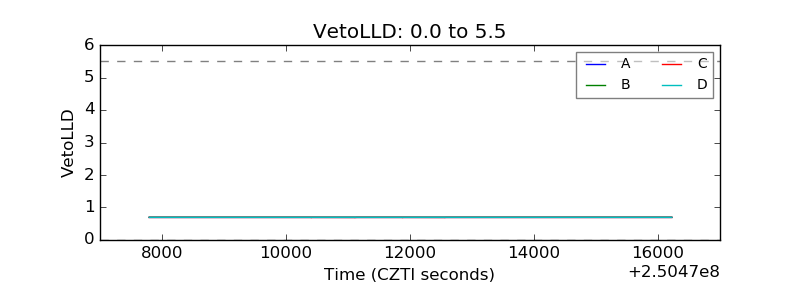 |
| Alpha Counter | 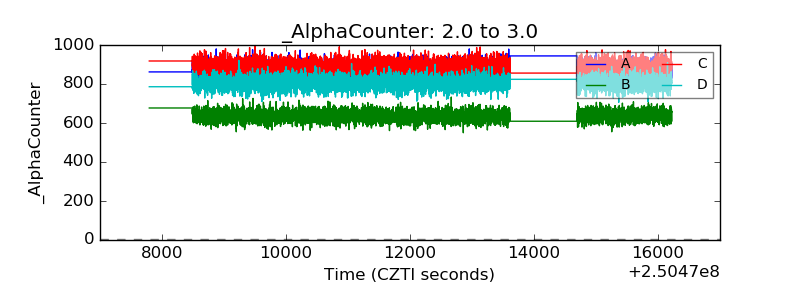 |
| _CPM_Rate | 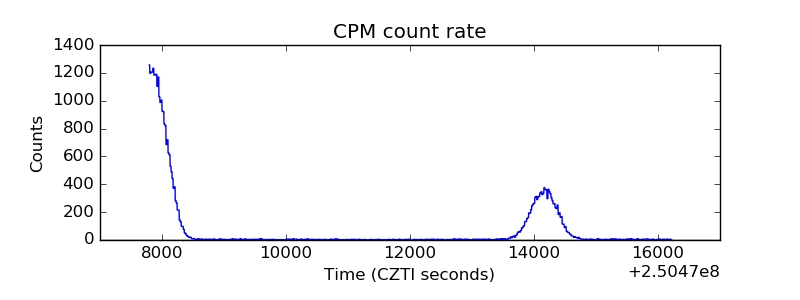 |
| CZT Counter | 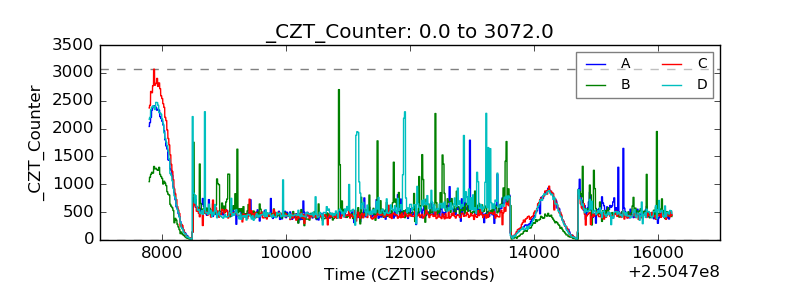 |
| +2.5 Volts monitor | 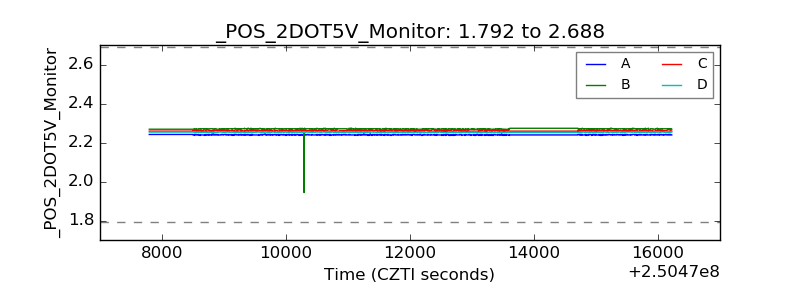 |
| +5 Volts monitor | 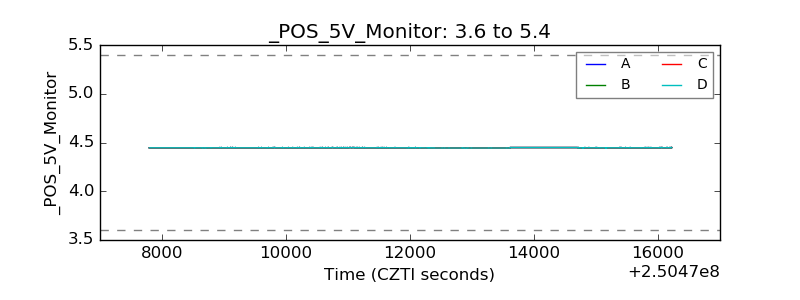 |
| _ROLL_ROT | 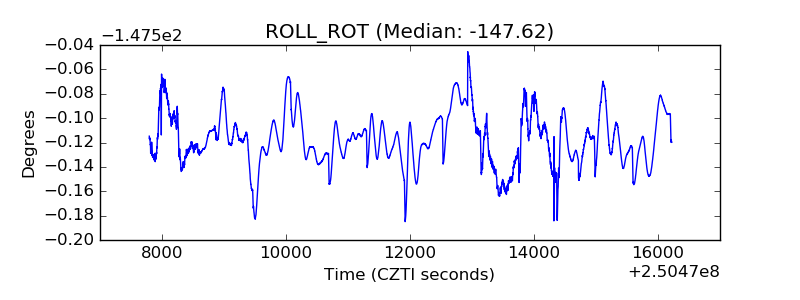 |
| _Roll_DEC | 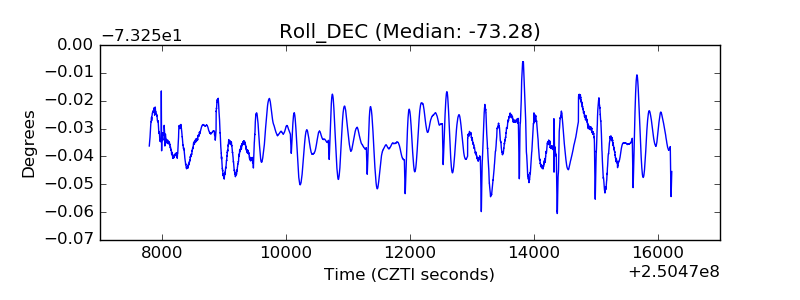 |
| _Roll_RA | 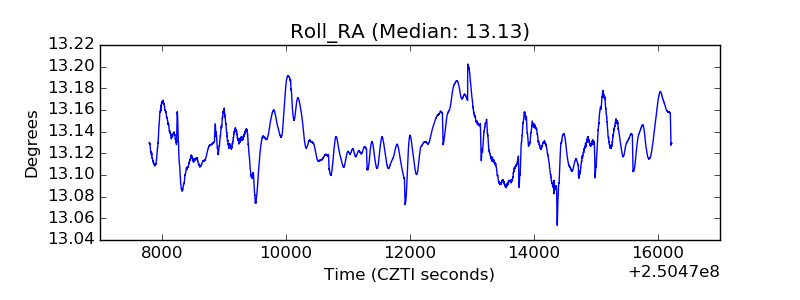 |
| Veto Counter | 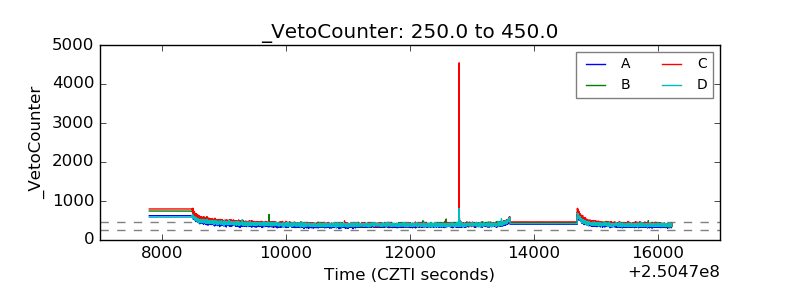 |