| Param | Original file | Final file |
|---|---|---|
| Filename | modeM0/AS1T01_209T01_9000001758_11886cztM0_level2.evt | modeM0/AS1T01_209T01_9000001758_11886cztM0_level2_quad_clean.evt |
| Size (bytes) | 505,071,360 | 101,468,160 |
| Size | 481.7 MB | 96.8 MB |
| Events in quadrant A | 3,651,634 | 651,649 |
| Events in quadrant B | 4,003,817 | 657,998 |
| Events in quadrant C | 3,135,885 | 655,958 |
| Events in quadrant D | 4,029,266 | 619,551 |
| Mode M0 | |||
|---|---|---|---|
| Quadrant | BADHDUFLAG | Total packets | Discarded packets |
| A | 0 | 15396 | 3 |
| B | 0 | 16404 | 2 |
| C | 0 | 14351 | 2 |
| D | 0 | 16373 | 2 |
| Mode SS | |||
|---|---|---|---|
| Quadrant | BADHDUFLAG | Total packets | Discarded packets |
| A | 0 | 142 | 0 |
| B | 0 | 142 | 0 |
| C | 0 | 142 | 0 |
| D | 0 | 142 | 0 |
| Mode M9 | |||
|---|---|---|---|
| Quadrant | BADHDUFLAG | Total packets | Discarded packets |
| A | 0 | 18 | 0 |
| B | 0 | 18 | 0 |
| C | 0 | 18 | 0 |
| D | 0 | 18 | 0 |
| Quadrant | Total seconds | Saturated seconds | Saturation percentage |
|---|---|---|---|
| A | 7006 | 158 | 2.255210% |
| B | 7006 | 298 | 4.253497% |
| C | 7006 | 119 | 1.698544% |
| D | 7006 | 173 | 2.469312% |
Noise dominated data is calculated using 1-second bins in cleaned event files. If a bin has >2000 counts, and if more than 50% of those come from <1% of pixels, then it is considered to be noise-dominated and hence unusable.
| Quadrant | # 1 sec bins | Bins with >0 counts | Bins with >2000 counts | High rate bins dominated by noise | Noise dominated (total time) | Noise dominated (detector-on time) | Marked lightcurve |
|---|---|---|---|---|---|---|---|
| A | 8767 | 7009 | 9 | 9 | 0.10% | 0.13% | 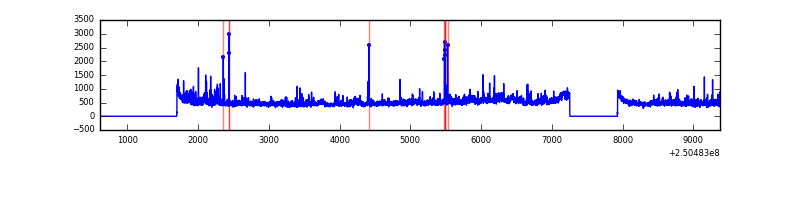 |
| B | 8767 | 7009 | 91 | 91 | 1.04% | 1.30% | 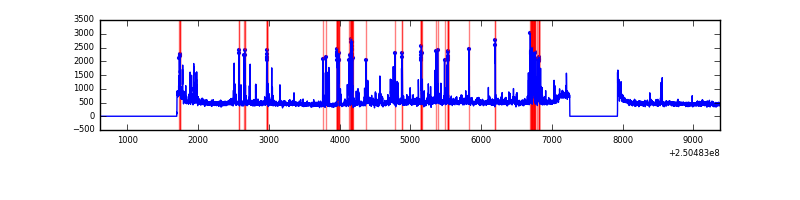 |
| C | 8767 | 7009 | 1 | 1 | 0.01% | 0.01% | 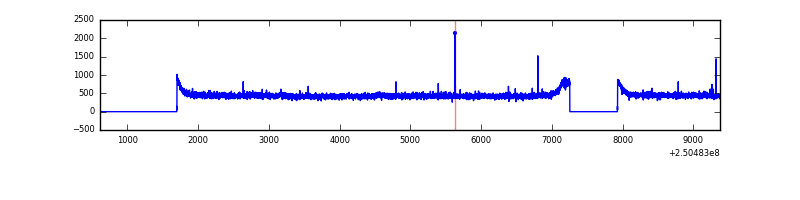 |
| D | 8767 | 7009 | 52 | 52 | 0.59% | 0.74% | 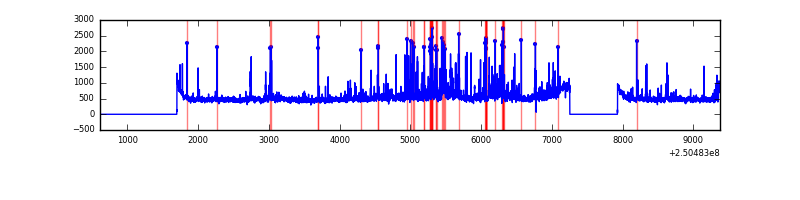 |
Top three noisy pixels from each quadrant. If the there are fewer than three noisy pixels in the level2.evt file, extra rows are filled as -1
| Pixel properties | Quadrant properties | ||||||
|---|---|---|---|---|---|---|---|
| Quadrant | DetID | PixID | Counts | Sigma | Mean | Median | Sigma |
| A | 7 | 144 | 133351 | 802.4 | 814 | 795 | 165.2 |
| A | 8 | 15 | 130860 | 787.32 | 814 | 795 | 165.2 |
| A | 1 | 162 | 91566 | 549.46 | 814 | 795 | 165.2 |
| B | 4 | 239 | 596150 | 3845.91 | 818 | 798 | 154.8 |
| B | 15 | 204 | 142167 | 913.23 | 818 | 798 | 154.8 |
| B | 0 | 214 | 22170 | 138.06 | 818 | 798 | 154.8 |
| C | 0 | 207 | 6708 | 32.06 | 801 | 801 | 184.2 |
| C | 13 | 61 | 5968 | 28.05 | 801 | 801 | 184.2 |
| C | 14 | 234 | 3373 | 13.96 | 801 | 801 | 184.2 |
| D | 8 | 195 | 394774 | 2083.89 | 791 | 766 | 189.1 |
| D | 10 | 50 | 285681 | 1506.9 | 791 | 766 | 189.1 |
| D | 1 | 52 | 80243 | 420.35 | 791 | 766 | 189.1 |
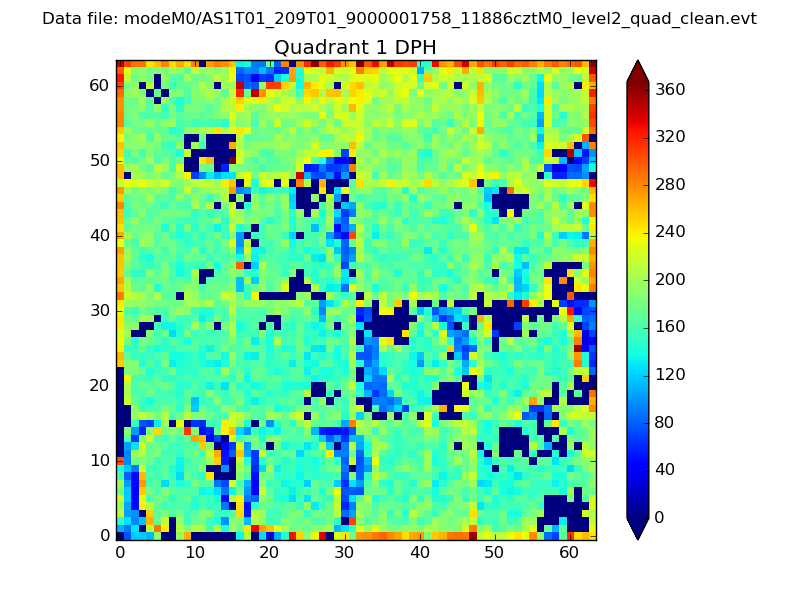
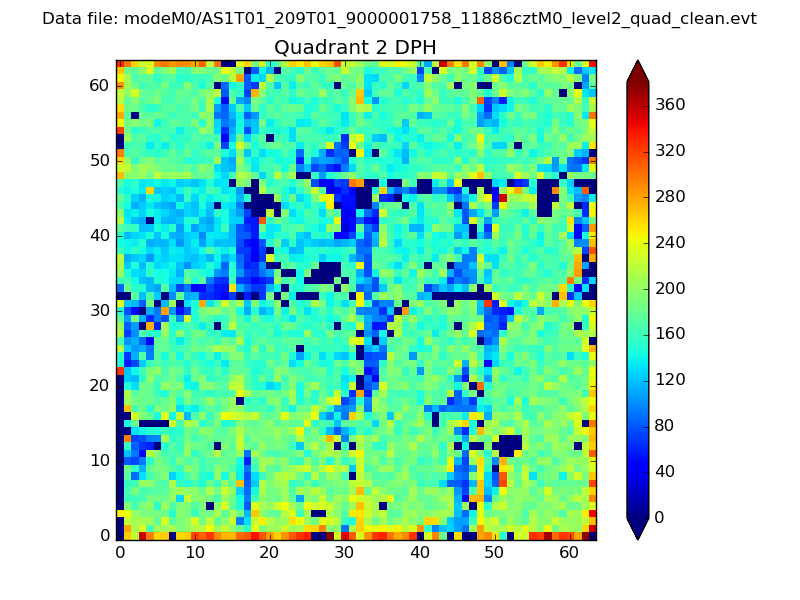
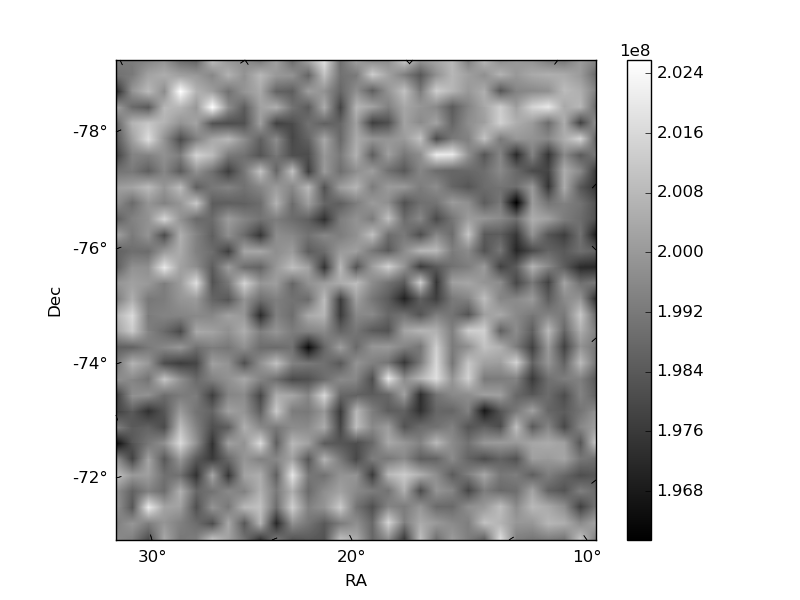
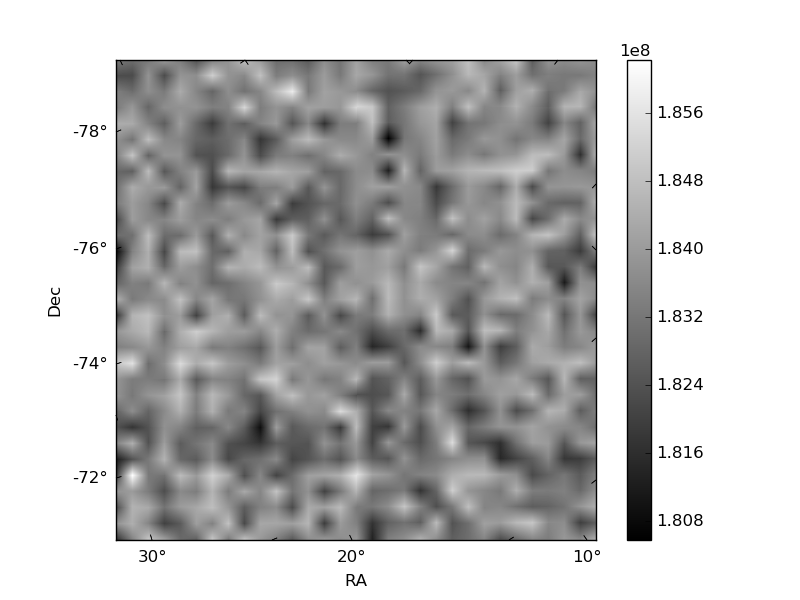
Histogram calculated using DETX and DETY for each event in the final _common_clean file
| Quadrant A |  |
 |
Quadrant B |
|---|---|---|---|
| Quadrant D |  |
 |
Quadrant C |
| Plot type | Count rate plots | Images |
|---|---|---|
| Comparison with Poisson distribution Blue bars denote a histogram of data divided into 1 sec bins. Red curve is a Poisson curve with rate = median count rate of data. |
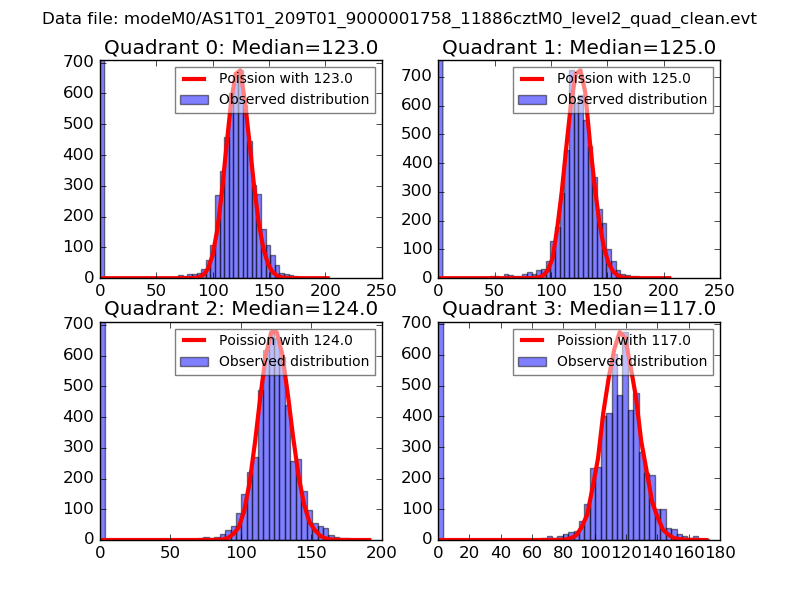 |
 |
| Quadrant-wise count rates Data is divided into 100 sec bins |
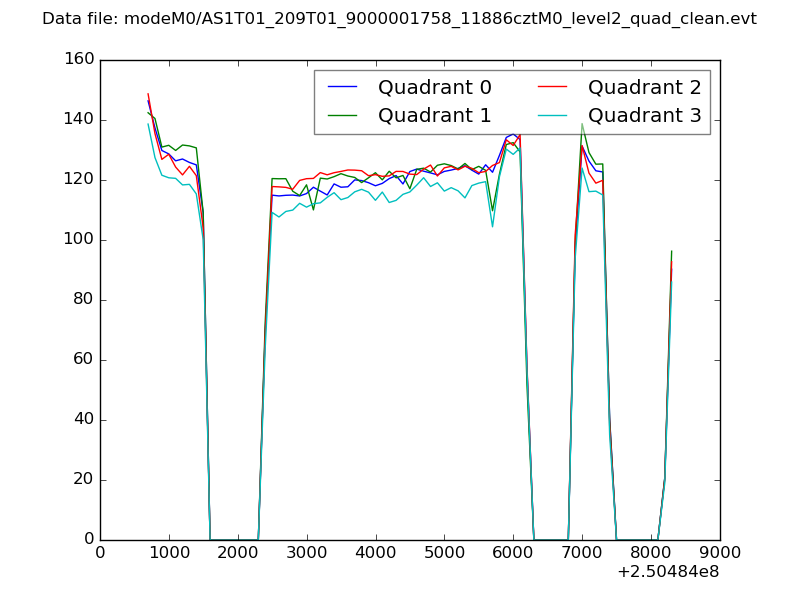 |
|
| Module-wise count rates for Quadrant A Data is divided into 100 sec bins |
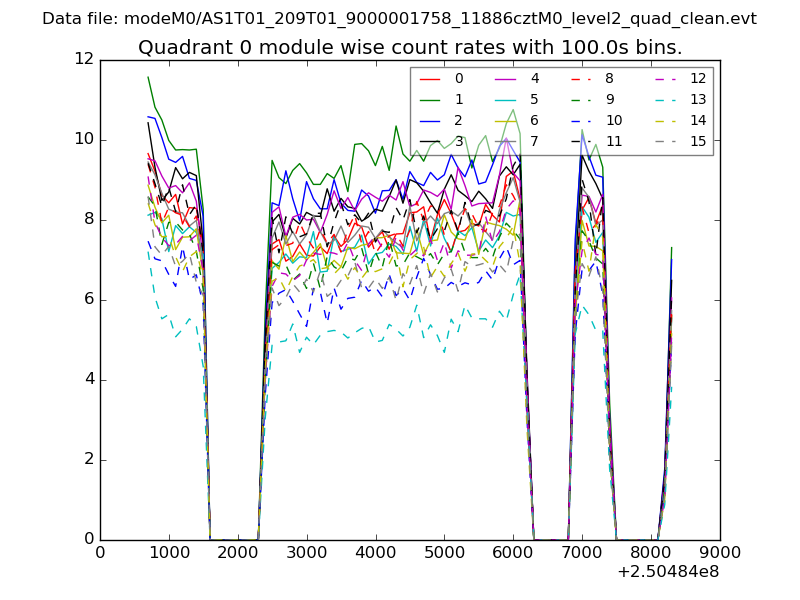 |
 |
| Module-wise count rates for Quadrant B Data is divided into 100 sec bins |
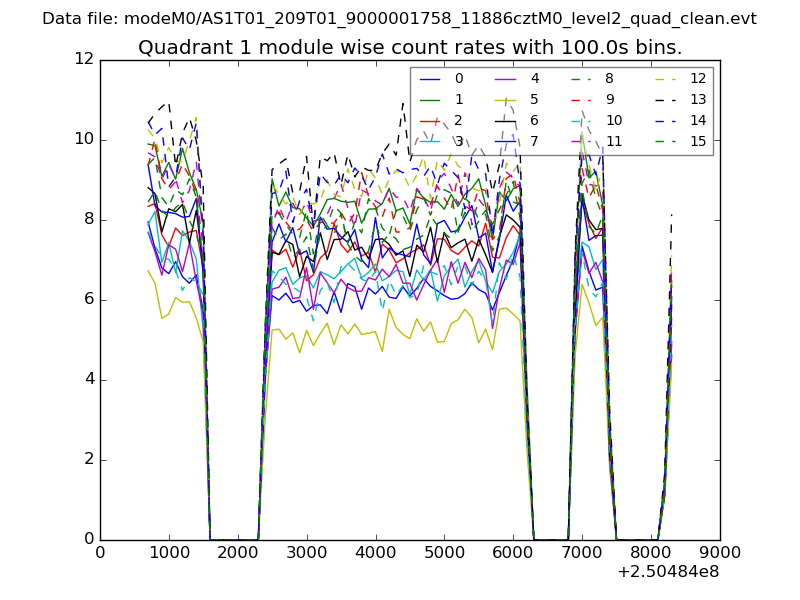 |
 |
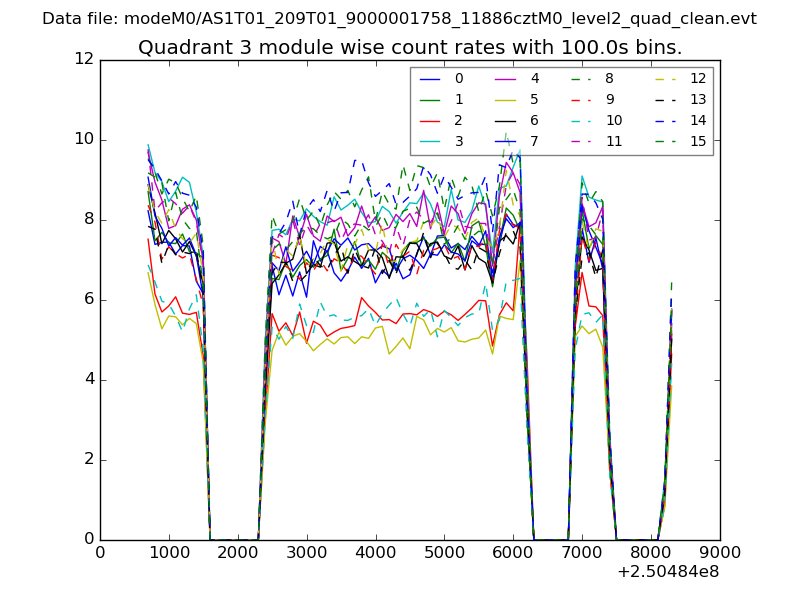
| Module-wise count rates for Quadrant C Data is divided into 100 sec bins |
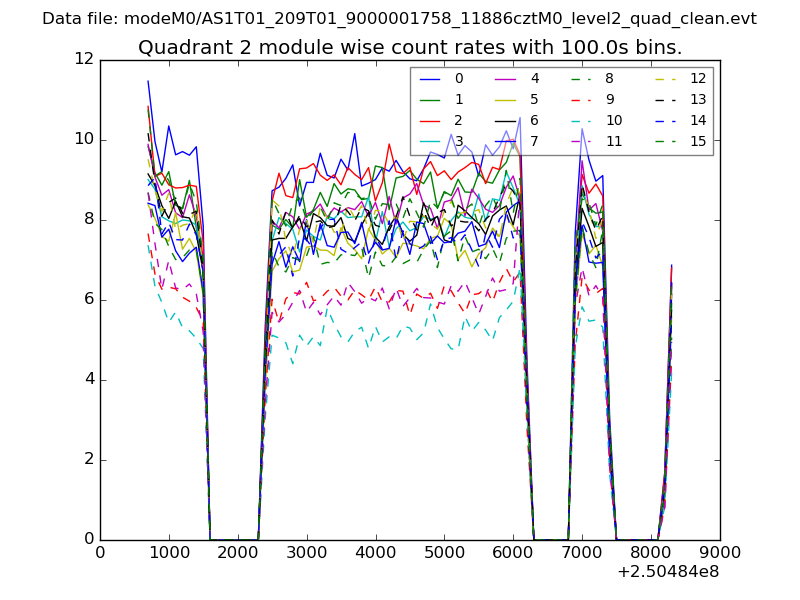 |
 |
| Module-wise count rates for Quadrant D Data is divided into 100 sec bins |
 |
 |
| Parameter | Plot |
|---|---|
| CZT HV Monitor | 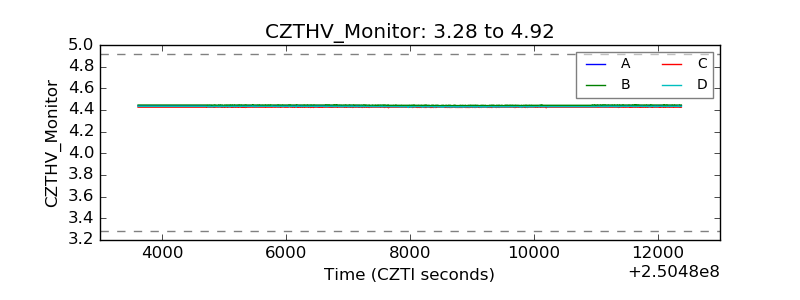 |
| D_VDD | 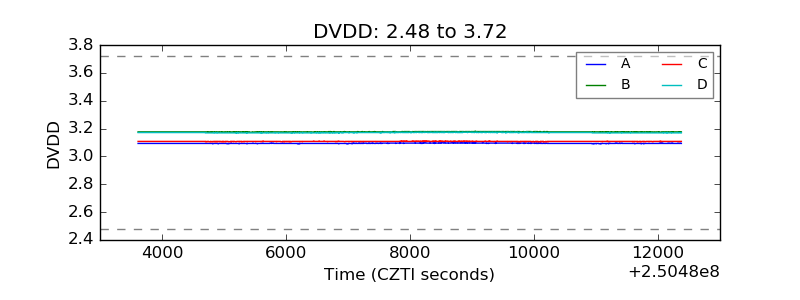 |
| Temperature 1 | 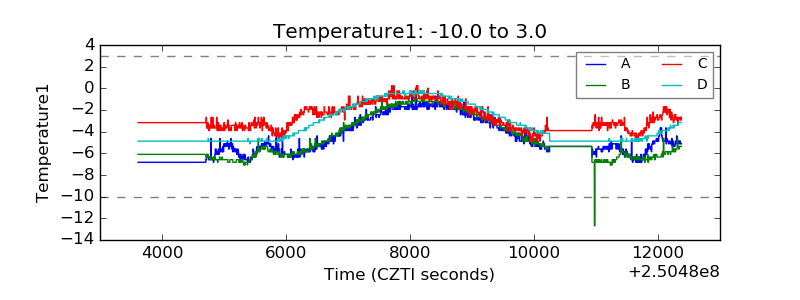 |
| Veto HV Monitor | 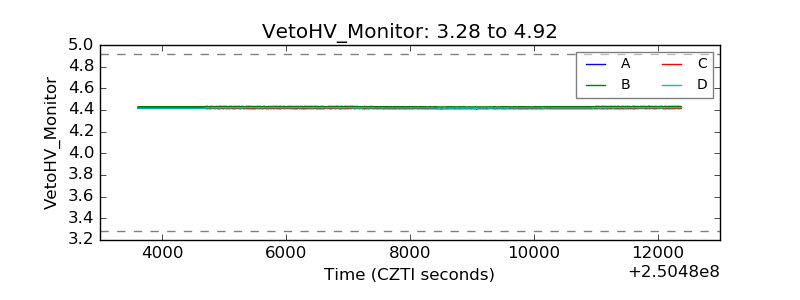 |
| Veto LLD | 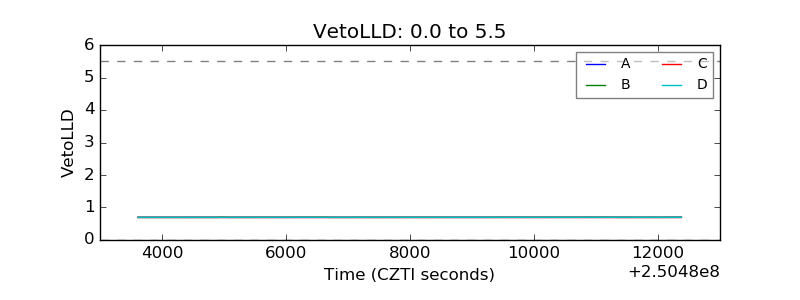 |
| Alpha Counter | 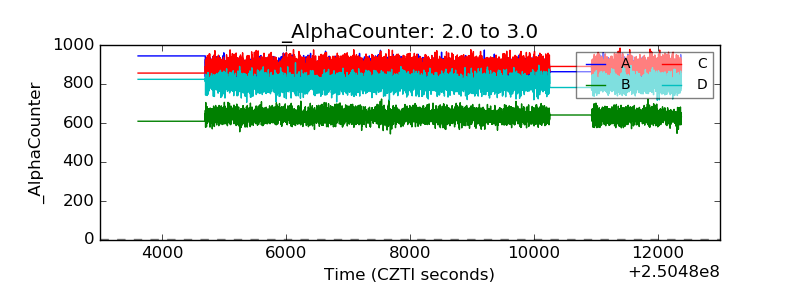 |
| _CPM_Rate | 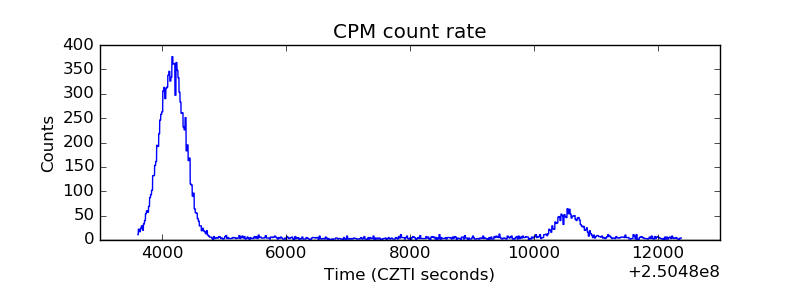 |
| CZT Counter | 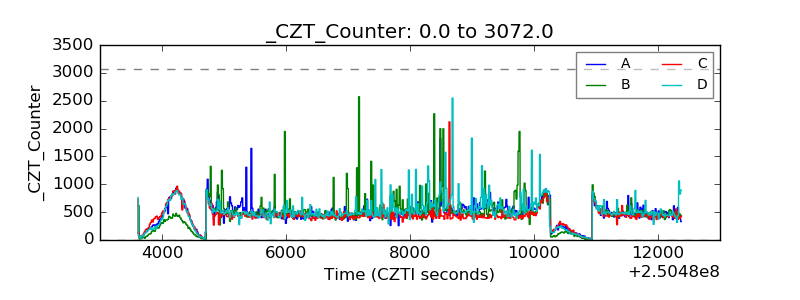 |
| +2.5 Volts monitor |  |
| +5 Volts monitor |  |
| _ROLL_ROT | 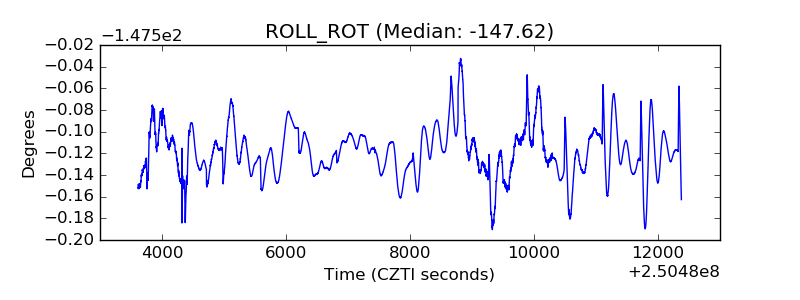 |
| _Roll_DEC | 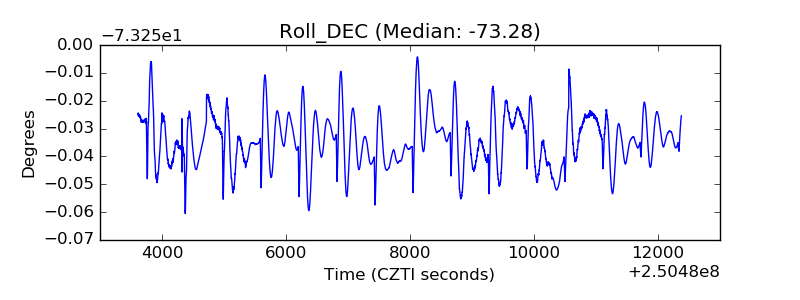 |
| _Roll_RA |  |
| Veto Counter | 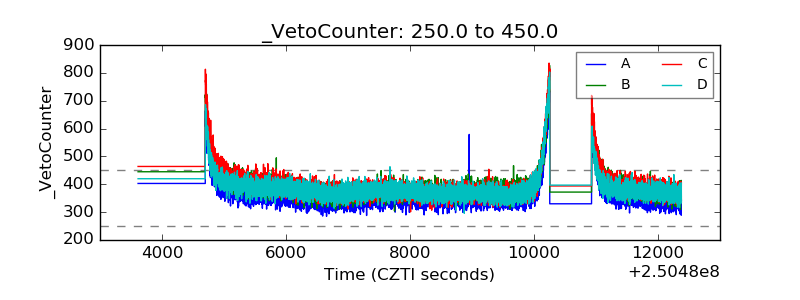 |