| Param | Original file | Final file |
|---|---|---|
| Filename | modeM0/AS1T01_209T01_9000001758_11887cztM0_level2.evt | modeM0/AS1T01_209T01_9000001758_11887cztM0_level2_quad_clean.evt |
| Size (bytes) | 515,249,280 | 98,176,320 |
| Size | 491.4 MB | 93.6 MB |
| Events in quadrant A | 3,614,308 | 630,655 |
| Events in quadrant B | 4,175,718 | 630,019 |
| Events in quadrant C | 3,112,447 | 637,866 |
| Events in quadrant D | 4,228,649 | 589,062 |
| Mode M0 | |||
|---|---|---|---|
| Quadrant | BADHDUFLAG | Total packets | Discarded packets |
| A | 0 | 15256 | 4 |
| B | 0 | 16938 | 3 |
| C | 0 | 14380 | 3 |
| D | 0 | 16914 | 3 |
| Mode SS | |||
|---|---|---|---|
| Quadrant | BADHDUFLAG | Total packets | Discarded packets |
| A | 0 | 142 | 0 |
| B | 0 | 142 | 0 |
| C | 0 | 142 | 0 |
| D | 0 | 142 | 0 |
| Mode M9 | |||
|---|---|---|---|
| Quadrant | BADHDUFLAG | Total packets | Discarded packets |
| A | 0 | 2 | 0 |
| B | 0 | 2 | 0 |
| C | 0 | 2 | 0 |
| D | 0 | 2 | 0 |
| Quadrant | Total seconds | Saturated seconds | Saturation percentage |
|---|---|---|---|
| A | 6969 | 267 | 3.831253% |
| B | 6969 | 489 | 7.016789% |
| C | 6969 | 216 | 3.099440% |
| D | 6969 | 412 | 5.911896% |
Noise dominated data is calculated using 1-second bins in cleaned event files. If a bin has >2000 counts, and if more than 50% of those come from <1% of pixels, then it is considered to be noise-dominated and hence unusable.
| Quadrant | # 1 sec bins | Bins with >0 counts | Bins with >2000 counts | High rate bins dominated by noise | Noise dominated (total time) | Noise dominated (detector-on time) | Marked lightcurve |
|---|---|---|---|---|---|---|---|
| A | 7160 | 6974 | 16 | 16 | 0.22% | 0.23% |  |
| B | 7160 | 6973 | 147 | 147 | 2.05% | 2.11% |  |
| C | 7160 | 6974 | 2 | 2 | 0.03% | 0.03% | 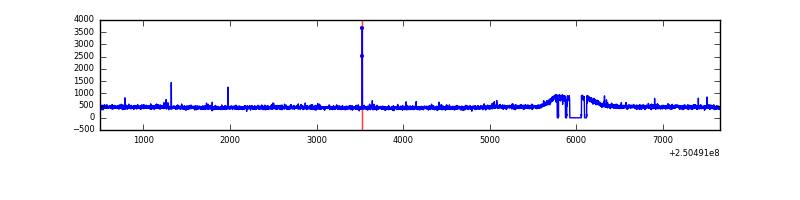 |
| D | 7160 | 6974 | 176 | 176 | 2.46% | 2.52% |  |
Top three noisy pixels from each quadrant. If the there are fewer than three noisy pixels in the level2.evt file, extra rows are filled as -1
| Pixel properties | Quadrant properties | ||||||
|---|---|---|---|---|---|---|---|
| Quadrant | DetID | PixID | Counts | Sigma | Mean | Median | Sigma |
| A | 8 | 15 | 138721 | 835.16 | 808 | 789 | 165.2 |
| A | 1 | 162 | 110176 | 662.33 | 808 | 789 | 165.2 |
| A | 1 | 178 | 53978 | 322.05 | 808 | 789 | 165.2 |
| B | 4 | 239 | 840879 | 5444.55 | 805 | 783 | 154.3 |
| B | 15 | 204 | 97970 | 629.86 | 805 | 783 | 154.3 |
| B | 0 | 214 | 30900 | 195.18 | 805 | 783 | 154.3 |
| C | 0 | 207 | 9424 | 47.0 | 794 | 795 | 183.6 |
| C | 13 | 61 | 5928 | 27.96 | 794 | 795 | 183.6 |
| C | 14 | 234 | 3979 | 17.34 | 794 | 795 | 183.6 |
| D | 1 | 52 | 689350 | 3651.68 | 775 | 750 | 188.6 |
| D | 8 | 195 | 332183 | 1757.6 | 775 | 750 | 188.6 |
| D | 13 | 249 | 97832 | 514.83 | 775 | 750 | 188.6 |
Histogram calculated using DETX and DETY for each event in the final _common_clean file
| Quadrant A | 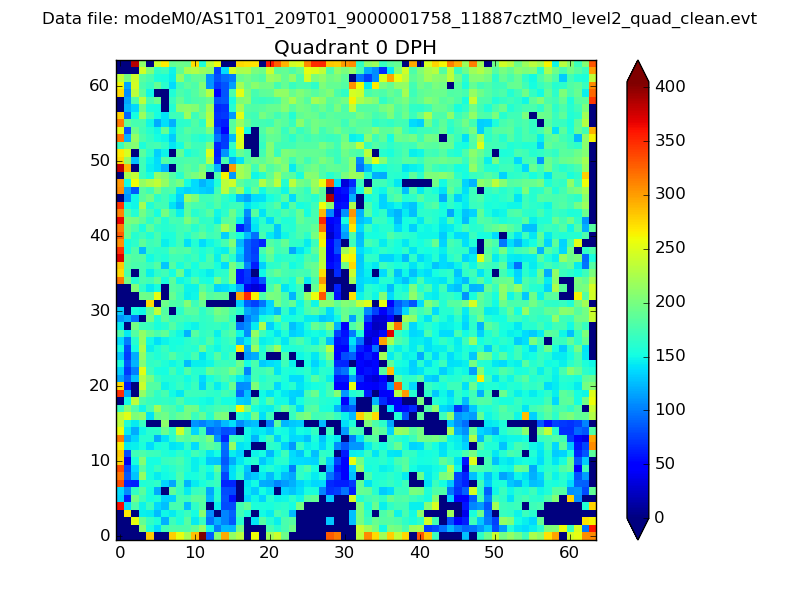 |
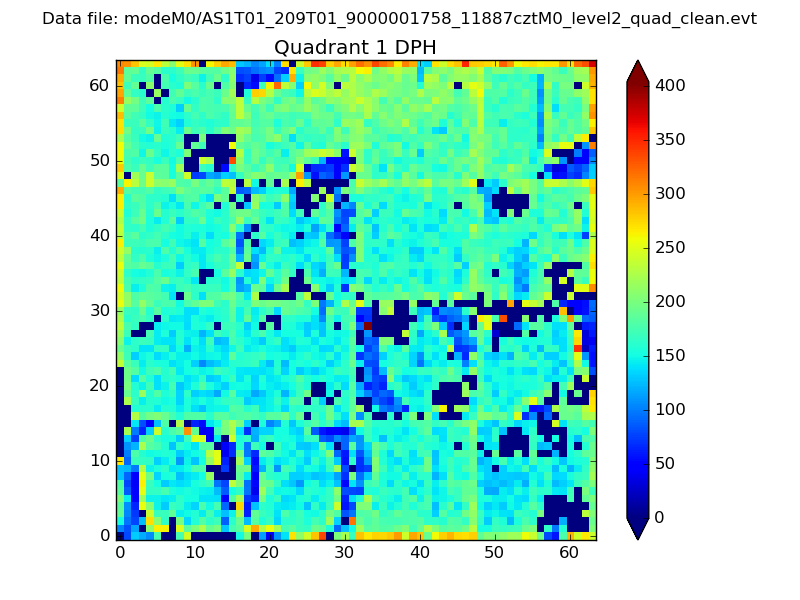 |
Quadrant B |
|---|---|---|---|
| Quadrant D | 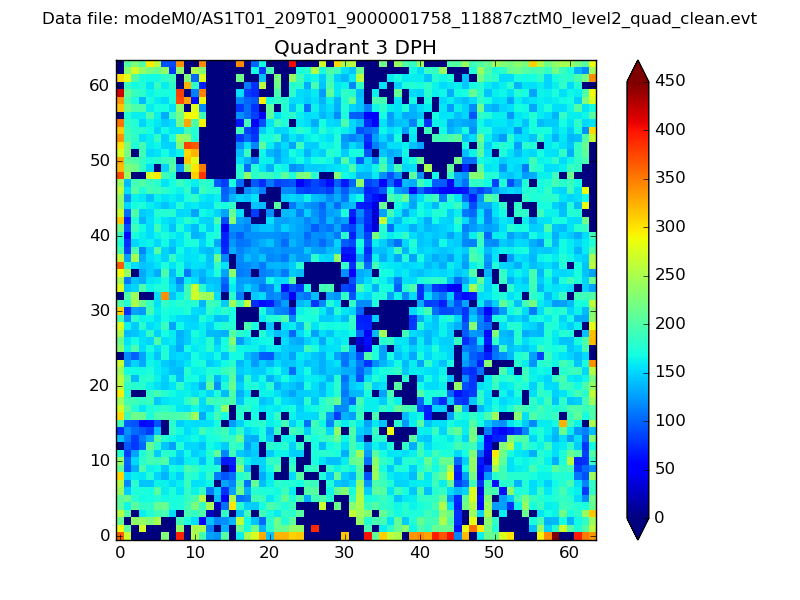 |
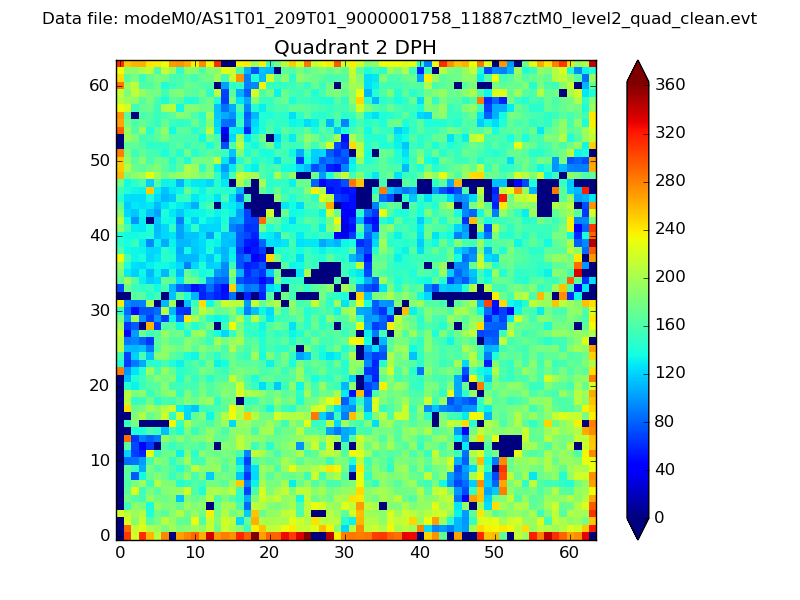 |
Quadrant C |
| Plot type | Count rate plots | Images |
|---|---|---|
| Comparison with Poisson distribution Blue bars denote a histogram of data divided into 1 sec bins. Red curve is a Poisson curve with rate = median count rate of data. |
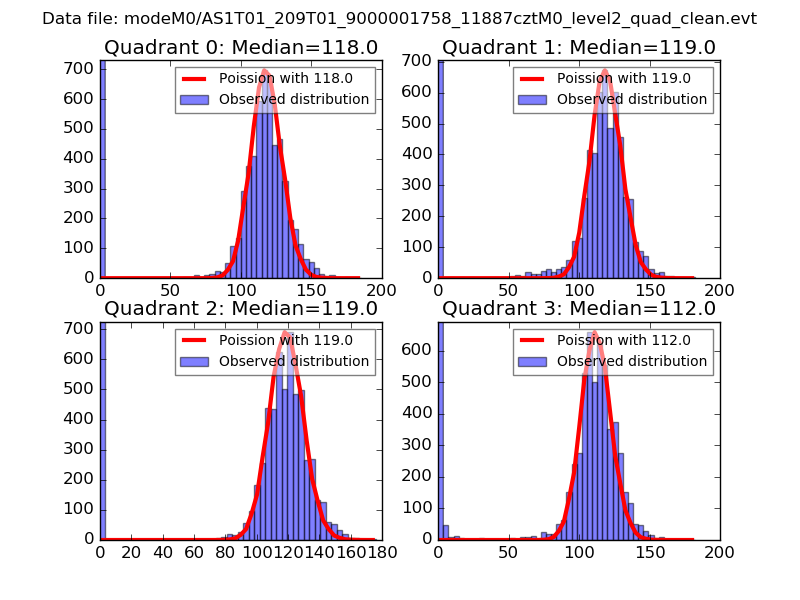 |
 |
| Quadrant-wise count rates Data is divided into 100 sec bins |
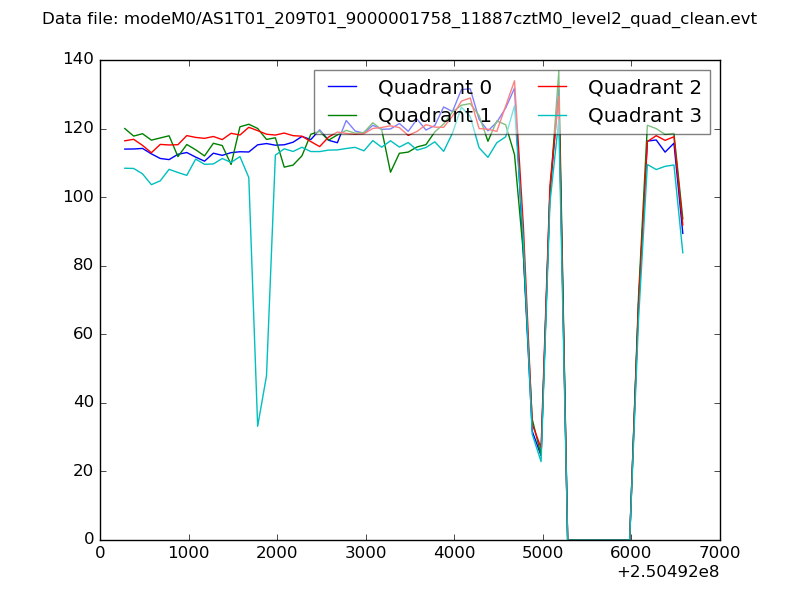 |
|
| Module-wise count rates for Quadrant A Data is divided into 100 sec bins |
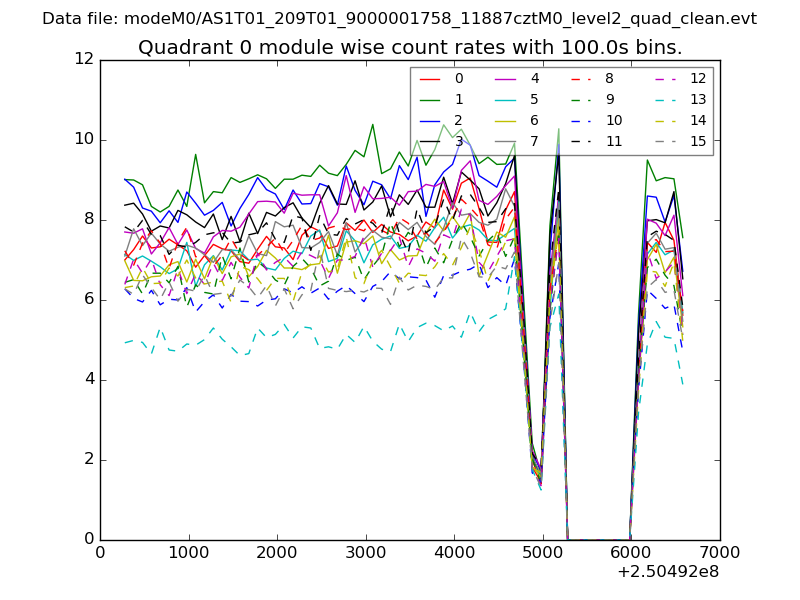 |
 |
| Module-wise count rates for Quadrant B Data is divided into 100 sec bins |
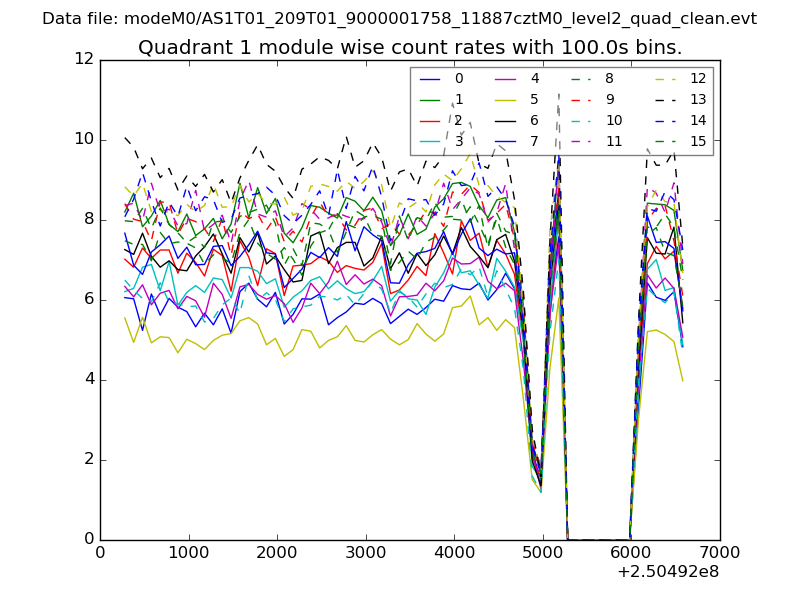 |
 |
| Module-wise count rates for Quadrant C Data is divided into 100 sec bins |
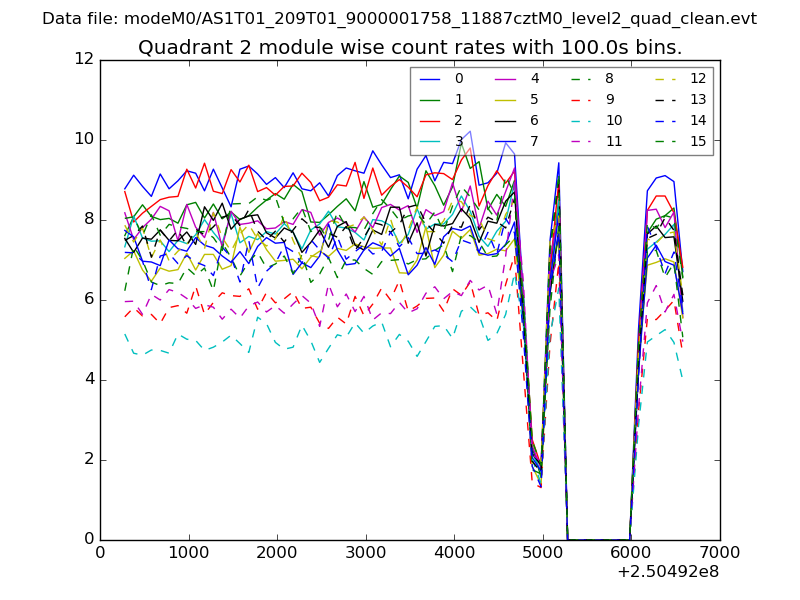 |
 |
| Module-wise count rates for Quadrant D Data is divided into 100 sec bins |
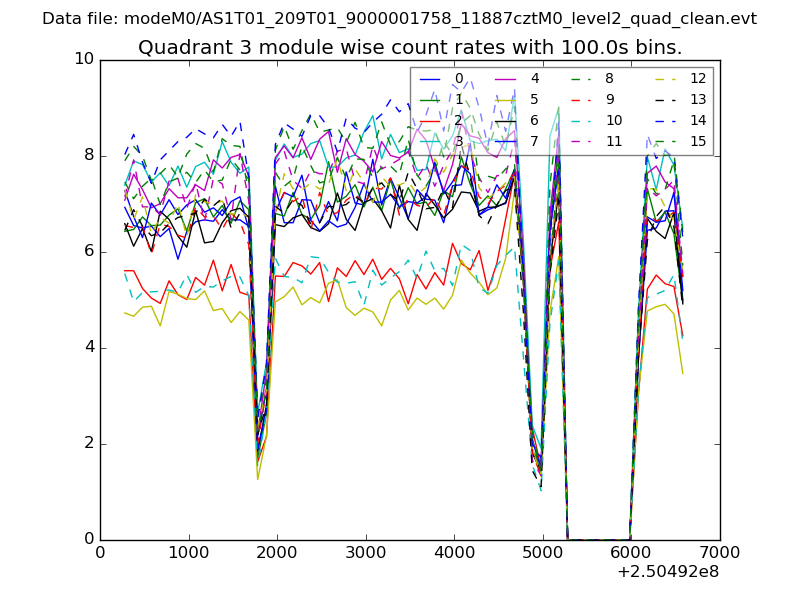 |
 |
| Parameter | Plot |
|---|---|
| CZT HV Monitor | 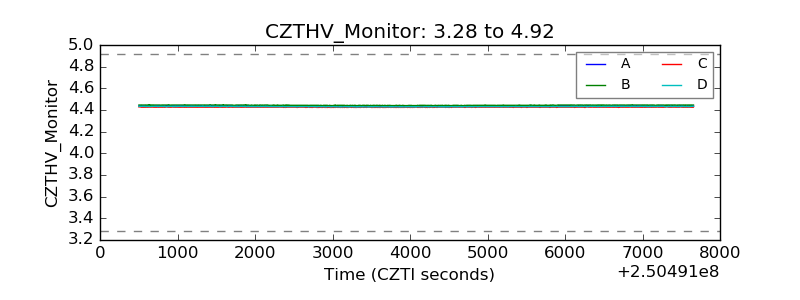 |
| D_VDD | 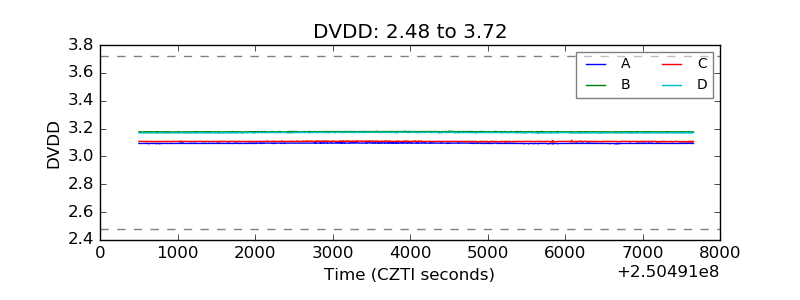 |
| Temperature 1 | 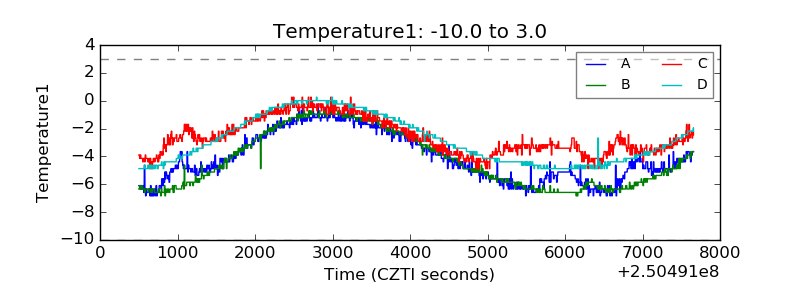 |
| Veto HV Monitor | 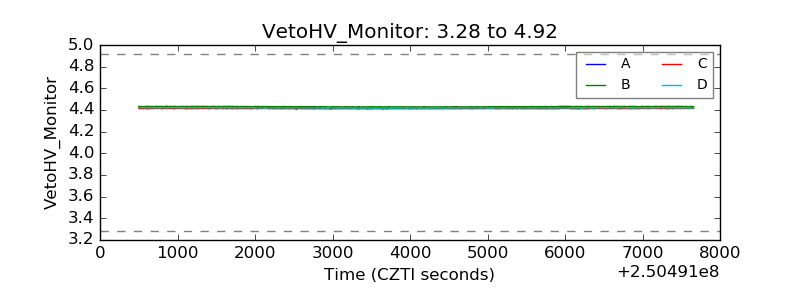 |
| Veto LLD | 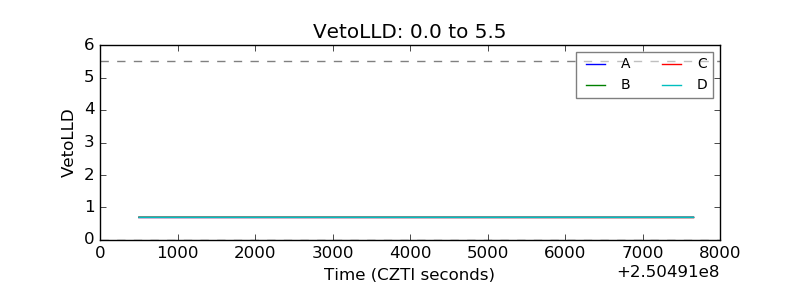 |
| Alpha Counter | 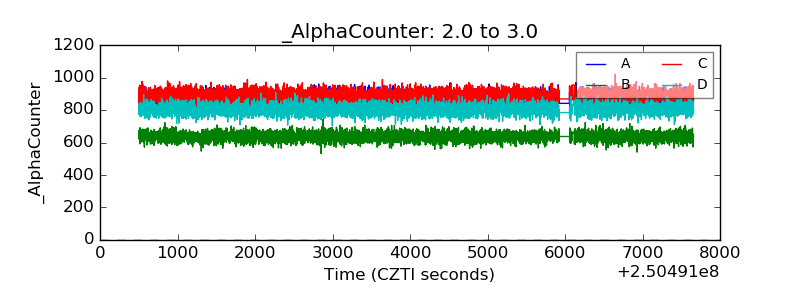 |
| _CPM_Rate | 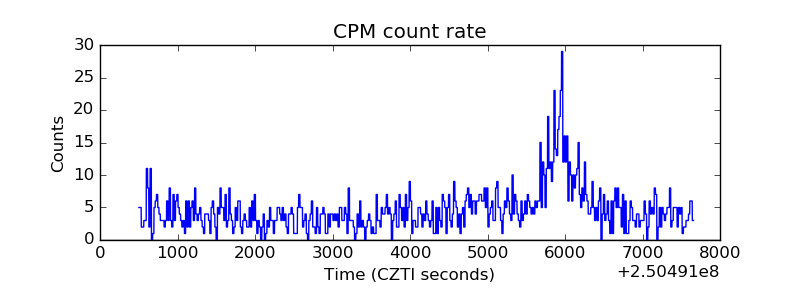 |
| CZT Counter | 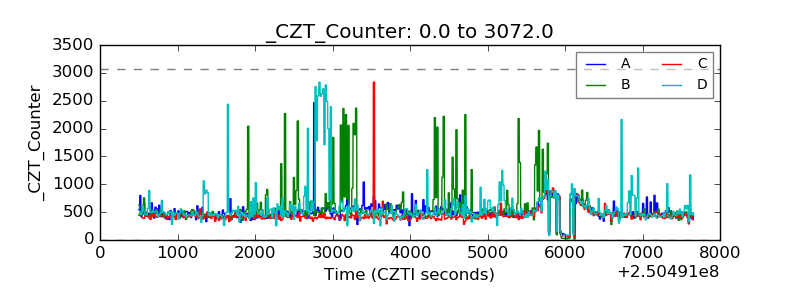 |
| +2.5 Volts monitor |  |
| +5 Volts monitor | 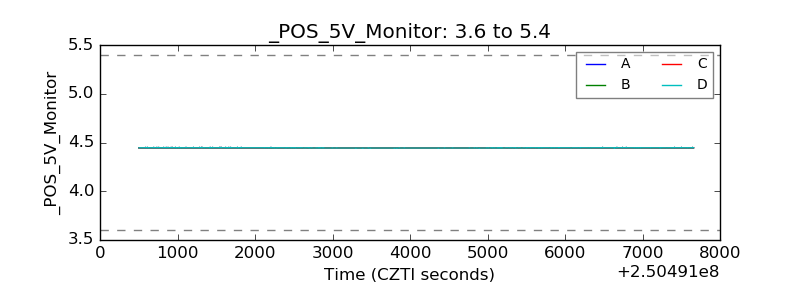 |
| _ROLL_ROT | 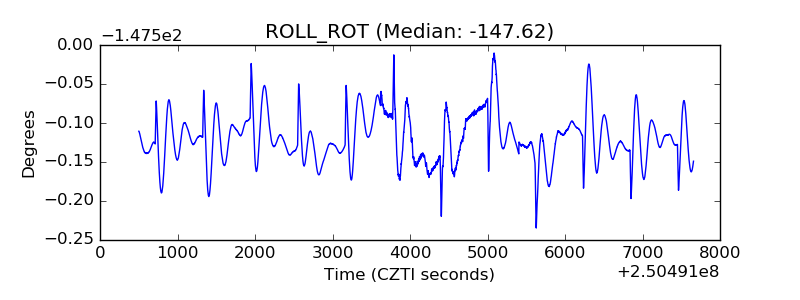 |
| _Roll_DEC | 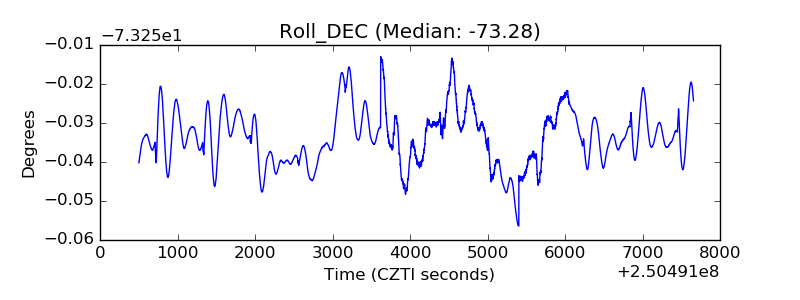 |
| _Roll_RA | 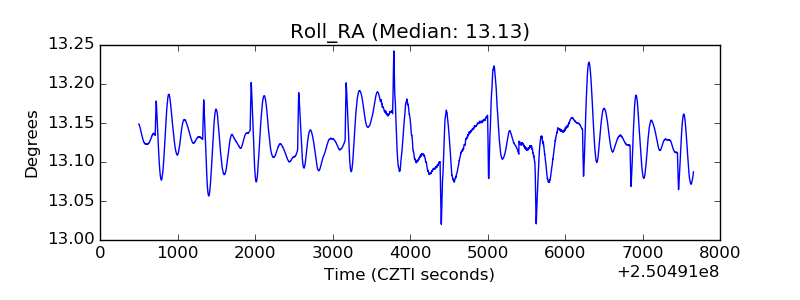 |
| Veto Counter | 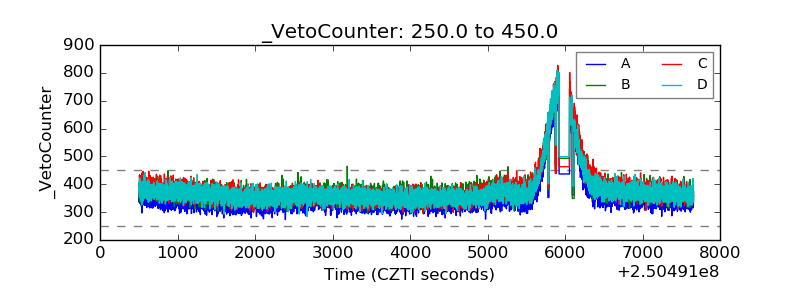 |