| Param | Original file | Final file |
|---|---|---|
| Filename | modeM0/AS1T01_209T01_9000001758_11888cztM0_level2.evt | modeM0/AS1T01_209T01_9000001758_11888cztM0_level2_quad_clean.evt |
| Size (bytes) | 295,061,760 | 58,314,240 |
| Size | 281.4 MB | 55.6 MB |
| Events in quadrant A | 2,226,043 | 369,517 |
| Events in quadrant B | 2,305,302 | 374,954 |
| Events in quadrant C | 1,715,295 | 377,290 |
| Events in quadrant D | 2,410,592 | 355,882 |
| Mode M0 | |||
|---|---|---|---|
| Quadrant | BADHDUFLAG | Total packets | Discarded packets |
| A | 0 | 9280 | 0 |
| B | 0 | 9501 | 0 |
| C | 0 | 8206 | 0 |
| D | 0 | 9808 | 0 |
| Mode SS | |||
|---|---|---|---|
| Quadrant | BADHDUFLAG | Total packets | Discarded packets |
| A | 0 | 82 | 0 |
| B | 0 | 82 | 0 |
| C | 0 | 82 | 0 |
| D | 0 | 82 | 0 |
| Quadrant | Total seconds | Saturated seconds | Saturation percentage |
|---|---|---|---|
| A | 4083 | 77 | 1.885868% |
| B | 4083 | 74 | 1.812393% |
| C | 4083 | 1 | 0.024492% |
| D | 4083 | 65 | 1.591967% |
Noise dominated data is calculated using 1-second bins in cleaned event files. If a bin has >2000 counts, and if more than 50% of those come from <1% of pixels, then it is considered to be noise-dominated and hence unusable.
| Quadrant | # 1 sec bins | Bins with >0 counts | Bins with >2000 counts | High rate bins dominated by noise | Noise dominated (total time) | Noise dominated (detector-on time) | Marked lightcurve |
|---|---|---|---|---|---|---|---|
| A | 4084 | 4084 | 42 | 42 | 1.03% | 1.03% | 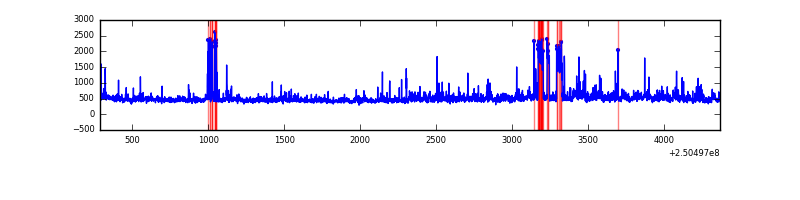 |
| B | 4084 | 4084 | 55 | 55 | 1.35% | 1.35% | 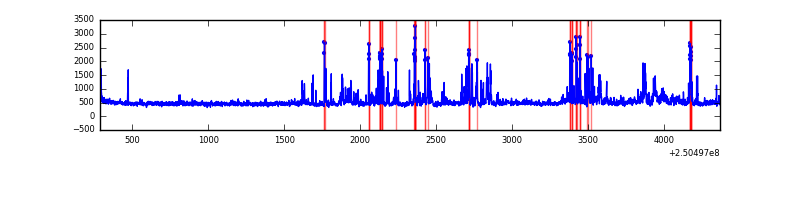 |
| C | 4084 | 4084 | 1 | 1 | 0.02% | 0.02% |  |
| D | 4084 | 4084 | 76 | 76 | 1.86% | 1.86% | 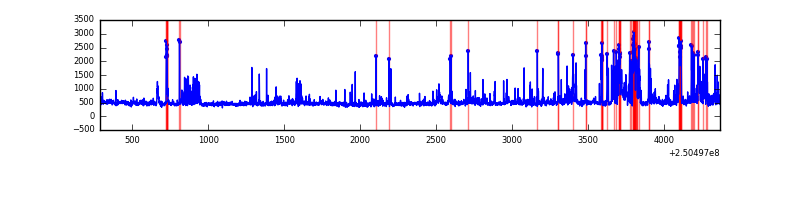 |
Top three noisy pixels from each quadrant. If the there are fewer than three noisy pixels in the level2.evt file, extra rows are filled as -1
| Pixel properties | Quadrant properties | ||||||
|---|---|---|---|---|---|---|---|
| Quadrant | DetID | PixID | Counts | Sigma | Mean | Median | Sigma |
| A | 5 | 16 | 124274 | 1347.47 | 447 | 438 | 91.9 |
| A | 8 | 15 | 84069 | 910.0 | 447 | 438 | 91.9 |
| A | 1 | 162 | 79821 | 863.77 | 447 | 438 | 91.9 |
| B | 4 | 239 | 366516 | 4270.19 | 448 | 438 | 85.7 |
| B | 15 | 204 | 79795 | 925.67 | 448 | 438 | 85.7 |
| B | 10 | 245 | 22668 | 259.31 | 448 | 438 | 85.7 |
| C | 0 | 207 | 12359 | 116.98 | 436 | 438 | 101.9 |
| C | 13 | 61 | 3346 | 28.54 | 436 | 438 | 101.9 |
| C | 14 | 234 | 1693 | 12.32 | 436 | 438 | 101.9 |
| D | 12 | 233 | 268173 | 2498.56 | 433 | 420 | 107.2 |
| D | 8 | 195 | 148585 | 1382.62 | 433 | 420 | 107.2 |
| D | 1 | 52 | 108284 | 1006.54 | 433 | 420 | 107.2 |
Histogram calculated using DETX and DETY for each event in the final _common_clean file
| Quadrant A | 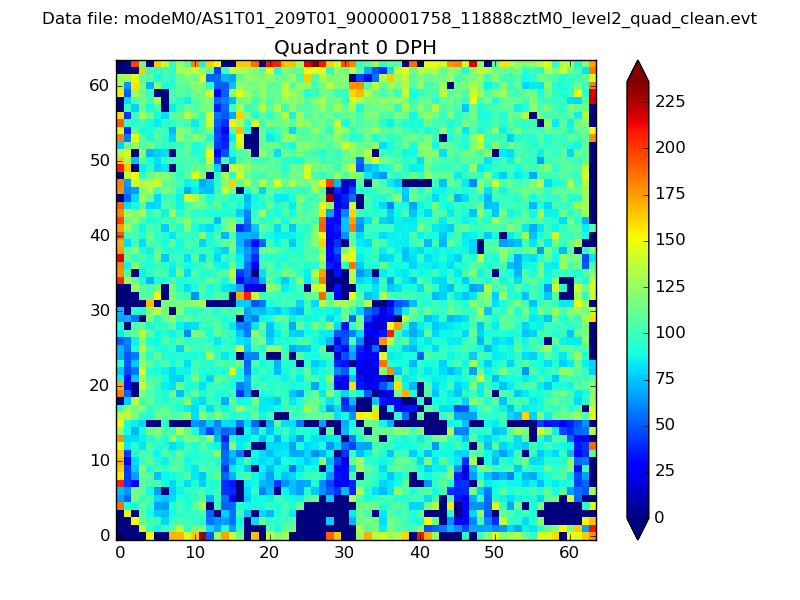 |
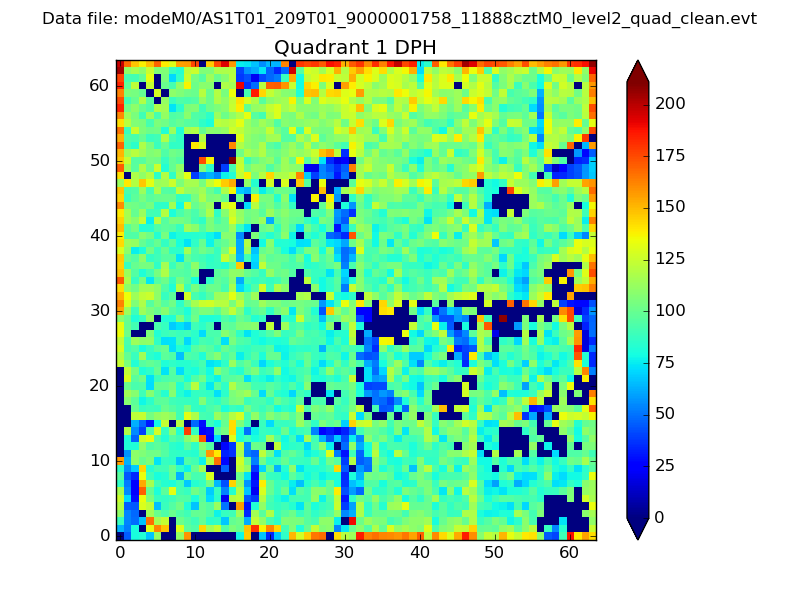 |
Quadrant B |
|---|---|---|---|
| Quadrant D |  |
 |
Quadrant C |
| Plot type | Count rate plots | Images |
|---|---|---|
| Comparison with Poisson distribution Blue bars denote a histogram of data divided into 1 sec bins. Red curve is a Poisson curve with rate = median count rate of data. |
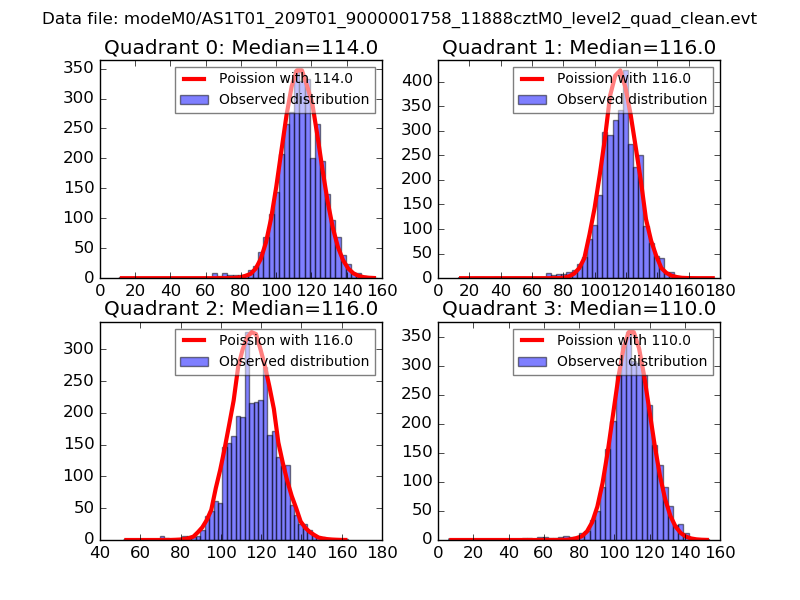 |
 |
| Quadrant-wise count rates Data is divided into 100 sec bins |
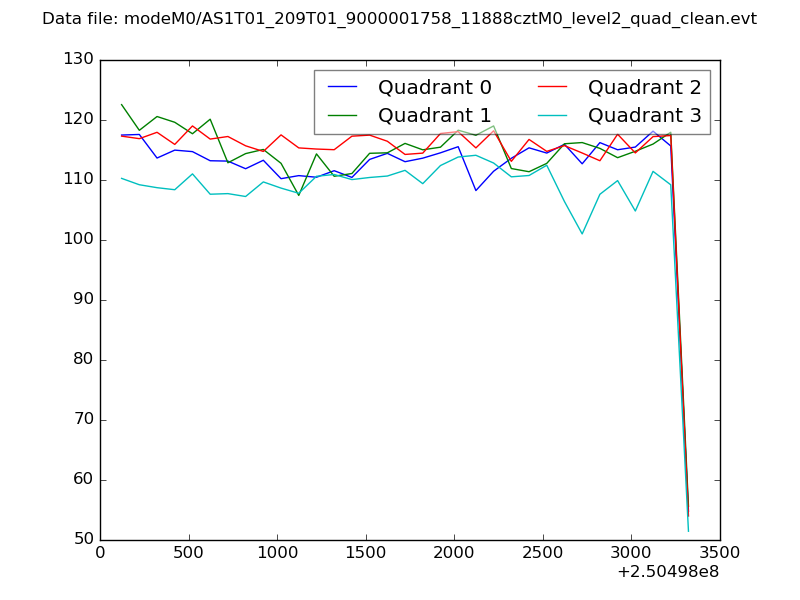 |
|
| Module-wise count rates for Quadrant A Data is divided into 100 sec bins |
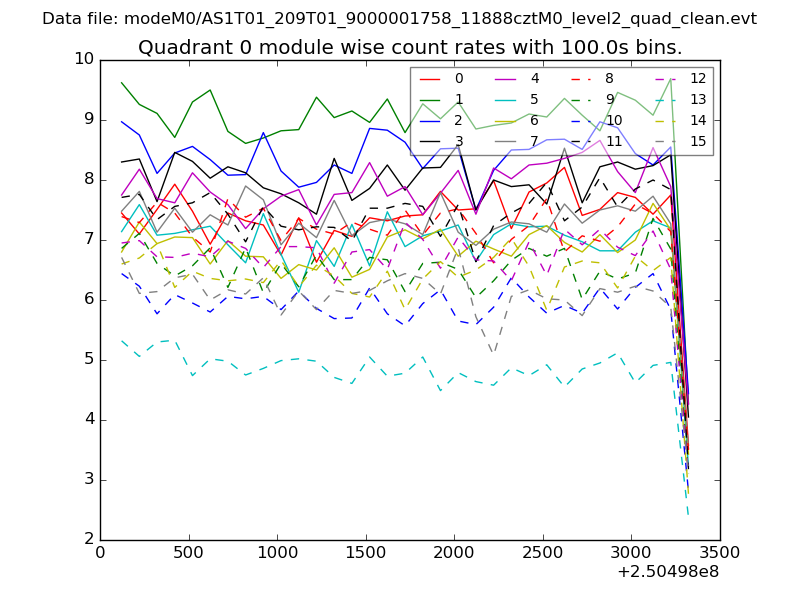 |
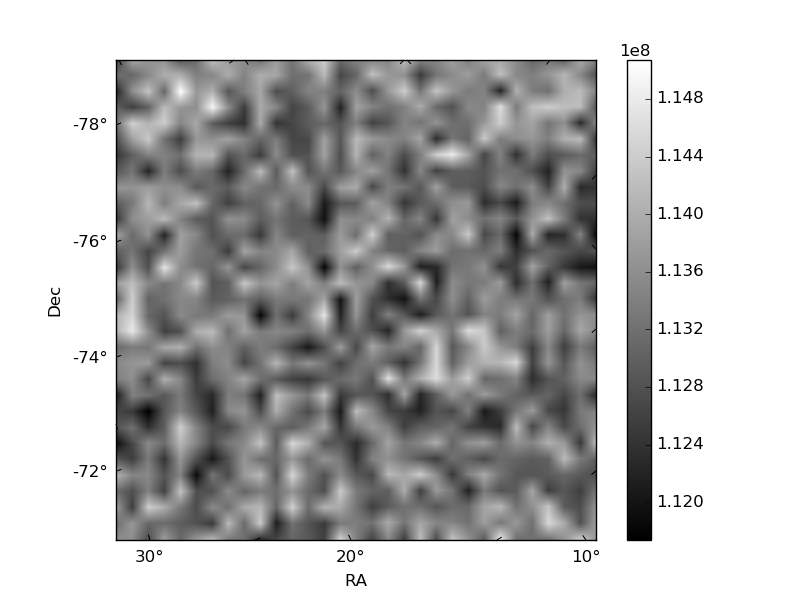 |
| Module-wise count rates for Quadrant B Data is divided into 100 sec bins |
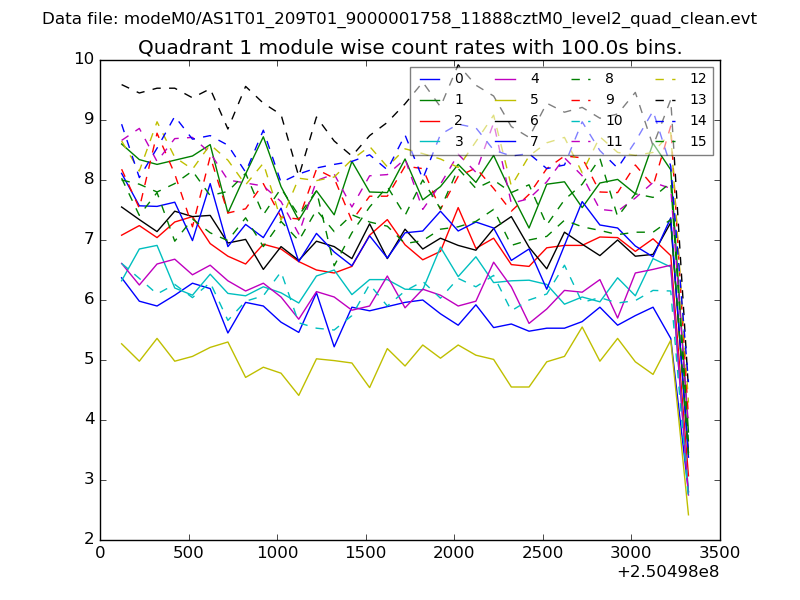 |
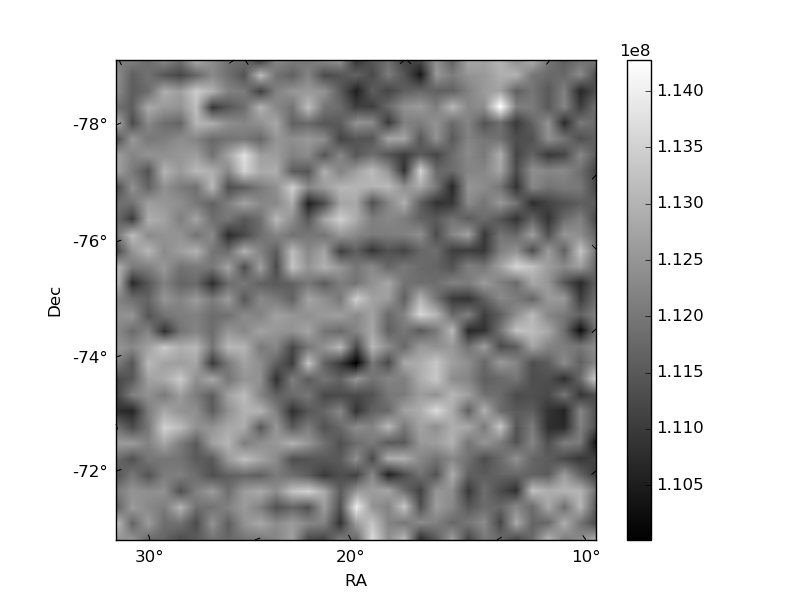 |
| Module-wise count rates for Quadrant C Data is divided into 100 sec bins |
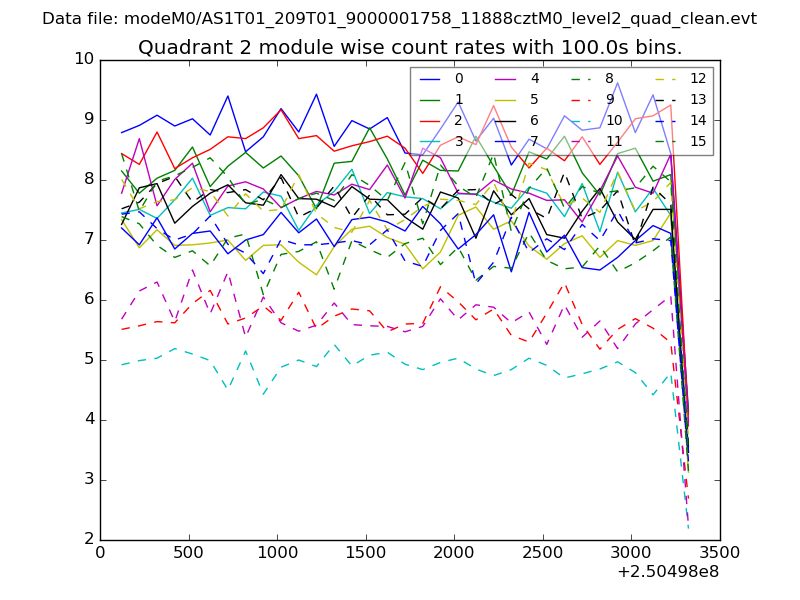 |
 |
| Module-wise count rates for Quadrant D Data is divided into 100 sec bins |
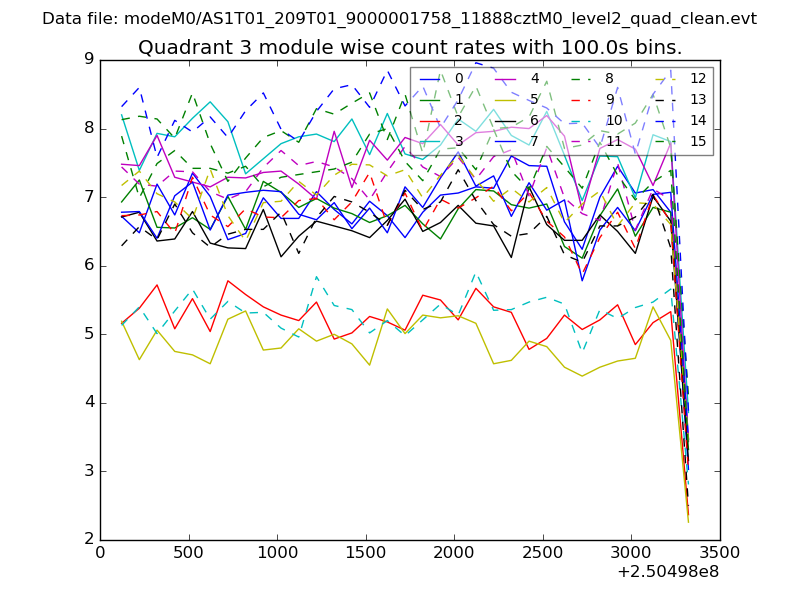 |
 |
| Parameter | Plot |
|---|---|
| CZT HV Monitor | 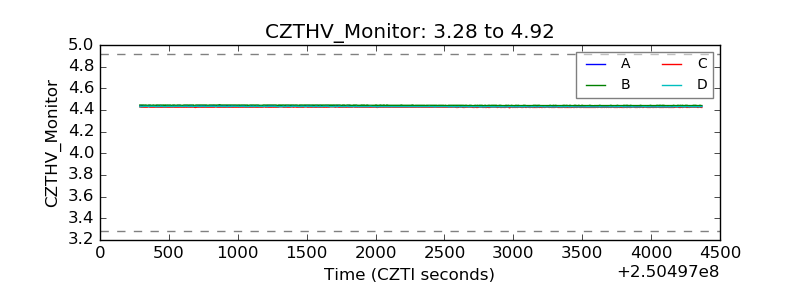 |
| D_VDD | 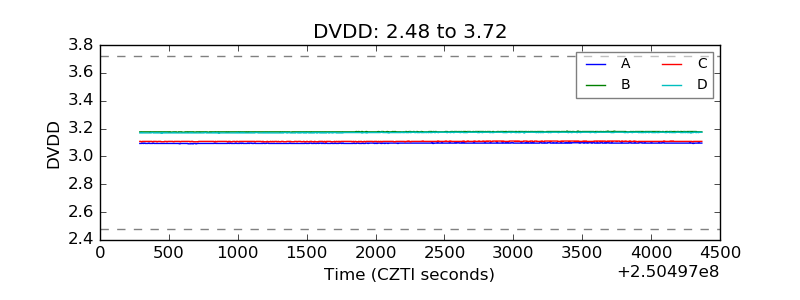 |
| Temperature 1 | 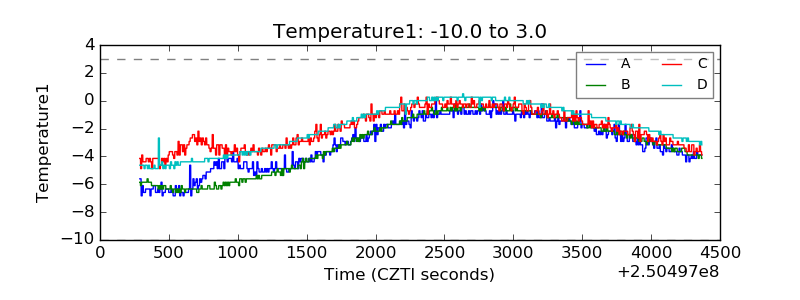 |
| Veto HV Monitor | 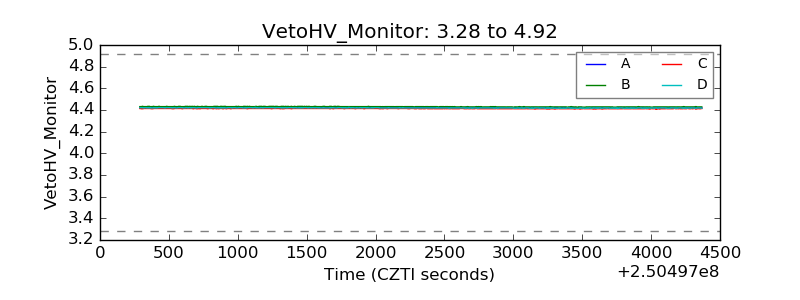 |
| Veto LLD | 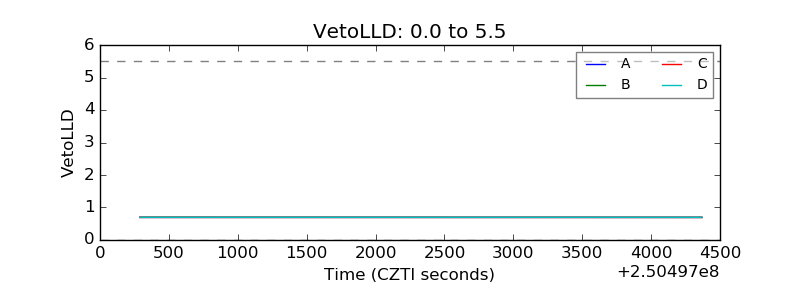 |
| Alpha Counter | 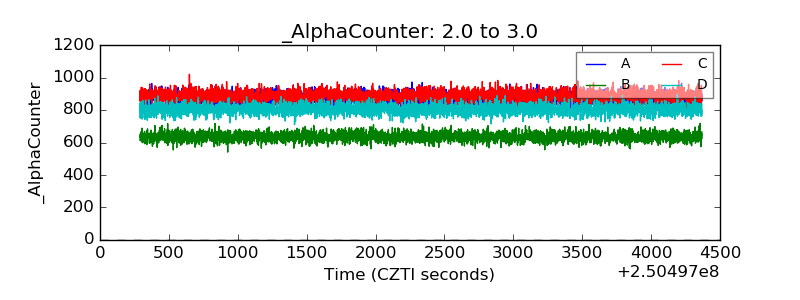 |
| _CPM_Rate | 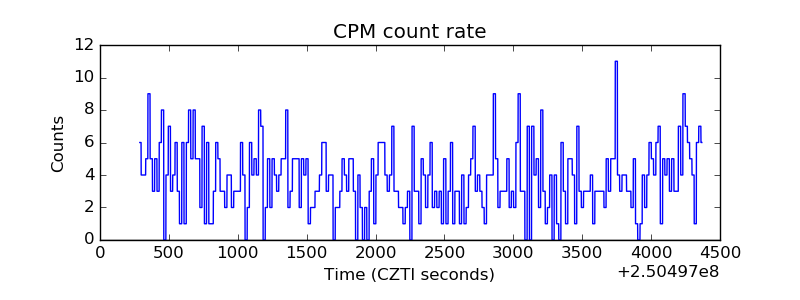 |
| CZT Counter | 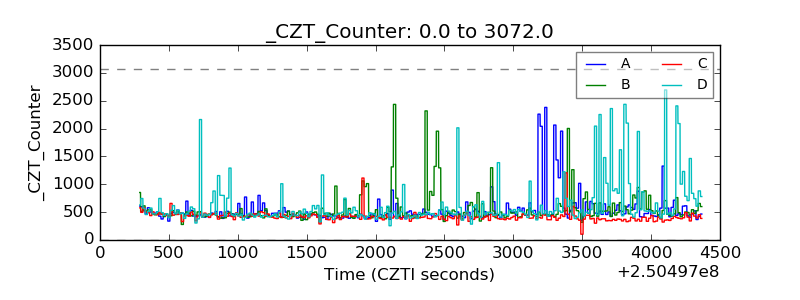 |
| +2.5 Volts monitor |  |
| +5 Volts monitor |  |
| _ROLL_ROT | 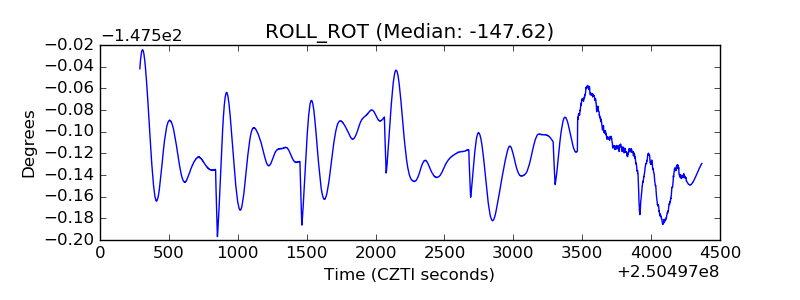 |
| _Roll_DEC | 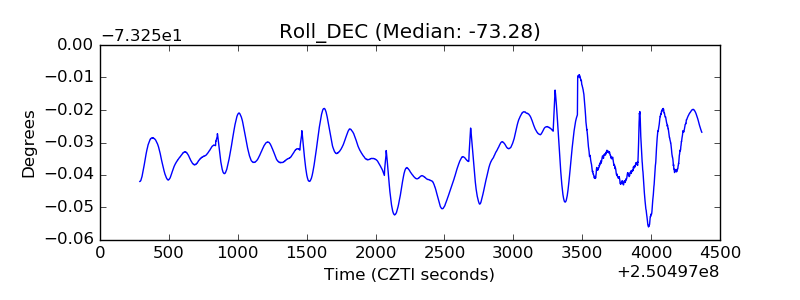 |
| _Roll_RA | 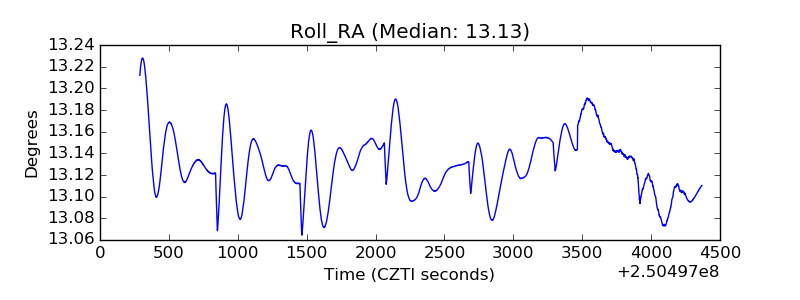 |
| Veto Counter | 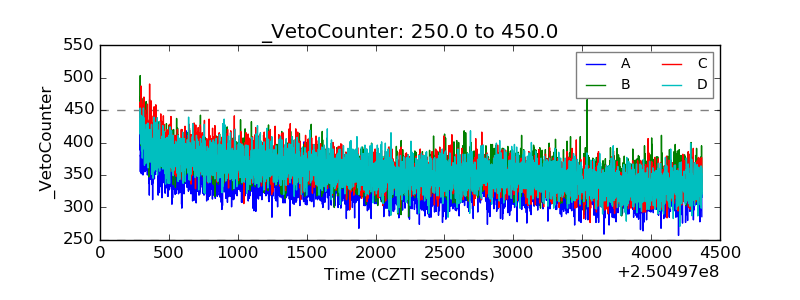 |