| Param | Original file | Final file |
|---|---|---|
| Filename | modeM0/AS1A04_130T01_9000001762cztM0_level2.fits | modeM0/AS1A04_130T01_9000001762cztM0_level2_quad_clean.evt |
| Size (bytes) | 367,505,280 | 271,160,640 |
| Size | 350.5 MB | 258.6 MB |
| Events in quadrant A | 2,234,646 | 1,451,938 |
| Events in quadrant B | 2,123,170 | 1,395,539 |
| Events in quadrant C | 2,213,410 | 1,415,204 |
| Events in quadrant D | 1,891,982 | 1,280,908 |
| Mode SS | |||
|---|---|---|---|
| Quadrant | BADHDUFLAG | Total packets | Discarded packets |
| A | 0 | 792 | 0 |
| B | 0 | 792 | 0 |
| C | 0 | 792 | 0 |
| D | 0 | 792 | 0 |
| Mode M0 | |||
|---|---|---|---|
| Quadrant | BADHDUFLAG | Total packets | Discarded packets |
| A | 0 | 90375 | 0 |
| B | 0 | 96604 | 0 |
| C | 0 | 79412 | 0 |
| D | 0 | 94486 | 0 |
| Mode M9 | |||
|---|---|---|---|
| Quadrant | BADHDUFLAG | Total packets | Discarded packets |
| A | 0 | 77 | 0 |
| B | 0 | 77 | 0 |
| C | 0 | 77 | 0 |
| D | 0 | 77 | 0 |
| Quadrant | Total seconds | Saturated seconds | Saturation percentage |
|---|---|---|---|
| A | 38826 | 514 | 1.323855% |
| B | 38826 | 1724 | 4.440323% |
| C | 38826 | 120 | 0.309071% |
| D | 38826 | 671 | 1.728223% |
Noise dominated data is calculated using 1-second bins in cleaned event files. If a bin has >2000 counts, and if more than 50% of those come from <1% of pixels, then it is considered to be noise-dominated and hence unusable.
| Quadrant | # 1 sec bins | Bins with >0 counts | Bins with >2000 counts | High rate bins dominated by noise | Noise dominated (total time) | Noise dominated (detector-on time) | Marked lightcurve |
|---|---|---|---|---|---|---|---|
| A | 46606 | 38823 | 0 | 0 | 0.00% | 0.00% |  |
| B | 46605 | 38799 | 0 | 0 | 0.00% | 0.00% |  |
| C | 46606 | 38823 | 0 | 0 | 0.00% | 0.00% |  |
| D | 46606 | 38821 | 0 | 0 | 0.00% | 0.00% | 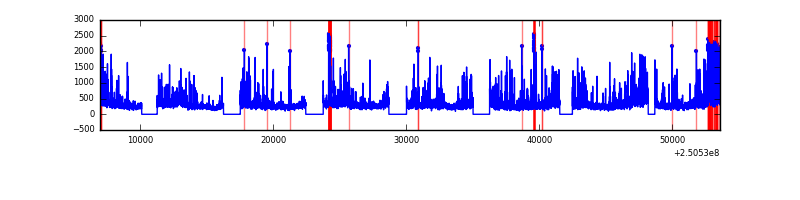 |
Top three noisy pixels from each quadrant. If the there are fewer than three noisy pixels in the level2.evt file, extra rows are filled as -1
| Pixel properties | Quadrant properties | ||||||
|---|---|---|---|---|---|---|---|
| Quadrant | DetID | PixID | Counts | Sigma | Mean | Median | Sigma |
| A | 0 | 29 | 2198 | 11.36 | 582 | 546 | 145.5 |
| A | 7 | 110 | 1832 | 8.84 | 582 | 546 | 145.5 |
| A | 0 | 30 | 1671 | 7.73 | 582 | 546 | 145.5 |
| B | 2 | 9 | 1799 | 11.15 | 562 | 537 | 113.2 |
| B | 14 | 254 | 1446 | 8.03 | 562 | 537 | 113.2 |
| B | 3 | 17 | 1372 | 7.38 | 562 | 537 | 113.2 |
| C | 1 | 80 | 1595 | 6.78 | 584 | 542 | 155.3 |
| C | 1 | 81 | 1585 | 6.72 | 584 | 542 | 155.3 |
| C | 3 | 158 | 1500 | 6.17 | 584 | 542 | 155.3 |
| D | 6 | 231 | 1432 | 6.46 | 539 | 488 | 146.0 |
| D | 3 | 14 | 1398 | 6.23 | 539 | 488 | 146.0 |
| D | 7 | 5 | 1370 | 6.04 | 539 | 488 | 146.0 |
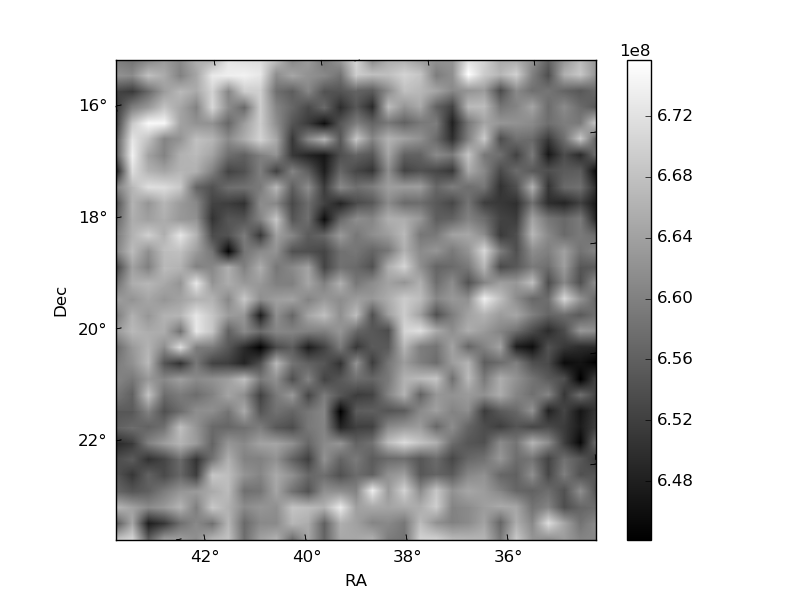
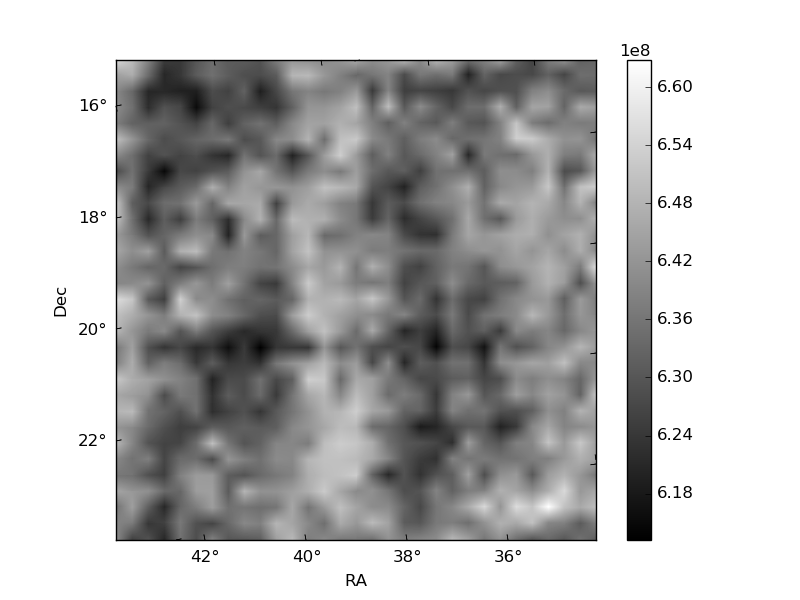
Histogram calculated using DETX and DETY for each event in the final _common_clean file
| Quadrant A | 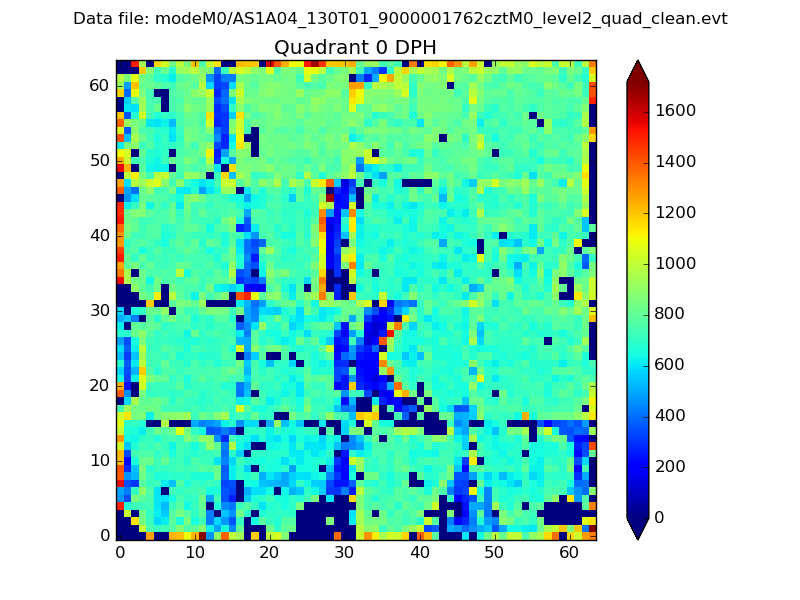 |
 |
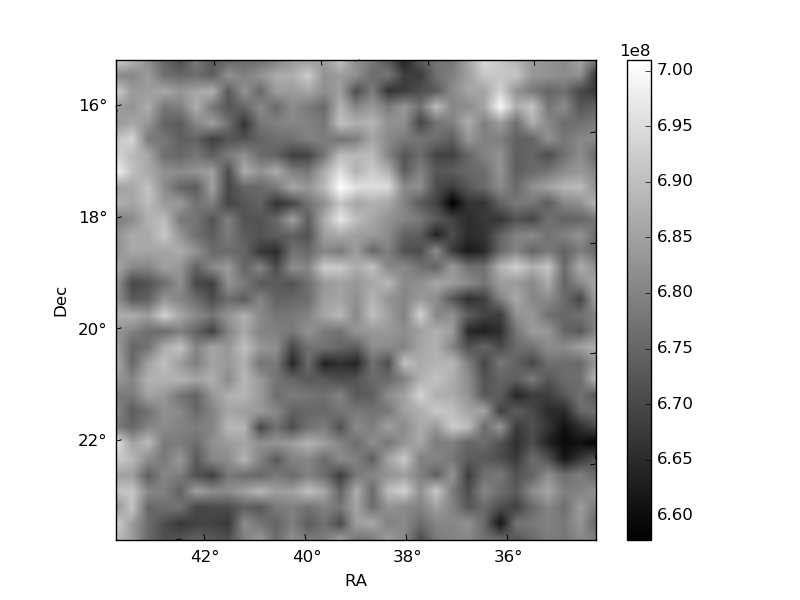
Quadrant B |
|---|---|---|---|
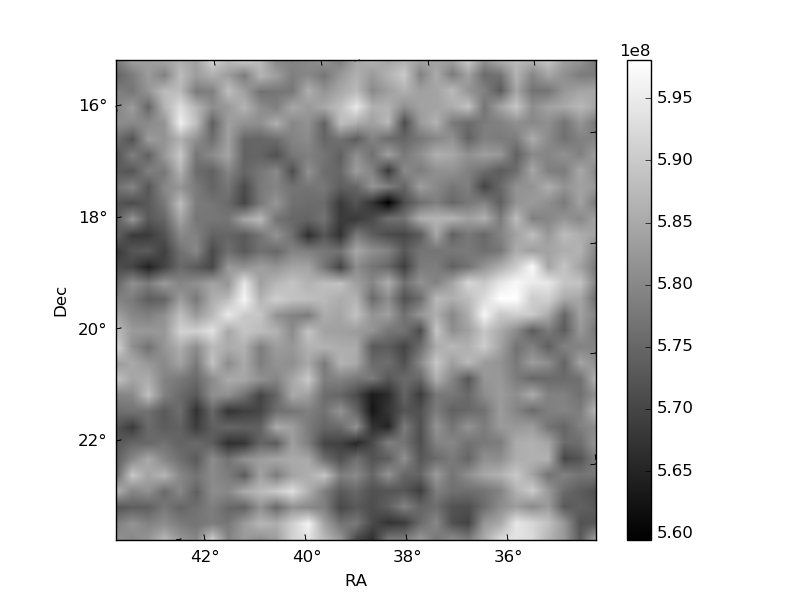
| Quadrant D |  |
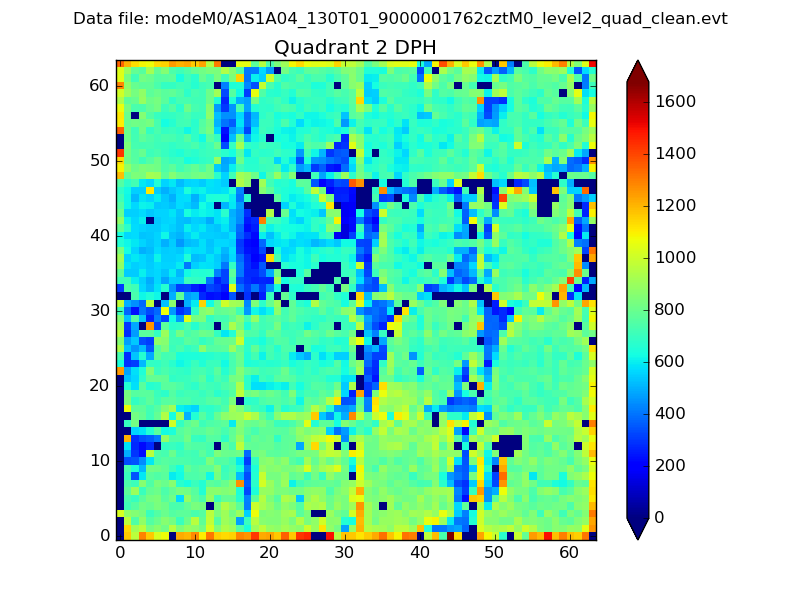 |
Quadrant C |
| Plot type | Count rate plots | Images |
|---|---|---|
| Comparison with Poisson distribution Blue bars denote a histogram of data divided into 1 sec bins. Red curve is a Poisson curve with rate = median count rate of data. |
 |
 |
| Quadrant-wise count rates Data is divided into 100 sec bins |
 |
|
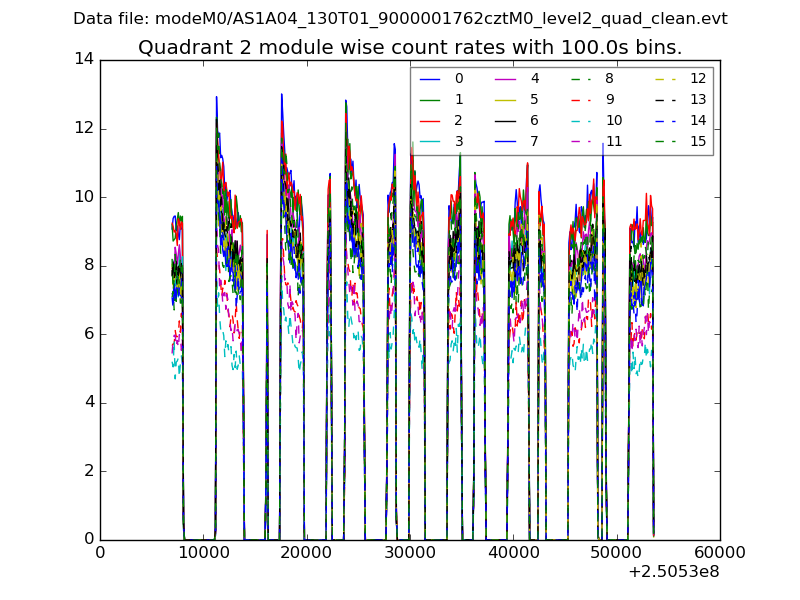
| Module-wise count rates for Quadrant A Data is divided into 100 sec bins |
 |
 |
| Module-wise count rates for Quadrant B Data is divided into 100 sec bins |
 |
 |
| Module-wise count rates for Quadrant C Data is divided into 100 sec bins |
 |
 |
| Module-wise count rates for Quadrant D Data is divided into 100 sec bins |
 |
 |
| Parameter | Plot |
|---|---|
| CZT HV Monitor |  |
| D_VDD |  |
| Temperature 1 | 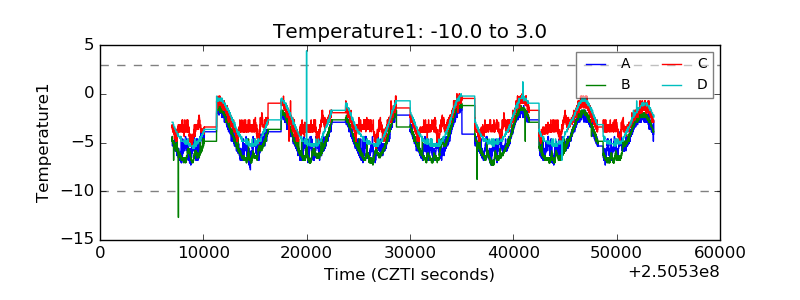 |
| Veto HV Monitor |  |
| Veto LLD | 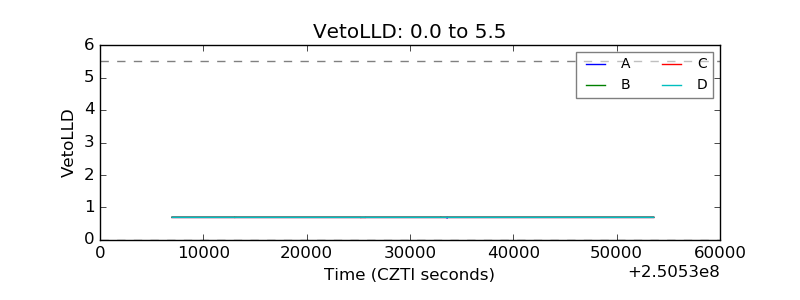 |
| Alpha Counter |  |
| _CPM_Rate |  |
| CZT Counter |  |
| +2.5 Volts monitor |  |
| +5 Volts monitor | 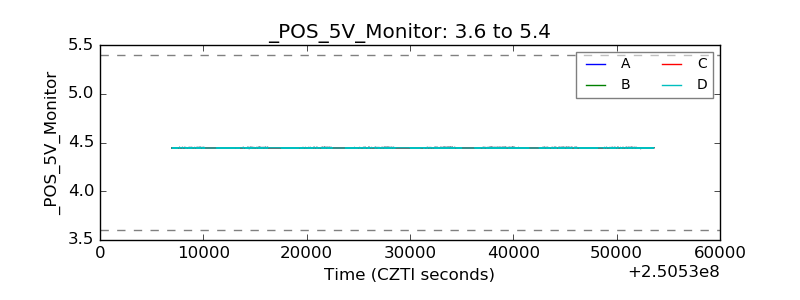 |
| _ROLL_ROT |  |
| _Roll_DEC |  |
| _Roll_RA |  |
| Veto Counter |  |