| Param | Original file | Final file |
|---|---|---|
| Filename | modeM0/AS1A04_130T01_9000001762_11896cztM0_level2.evt | modeM0/AS1A04_130T01_9000001762_11896cztM0_level2_quad_clean.evt |
| Size (bytes) | 493,848,000 | 89,752,320 |
| Size | 471.0 MB | 85.6 MB |
| Events in quadrant A | 3,687,779 | 577,319 |
| Events in quadrant B | 4,225,048 | 567,841 |
| Events in quadrant C | 2,961,669 | 577,440 |
| Events in quadrant D | 3,654,218 | 555,569 |
| Mode SS | |||
|---|---|---|---|
| Quadrant | BADHDUFLAG | Total packets | Discarded packets |
| A | 0 | 128 | 0 |
| B | 0 | 128 | 0 |
| C | 0 | 128 | 0 |
| D | 0 | 128 | 0 |
| Mode M0 | |||
|---|---|---|---|
| Quadrant | BADHDUFLAG | Total packets | Discarded packets |
| A | 0 | 15272 | 3 |
| B | 0 | 16679 | 2 |
| C | 0 | 12961 | 2 |
| D | 0 | 14914 | 2 |
| Mode M9 | |||
|---|---|---|---|
| Quadrant | BADHDUFLAG | Total packets | Discarded packets |
| A | 0 | 16 | 0 |
| B | 0 | 16 | 0 |
| C | 0 | 16 | 0 |
| D | 0 | 17 | 0 |
| Quadrant | Total seconds | Saturated seconds | Saturation percentage |
|---|---|---|---|
| A | 6301 | 62 | 0.983971% |
| B | 6301 | 269 | 4.269164% |
| C | 6301 | 17 | 0.269798% |
| D | 6301 | 41 | 0.650690% |
Noise dominated data is calculated using 1-second bins in cleaned event files. If a bin has >2000 counts, and if more than 50% of those come from <1% of pixels, then it is considered to be noise-dominated and hence unusable.
| Quadrant | # 1 sec bins | Bins with >0 counts | Bins with >2000 counts | High rate bins dominated by noise | Noise dominated (total time) | Noise dominated (detector-on time) | Marked lightcurve |
|---|---|---|---|---|---|---|---|
| A | 7567 | 6303 | 5 | 5 | 0.07% | 0.08% | 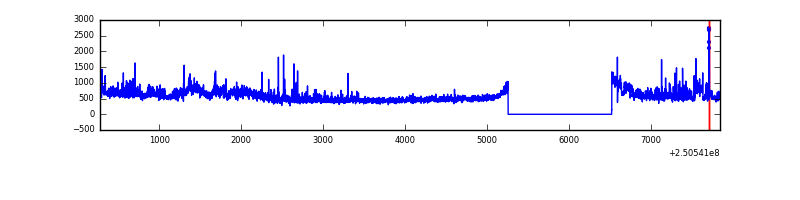 |
| B | 7567 | 6303 | 147 | 147 | 1.94% | 2.33% | 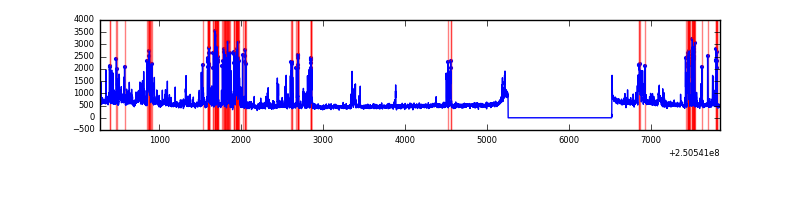 |
| C | 7567 | 6303 | 0 | 0 | 0.00% | 0.00% | 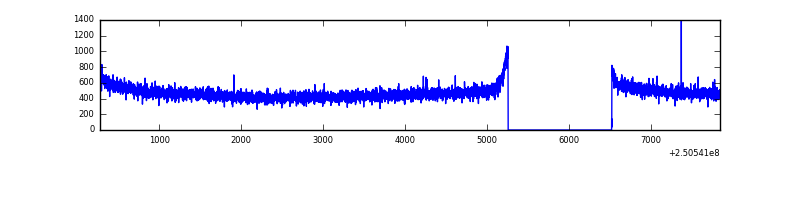 |
| D | 7567 | 6303 | 19 | 19 | 0.25% | 0.30% | 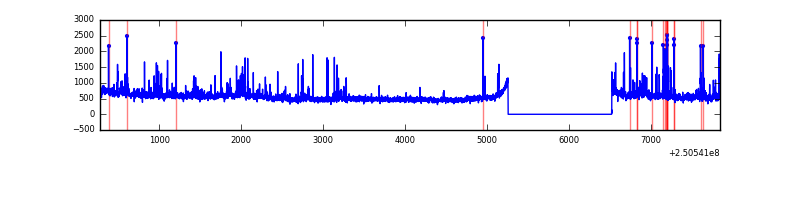 |
Top three noisy pixels from each quadrant. If the there are fewer than three noisy pixels in the level2.evt file, extra rows are filled as -1
| Pixel properties | Quadrant properties | ||||||
|---|---|---|---|---|---|---|---|
| Quadrant | DetID | PixID | Counts | Sigma | Mean | Median | Sigma |
| A | 14 | 63 | 384795 | 2455.49 | 780 | 763 | 156.4 |
| A | 1 | 162 | 100948 | 640.58 | 780 | 763 | 156.4 |
| A | 1 | 178 | 54368 | 342.75 | 780 | 763 | 156.4 |
| B | 4 | 239 | 722912 | 4969.1 | 773 | 755 | 145.3 |
| B | 0 | 231 | 176230 | 1207.43 | 773 | 755 | 145.3 |
| B | 10 | 244 | 100873 | 688.9 | 773 | 755 | 145.3 |
| C | 13 | 61 | 5576 | 27.37 | 759 | 763 | 175.8 |
| C | 14 | 234 | 2140 | 7.83 | 759 | 763 | 175.8 |
| C | 3 | 202 | 1827 | 6.05 | 759 | 763 | 175.8 |
| D | 8 | 195 | 457945 | 2307.55 | 753 | 740 | 198.1 |
| D | 12 | 233 | 102061 | 511.37 | 753 | 740 | 198.1 |
| D | 13 | 249 | 62418 | 311.29 | 753 | 740 | 198.1 |
Histogram calculated using DETX and DETY for each event in the final _common_clean file
| Quadrant A | 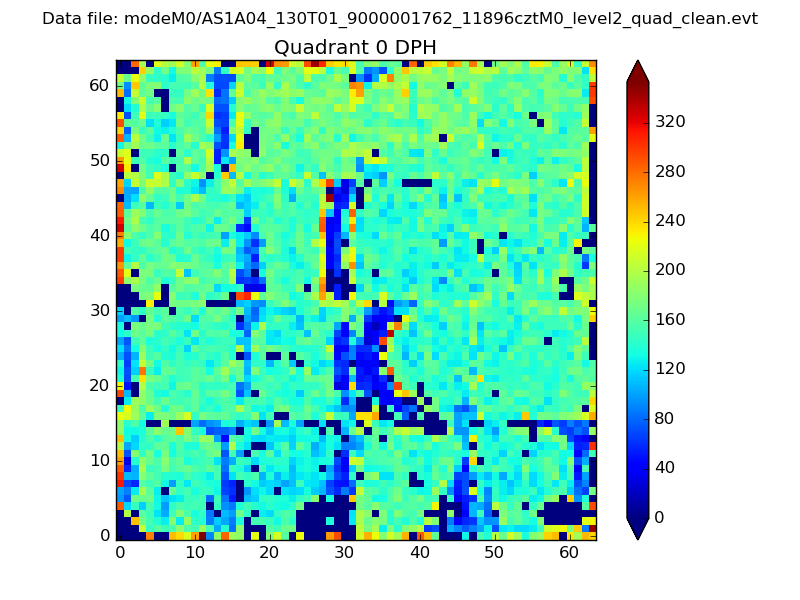 |
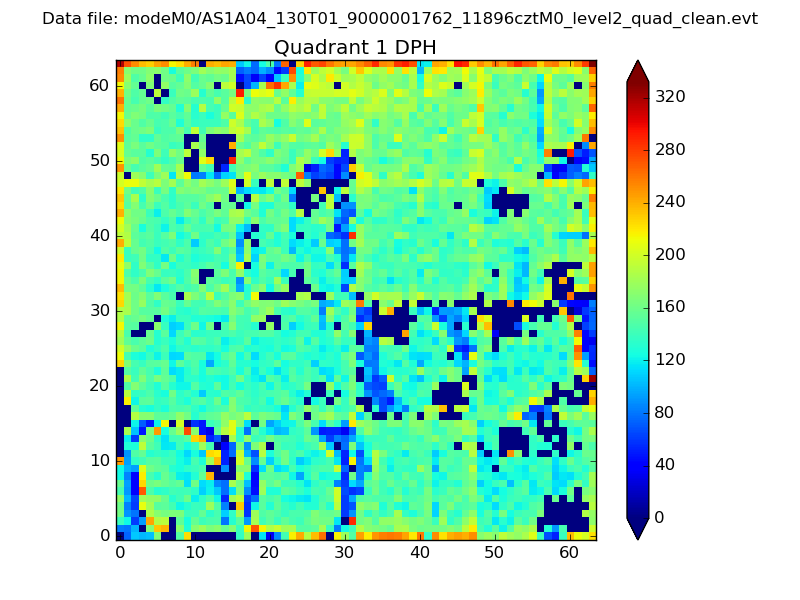 |
Quadrant B |
|---|---|---|---|
| Quadrant D | 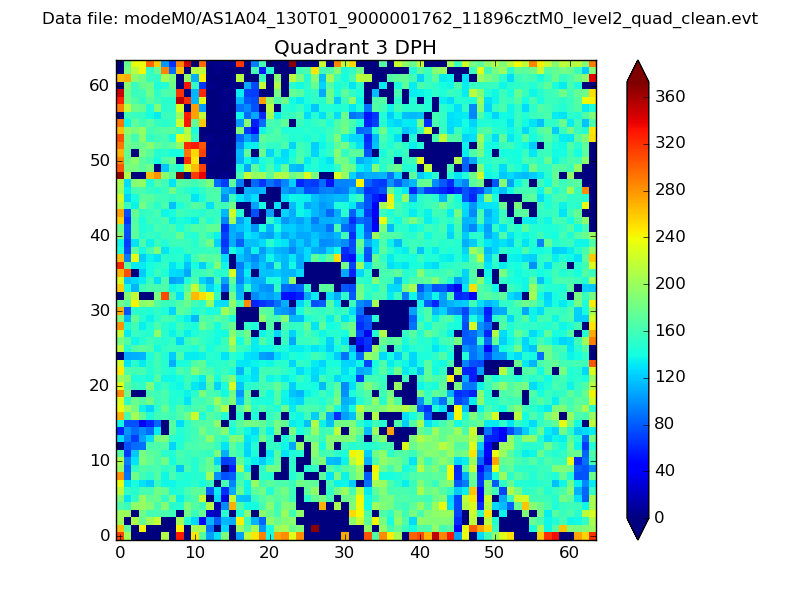 |
 |
Quadrant C |
| Plot type | Count rate plots | Images |
|---|---|---|
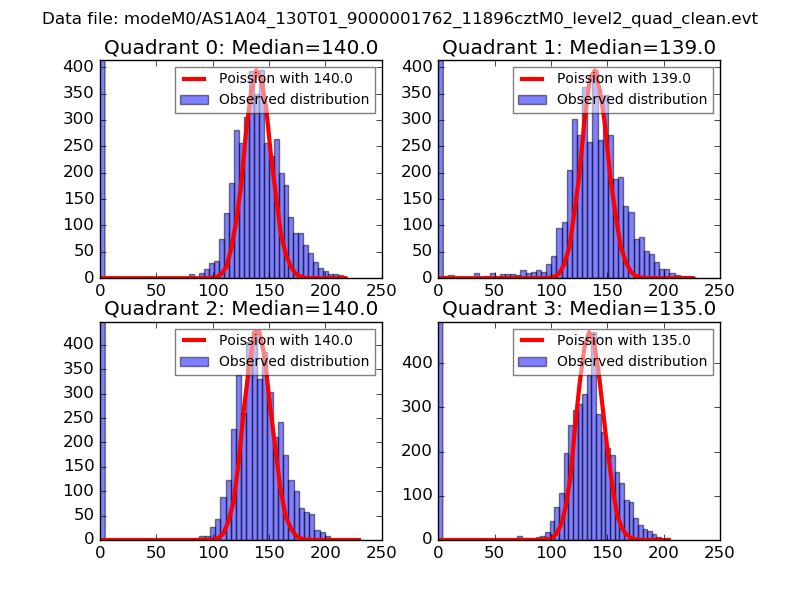
| Comparison with Poisson distribution Blue bars denote a histogram of data divided into 1 sec bins. Red curve is a Poisson curve with rate = median count rate of data. |
 |
 |
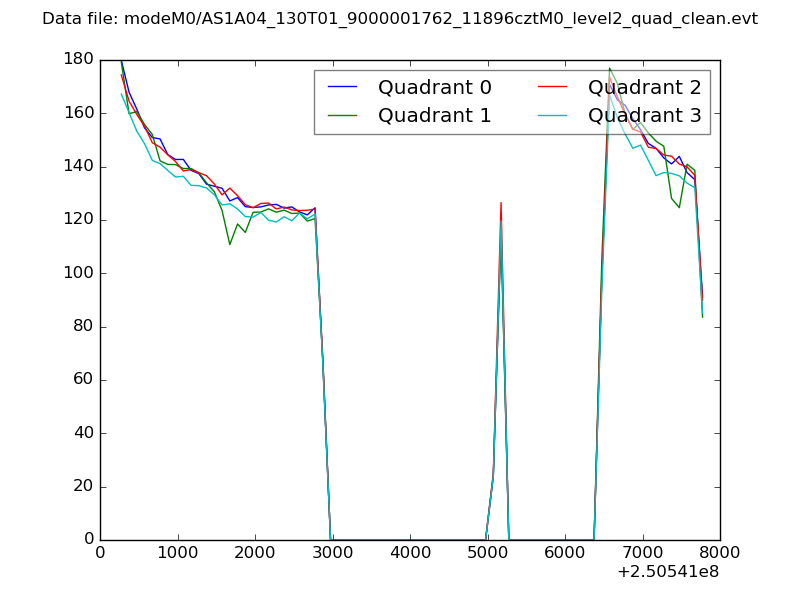
| Quadrant-wise count rates Data is divided into 100 sec bins |
 |
|
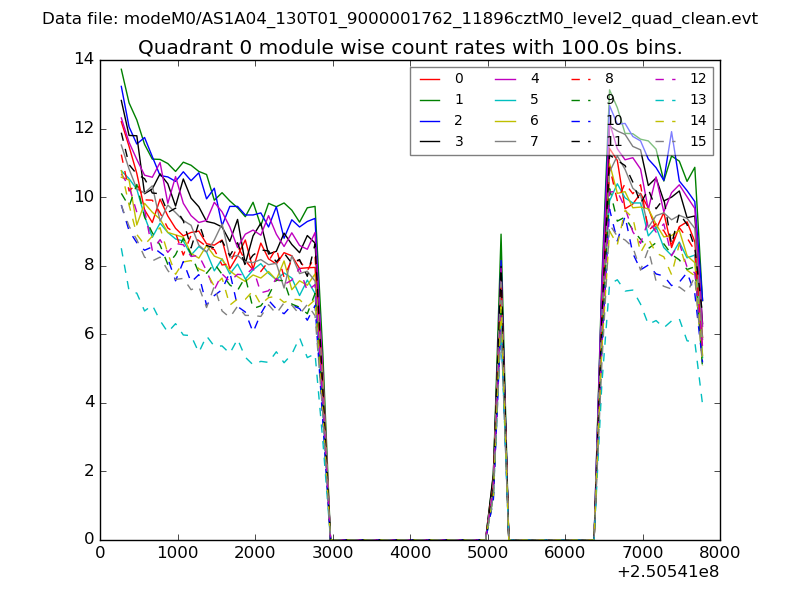
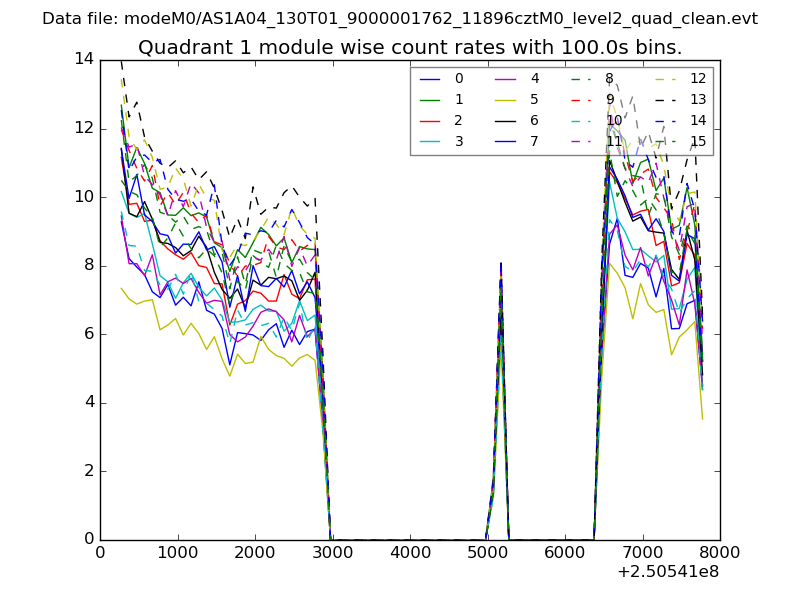
| Module-wise count rates for Quadrant A Data is divided into 100 sec bins |
 |
 |
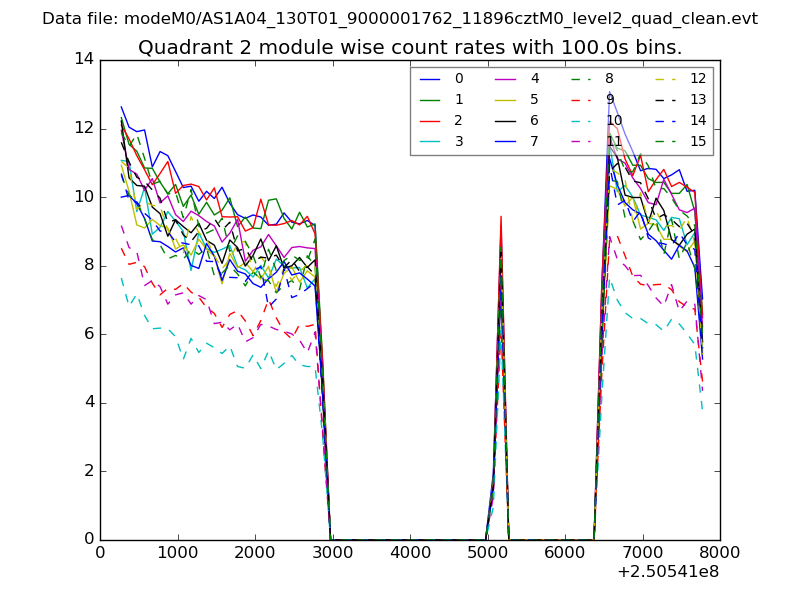
| Module-wise count rates for Quadrant B Data is divided into 100 sec bins |
 |
 |
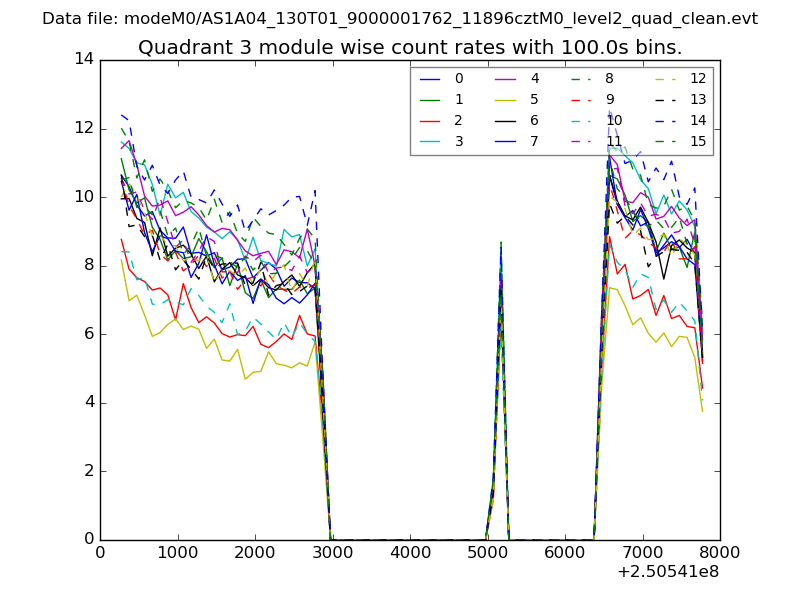
| Module-wise count rates for Quadrant C Data is divided into 100 sec bins |
 |
 |
| Module-wise count rates for Quadrant D Data is divided into 100 sec bins |
 |
 |
| Parameter | Plot |
|---|---|
| CZT HV Monitor | 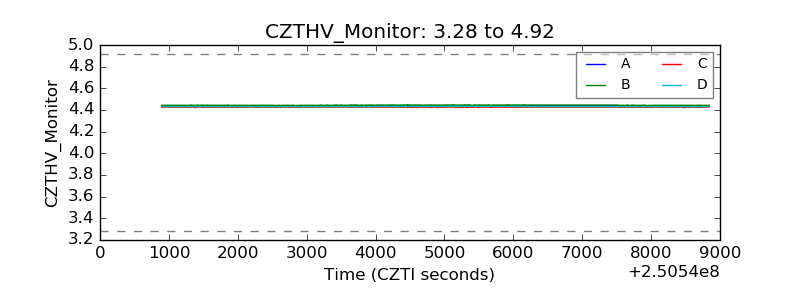 |
| D_VDD | 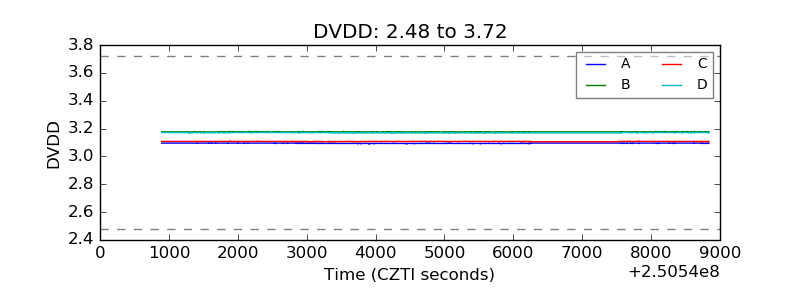 |
| Temperature 1 | 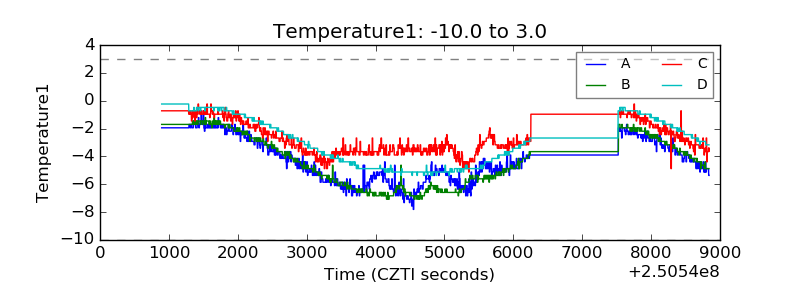 |
| Veto HV Monitor | 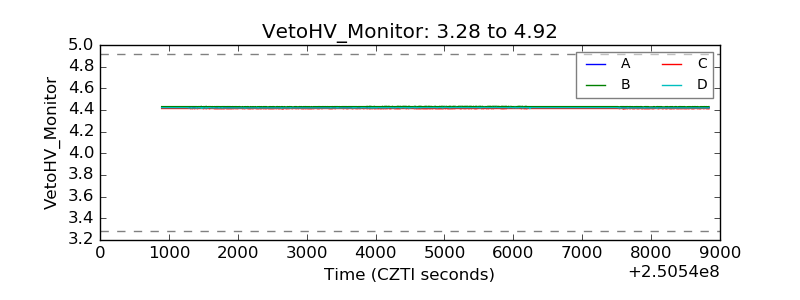 |
| Veto LLD | 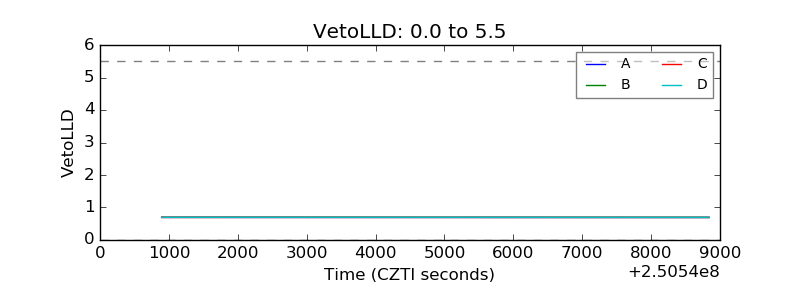 |
| Alpha Counter | 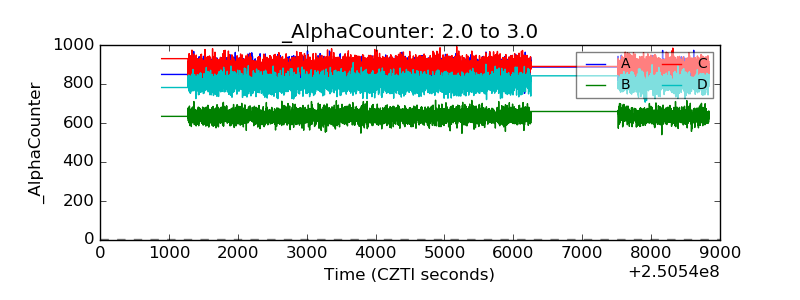 |
| _CPM_Rate | 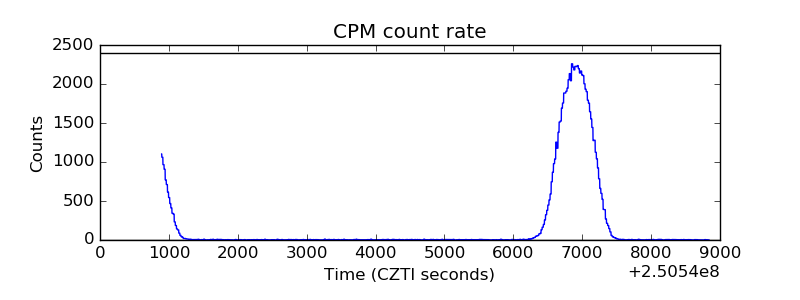 |
| CZT Counter |  |
| +2.5 Volts monitor |  |
| +5 Volts monitor |  |
| _ROLL_ROT | 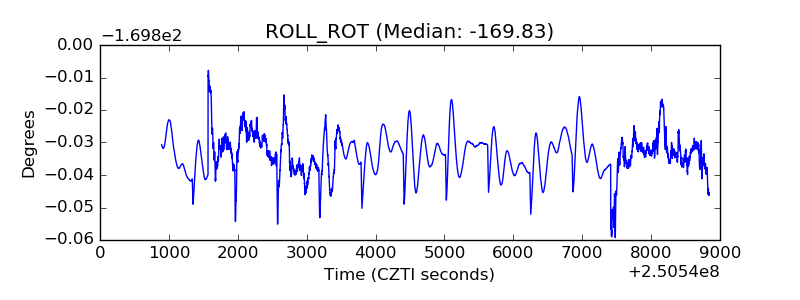 |
| _Roll_DEC | 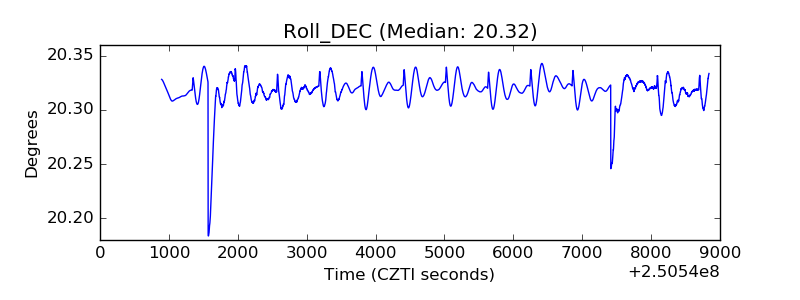 |
| _Roll_RA | 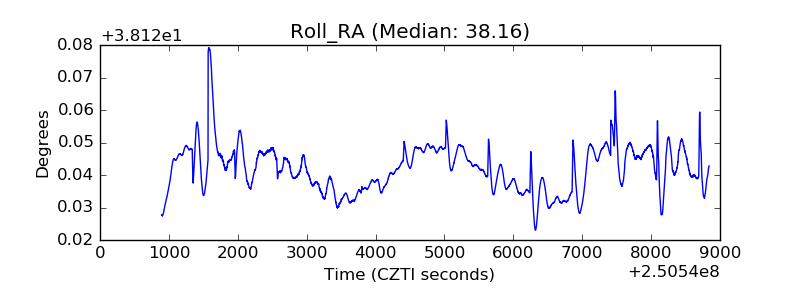 |
| Veto Counter | 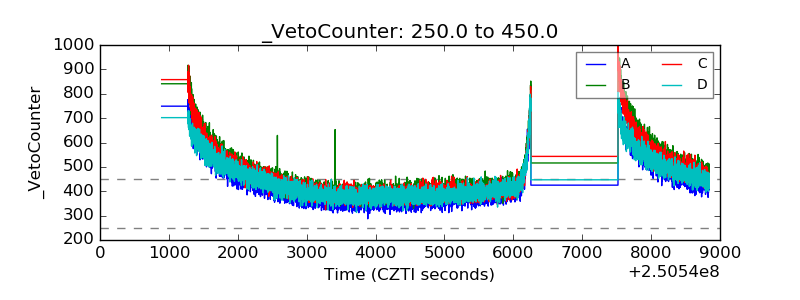 |