| Param | Original file | Final file |
|---|---|---|
| Filename | modeM0/AS1A04_130T01_9000001762_11897cztM0_level2.evt | modeM0/AS1A04_130T01_9000001762_11897cztM0_level2_quad_clean.evt |
| Size (bytes) | 503,233,920 | 87,194,880 |
| Size | 479.9 MB | 83.2 MB |
| Events in quadrant A | 3,804,270 | 561,156 |
| Events in quadrant B | 4,457,345 | 548,383 |
| Events in quadrant C | 2,930,976 | 566,073 |
| Events in quadrant D | 3,631,107 | 536,004 |
| Mode SS | |||
|---|---|---|---|
| Quadrant | BADHDUFLAG | Total packets | Discarded packets |
| A | 0 | 124 | 0 |
| B | 0 | 124 | 0 |
| C | 0 | 124 | 0 |
| D | 0 | 124 | 0 |
| Mode M0 | |||
|---|---|---|---|
| Quadrant | BADHDUFLAG | Total packets | Discarded packets |
| A | 0 | 15419 | 3 |
| B | 0 | 17182 | 2 |
| C | 0 | 12668 | 2 |
| D | 0 | 14630 | 2 |
| Mode M9 | |||
|---|---|---|---|
| Quadrant | BADHDUFLAG | Total packets | Discarded packets |
| A | 0 | 22 | 0 |
| B | 0 | 22 | 0 |
| C | 0 | 22 | 0 |
| D | 0 | 23 | 0 |
| Quadrant | Total seconds | Saturated seconds | Saturation percentage |
|---|---|---|---|
| A | 6145 | 122 | 1.985354% |
| B | 6145 | 499 | 8.120423% |
| C | 6145 | 14 | 0.227828% |
| D | 6145 | 104 | 1.692433% |
Noise dominated data is calculated using 1-second bins in cleaned event files. If a bin has >2000 counts, and if more than 50% of those come from <1% of pixels, then it is considered to be noise-dominated and hence unusable.
| Quadrant | # 1 sec bins | Bins with >0 counts | Bins with >2000 counts | High rate bins dominated by noise | Noise dominated (total time) | Noise dominated (detector-on time) | Marked lightcurve |
|---|---|---|---|---|---|---|---|
| A | 7466 | 6147 | 47 | 47 | 0.63% | 0.76% | 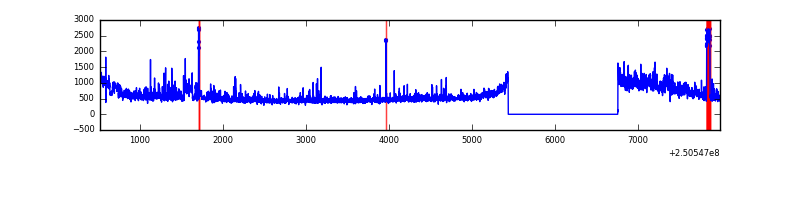 |
| B | 7466 | 6147 | 341 | 341 | 4.57% | 5.55% | 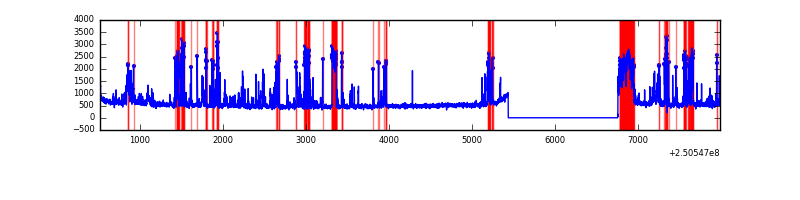 |
| C | 7466 | 6147 | 0 | 0 | 0.00% | 0.00% | 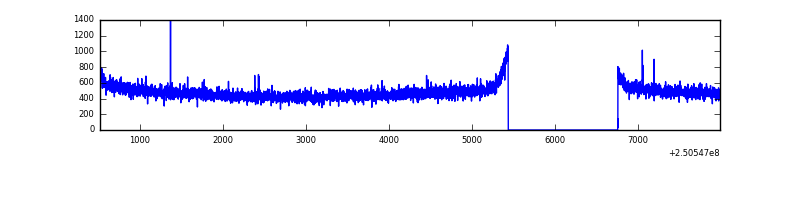 |
| D | 7466 | 6147 | 94 | 94 | 1.26% | 1.53% | 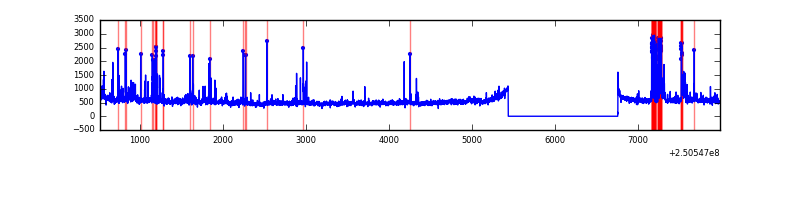 |
Top three noisy pixels from each quadrant. If the there are fewer than three noisy pixels in the level2.evt file, extra rows are filled as -1
| Pixel properties | Quadrant properties | ||||||
|---|---|---|---|---|---|---|---|
| Quadrant | DetID | PixID | Counts | Sigma | Mean | Median | Sigma |
| A | 14 | 63 | 586172 | 3844.94 | 764 | 751 | 152.3 |
| A | 1 | 162 | 100355 | 654.18 | 764 | 751 | 152.3 |
| A | 1 | 178 | 49837 | 322.39 | 764 | 751 | 152.3 |
| B | 4 | 239 | 975489 | 6985.95 | 748 | 731 | 139.5 |
| B | 10 | 252 | 236977 | 1693.14 | 748 | 731 | 139.5 |
| B | 10 | 244 | 100847 | 717.52 | 748 | 731 | 139.5 |
| C | 13 | 61 | 5389 | 26.71 | 749 | 753 | 173.6 |
| C | 14 | 234 | 4857 | 23.64 | 749 | 753 | 173.6 |
| C | 8 | 128 | 3652 | 16.7 | 749 | 753 | 173.6 |
| D | 8 | 195 | 373272 | 2121.32 | 740 | 720 | 175.6 |
| D | 12 | 233 | 246343 | 1398.58 | 740 | 720 | 175.6 |
| D | 10 | 50 | 60533 | 340.58 | 740 | 720 | 175.6 |
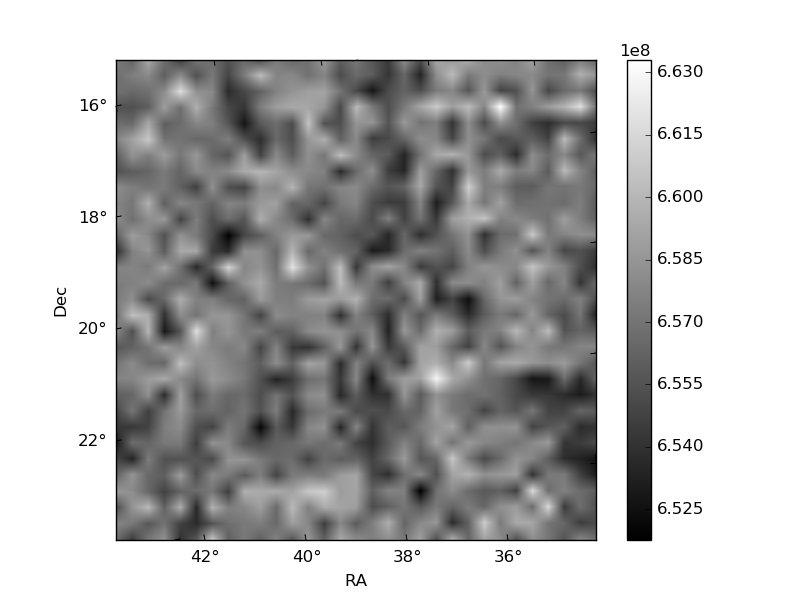
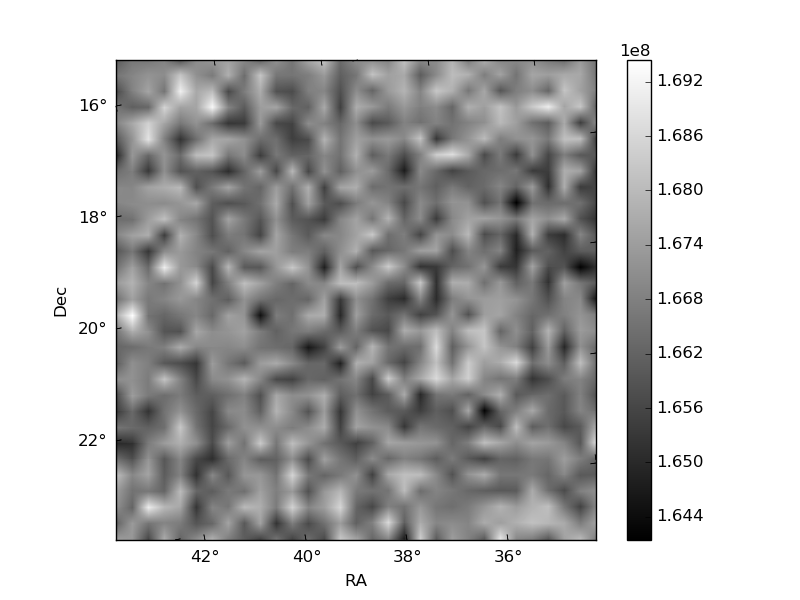
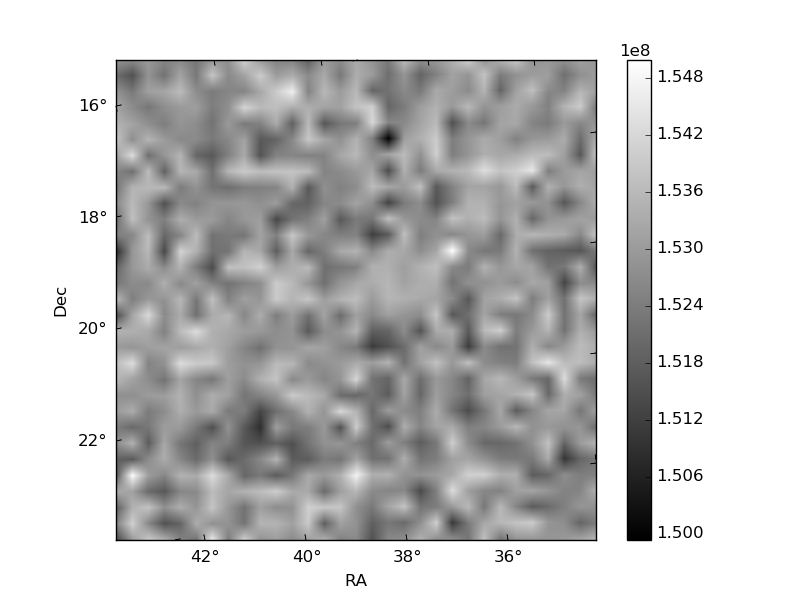
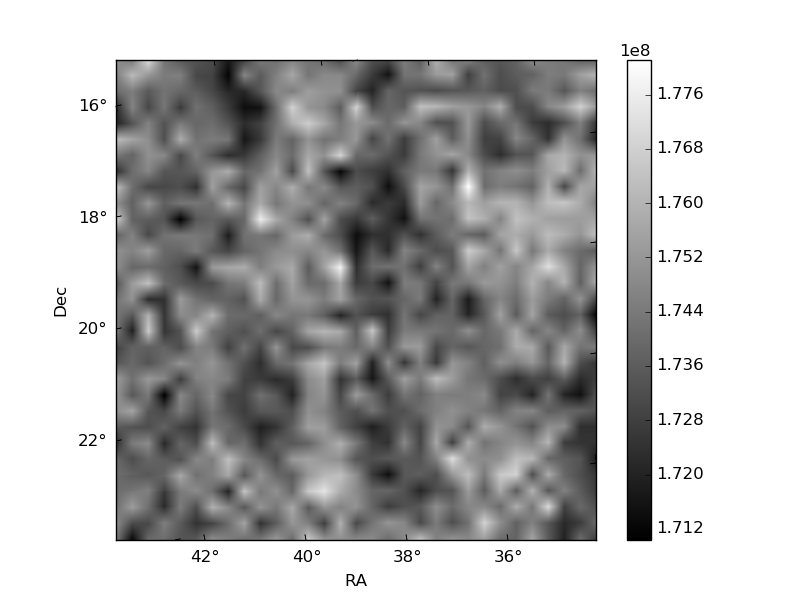
Histogram calculated using DETX and DETY for each event in the final _common_clean file
| Quadrant A | 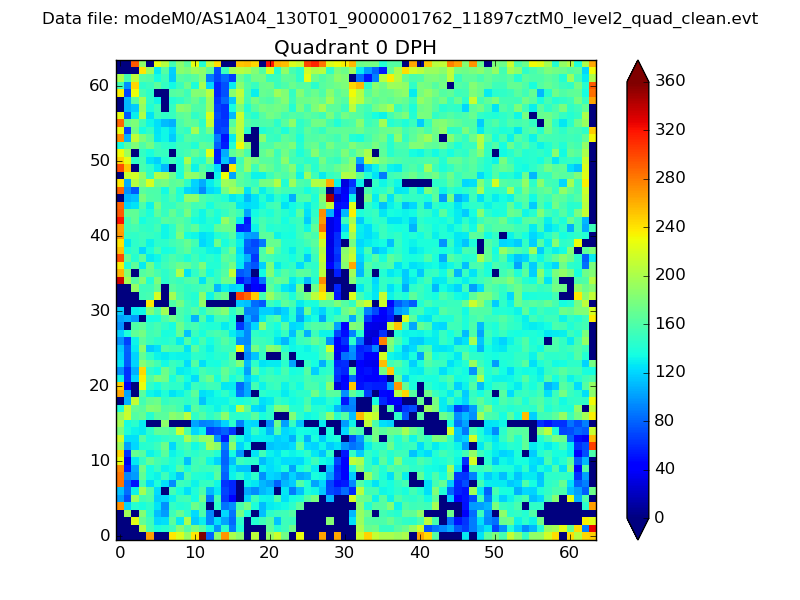 |
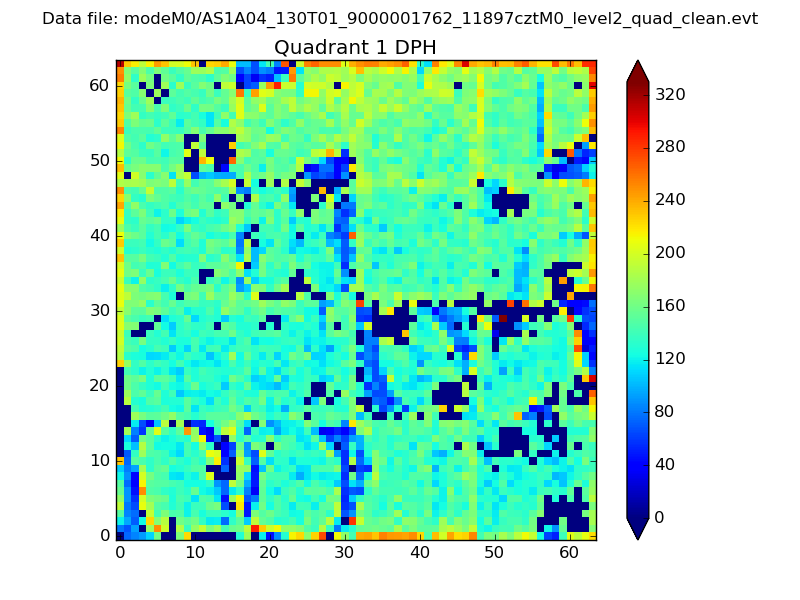 |
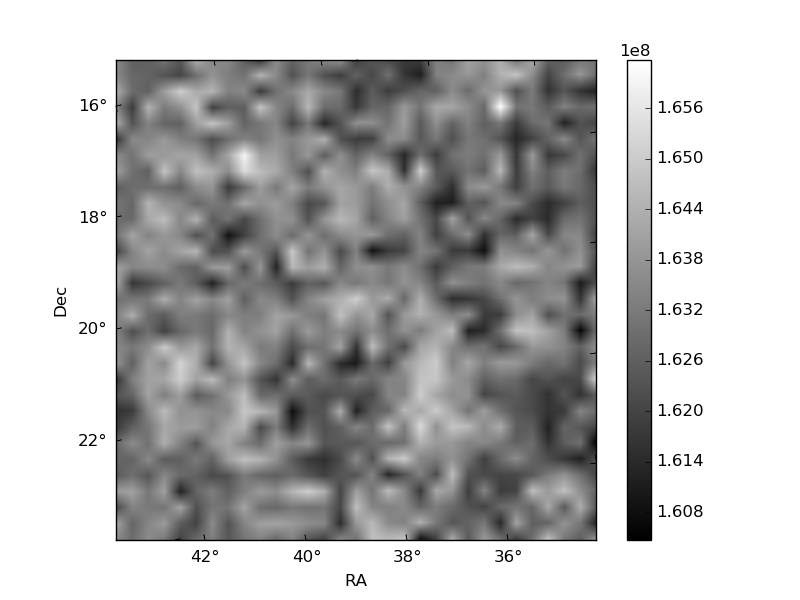
Quadrant B |
|---|---|---|---|
| Quadrant D | 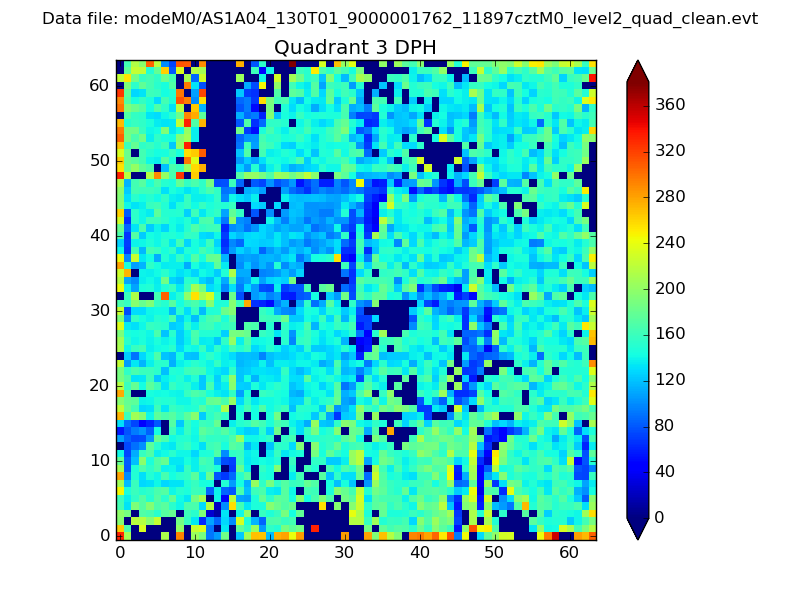 |
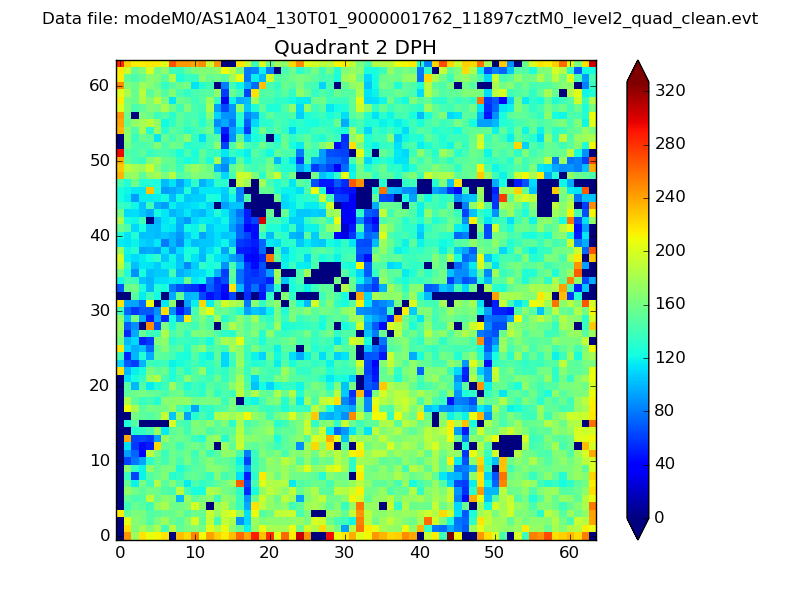 |
Quadrant C |
| Plot type | Count rate plots | Images |
|---|---|---|
| Comparison with Poisson distribution Blue bars denote a histogram of data divided into 1 sec bins. Red curve is a Poisson curve with rate = median count rate of data. |
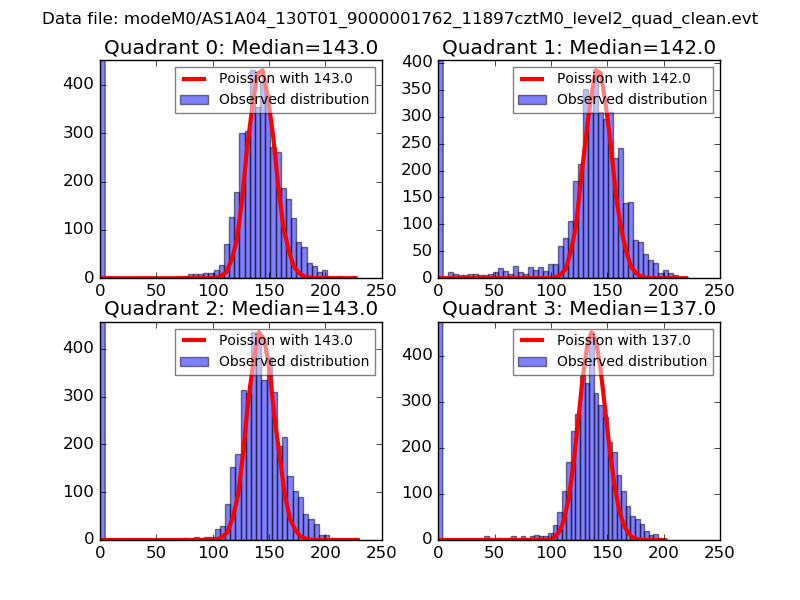 |
 |
| Quadrant-wise count rates Data is divided into 100 sec bins |
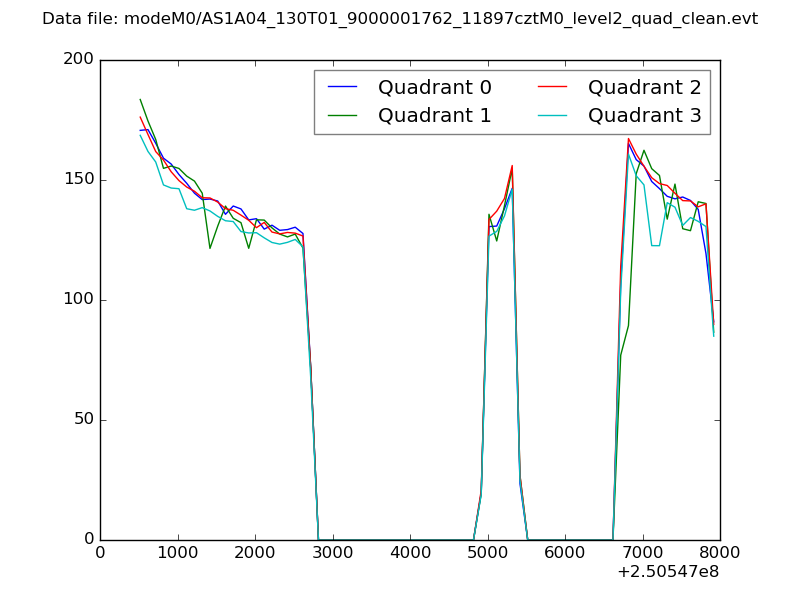 |
|
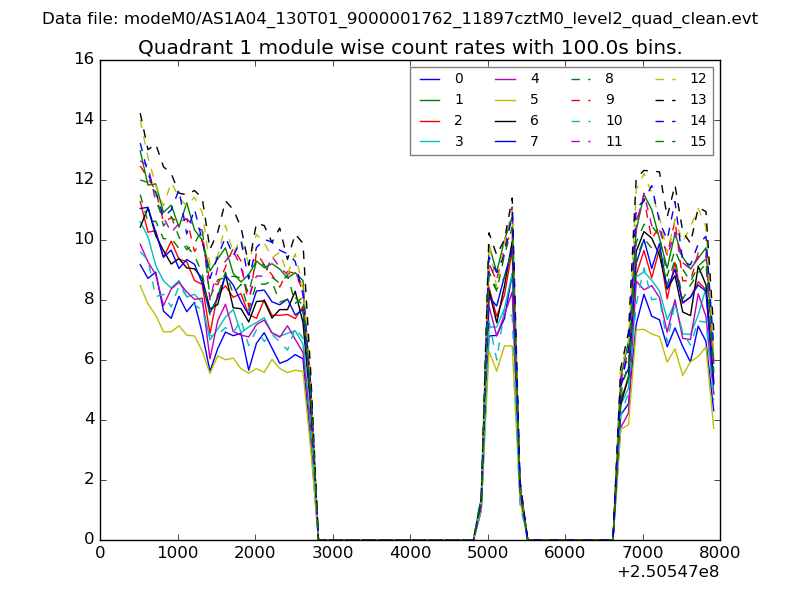
| Module-wise count rates for Quadrant A Data is divided into 100 sec bins |
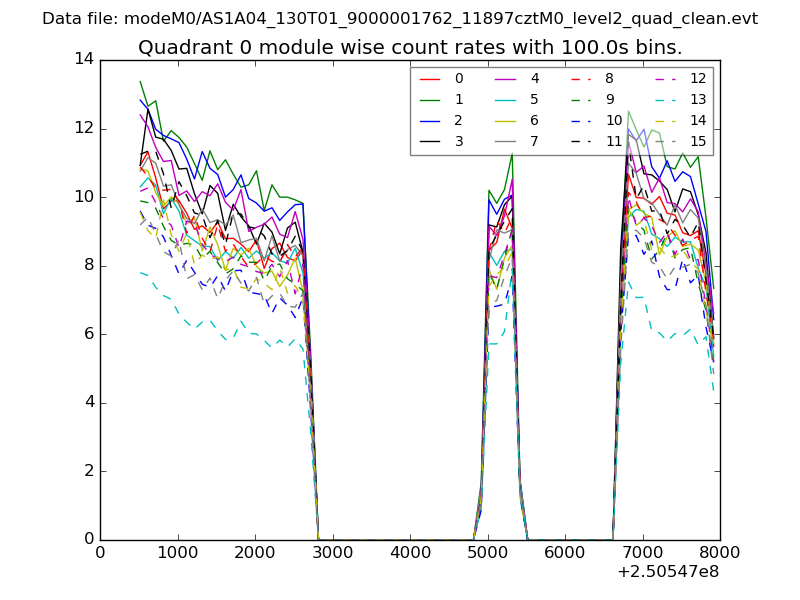 |
 |
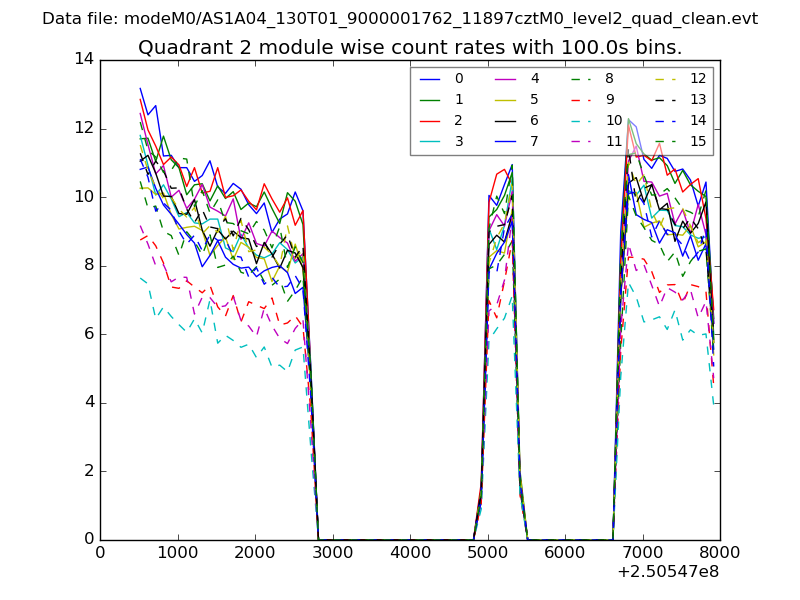
| Module-wise count rates for Quadrant B Data is divided into 100 sec bins |
 |
 |
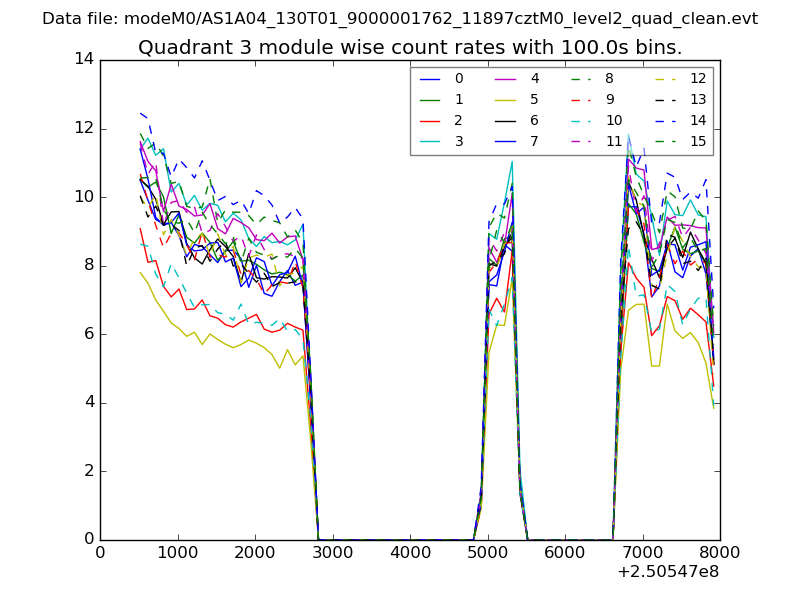
| Module-wise count rates for Quadrant C Data is divided into 100 sec bins |
 |
 |
| Module-wise count rates for Quadrant D Data is divided into 100 sec bins |
 |
 |
| Parameter | Plot |
|---|---|
| CZT HV Monitor | 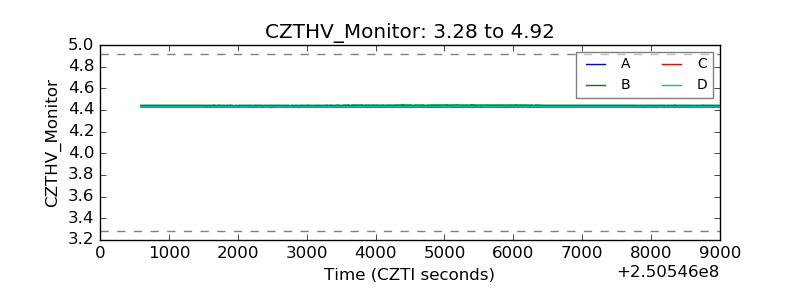 |
| D_VDD | 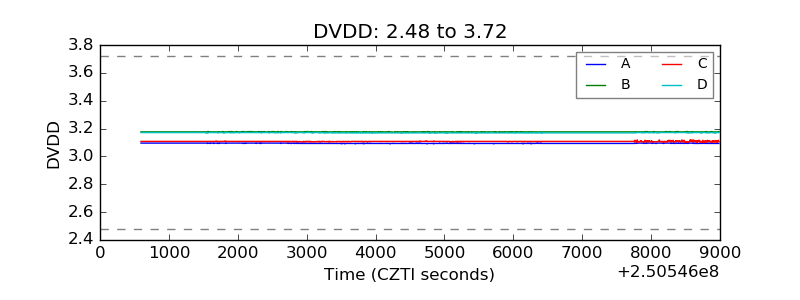 |
| Temperature 1 | 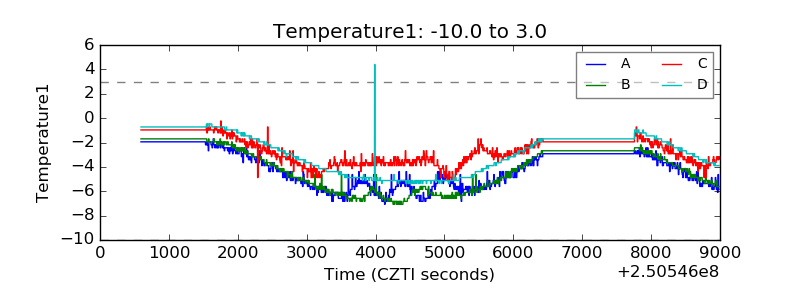 |
| Veto HV Monitor | 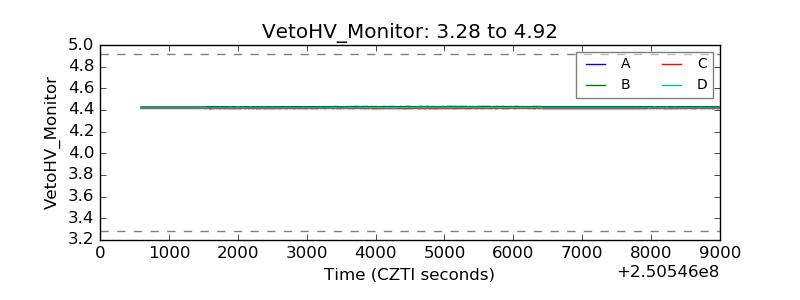 |
| Veto LLD | 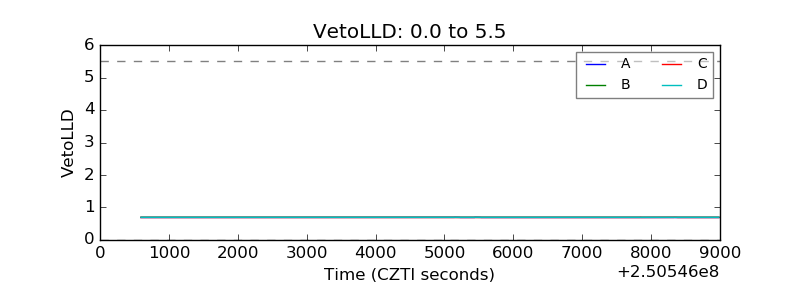 |
| Alpha Counter | 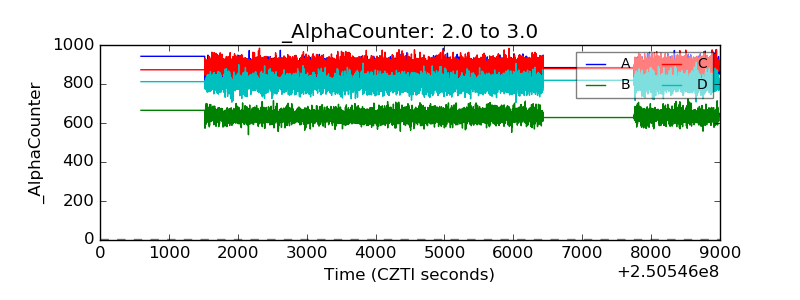 |
| _CPM_Rate | 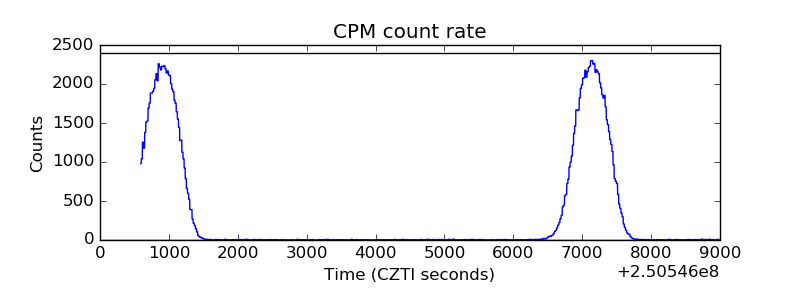 |
| CZT Counter | 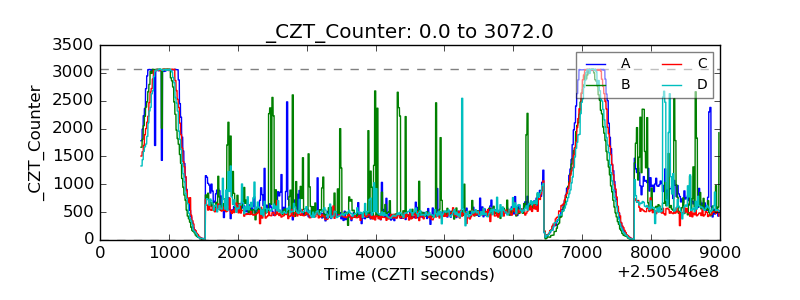 |
| +2.5 Volts monitor |  |
| +5 Volts monitor |  |
| _ROLL_ROT | 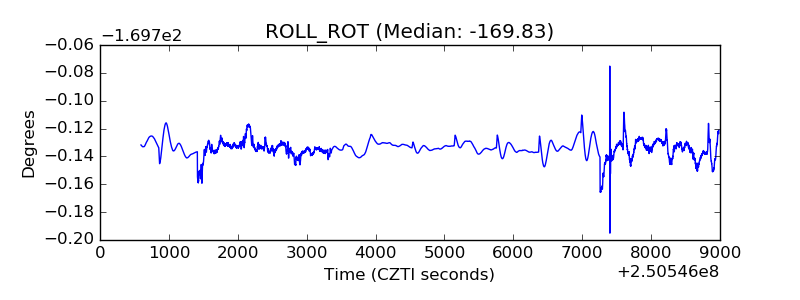 |
| _Roll_DEC | 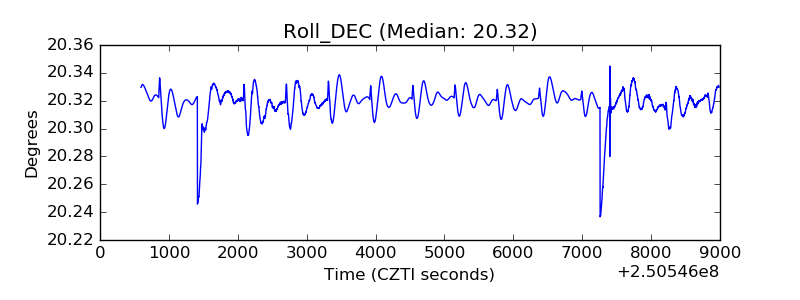 |
| _Roll_RA | 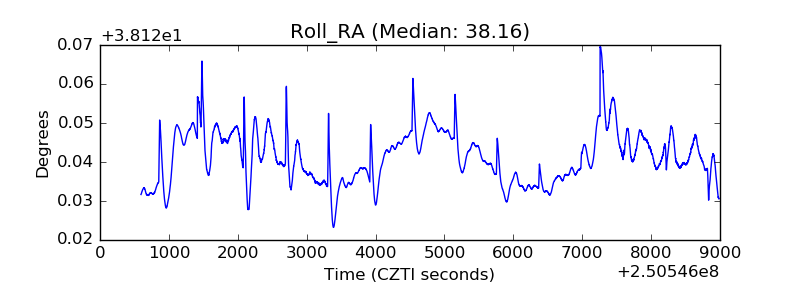 |
| Veto Counter | 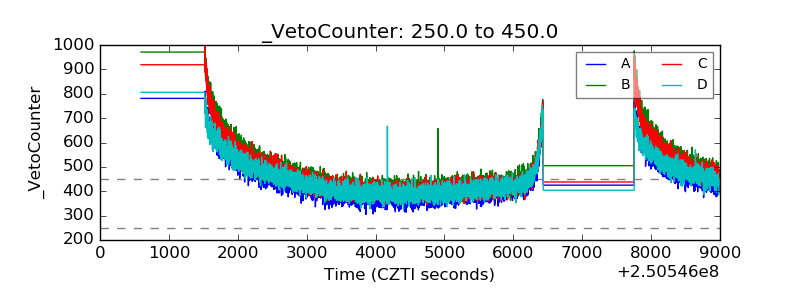 |