| Param | Original file | Final file |
|---|---|---|
| Filename | modeM0/AS1A04_130T01_9000001762_11898cztM0_level2.evt | modeM0/AS1A04_130T01_9000001762_11898cztM0_level2_quad_clean.evt |
| Size (bytes) | 508,521,600 | 85,861,440 |
| Size | 485.0 MB | 81.9 MB |
| Events in quadrant A | 3,935,398 | 550,567 |
| Events in quadrant B | 4,321,893 | 537,266 |
| Events in quadrant C | 2,927,892 | 557,430 |
| Events in quadrant D | 3,798,113 | 525,221 |
| Mode SS | |||
|---|---|---|---|
| Quadrant | BADHDUFLAG | Total packets | Discarded packets |
| A | 0 | 124 | 0 |
| B | 0 | 124 | 0 |
| C | 0 | 124 | 0 |
| D | 0 | 124 | 0 |
| Mode M0 | |||
|---|---|---|---|
| Quadrant | BADHDUFLAG | Total packets | Discarded packets |
| A | 0 | 15865 | 3 |
| B | 0 | 16736 | 2 |
| C | 0 | 12689 | 2 |
| D | 0 | 15072 | 2 |
| Mode M9 | |||
|---|---|---|---|
| Quadrant | BADHDUFLAG | Total packets | Discarded packets |
| A | 0 | 19 | 0 |
| B | 0 | 19 | 0 |
| C | 0 | 19 | 0 |
| D | 0 | 20 | 0 |
| Quadrant | Total seconds | Saturated seconds | Saturation percentage |
|---|---|---|---|
| A | 6154 | 146 | 2.372441% |
| B | 6154 | 482 | 7.832304% |
| C | 6154 | 19 | 0.308742% |
| D | 6154 | 104 | 1.689958% |
Noise dominated data is calculated using 1-second bins in cleaned event files. If a bin has >2000 counts, and if more than 50% of those come from <1% of pixels, then it is considered to be noise-dominated and hence unusable.
| Quadrant | # 1 sec bins | Bins with >0 counts | Bins with >2000 counts | High rate bins dominated by noise | Noise dominated (total time) | Noise dominated (detector-on time) | Marked lightcurve |
|---|---|---|---|---|---|---|---|
| A | 7485 | 6156 | 41 | 41 | 0.55% | 0.67% | 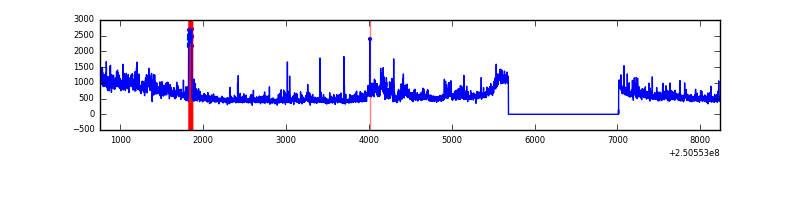 |
| B | 7485 | 6156 | 329 | 329 | 4.40% | 5.34% | 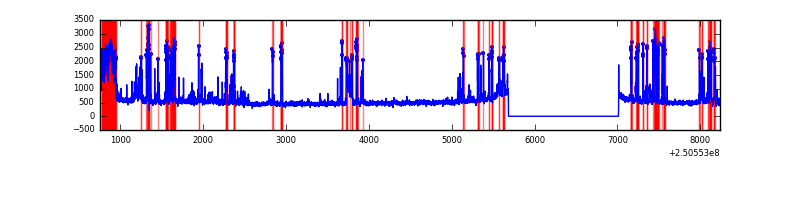 |
| C | 7485 | 6156 | 0 | 0 | 0.00% | 0.00% | 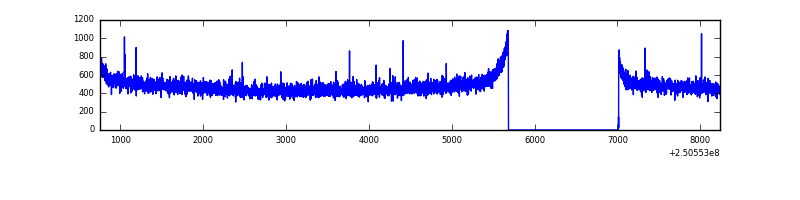 |
| D | 7485 | 6156 | 87 | 87 | 1.16% | 1.41% | 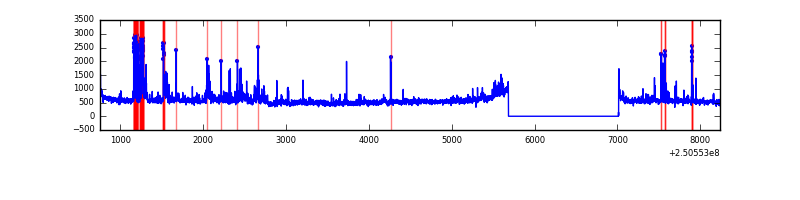 |
Top three noisy pixels from each quadrant. If the there are fewer than three noisy pixels in the level2.evt file, extra rows are filled as -1
| Pixel properties | Quadrant properties | ||||||
|---|---|---|---|---|---|---|---|
| Quadrant | DetID | PixID | Counts | Sigma | Mean | Median | Sigma |
| A | 14 | 63 | 707231 | 4612.37 | 757 | 742 | 153.2 |
| A | 1 | 162 | 117923 | 765.03 | 757 | 742 | 153.2 |
| A | 1 | 178 | 59403 | 382.97 | 757 | 742 | 153.2 |
| B | 4 | 239 | 1201409 | 8546.18 | 743 | 727 | 140.5 |
| B | 15 | 204 | 72383 | 510.03 | 743 | 727 | 140.5 |
| B | 3 | 64 | 41699 | 291.63 | 743 | 727 | 140.5 |
| C | 8 | 128 | 7402 | 38.58 | 746 | 753 | 172.3 |
| C | 13 | 61 | 5338 | 26.61 | 746 | 753 | 172.3 |
| C | 8 | 112 | 4280 | 20.47 | 746 | 753 | 172.3 |
| D | 8 | 195 | 521296 | 2663.54 | 728 | 715 | 195.4 |
| D | 12 | 233 | 181104 | 922.96 | 728 | 715 | 195.4 |
| D | 5 | 222 | 83135 | 421.7 | 728 | 715 | 195.4 |
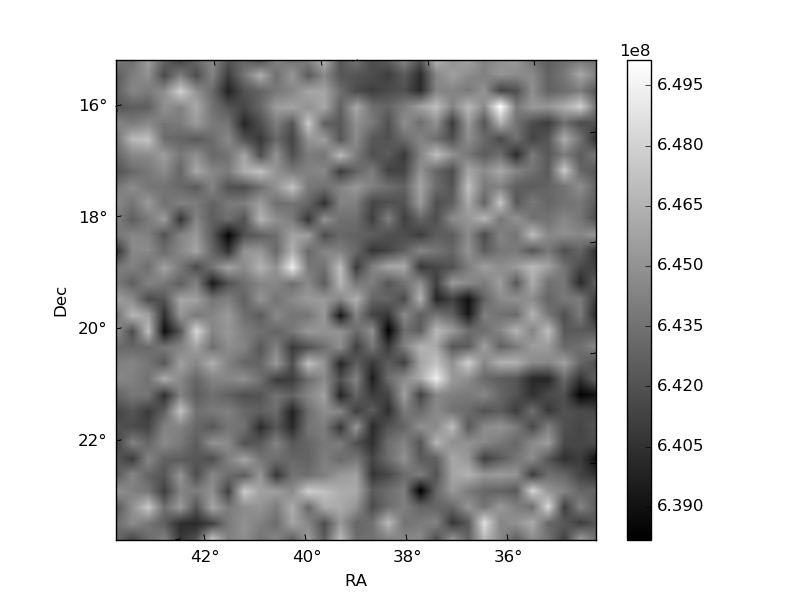
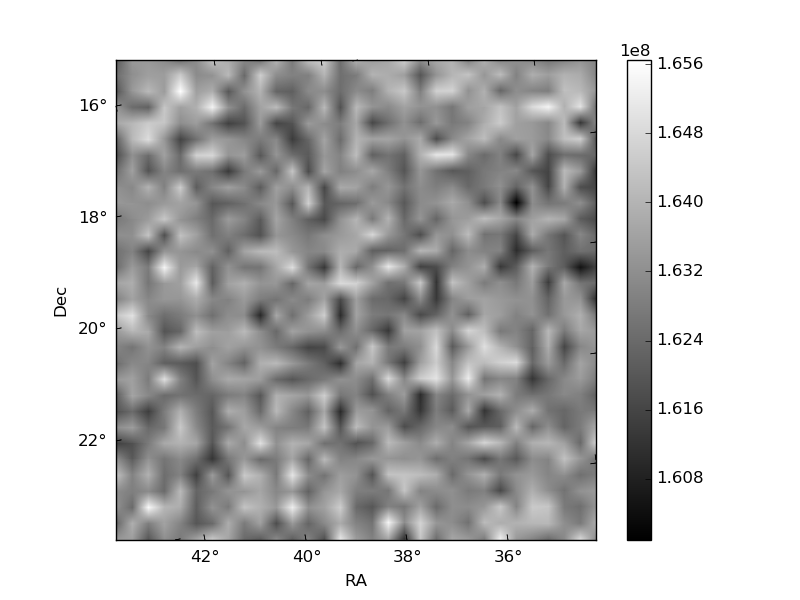
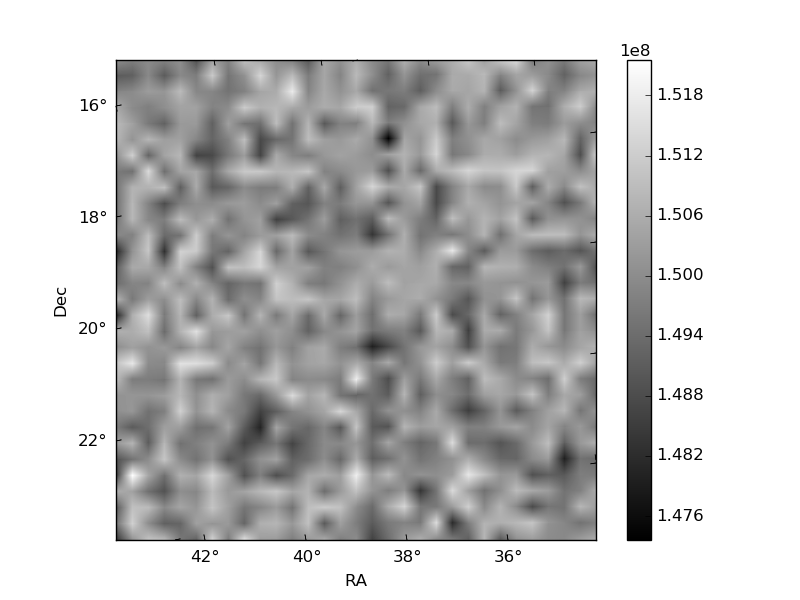
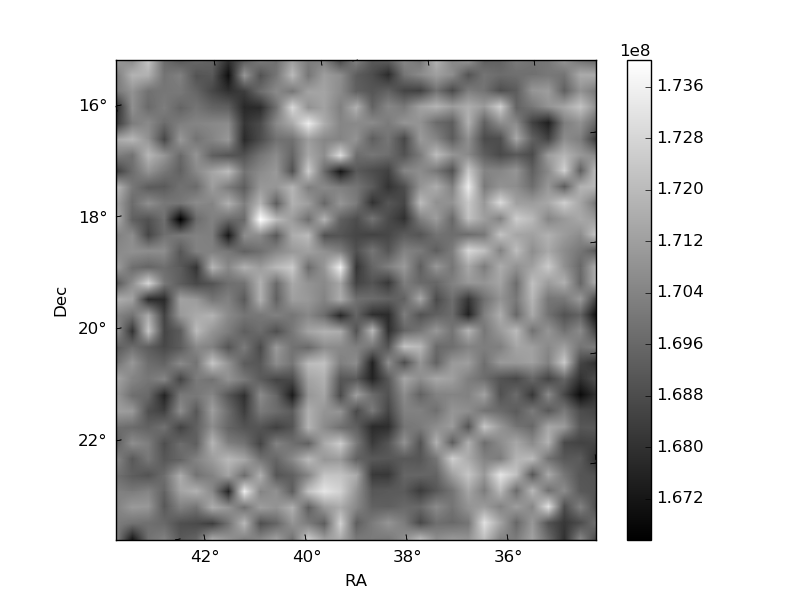
Histogram calculated using DETX and DETY for each event in the final _common_clean file
| Quadrant A | 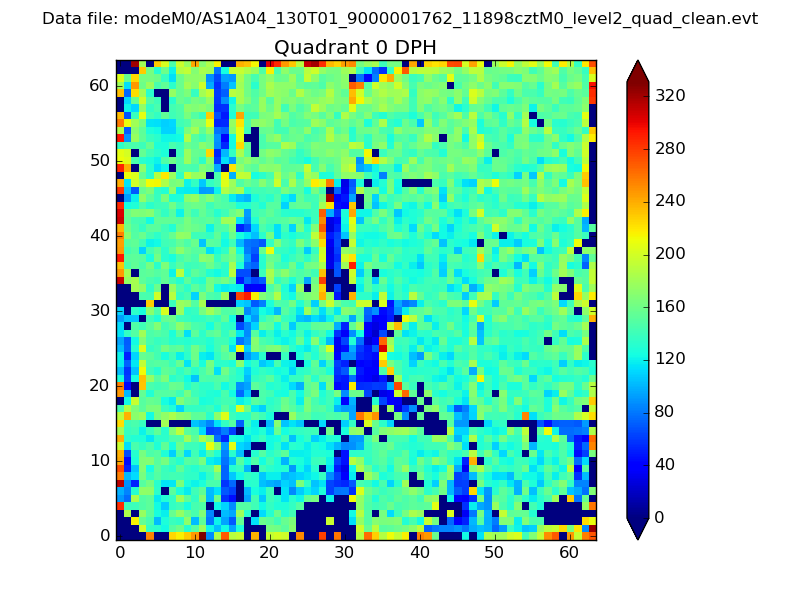 |
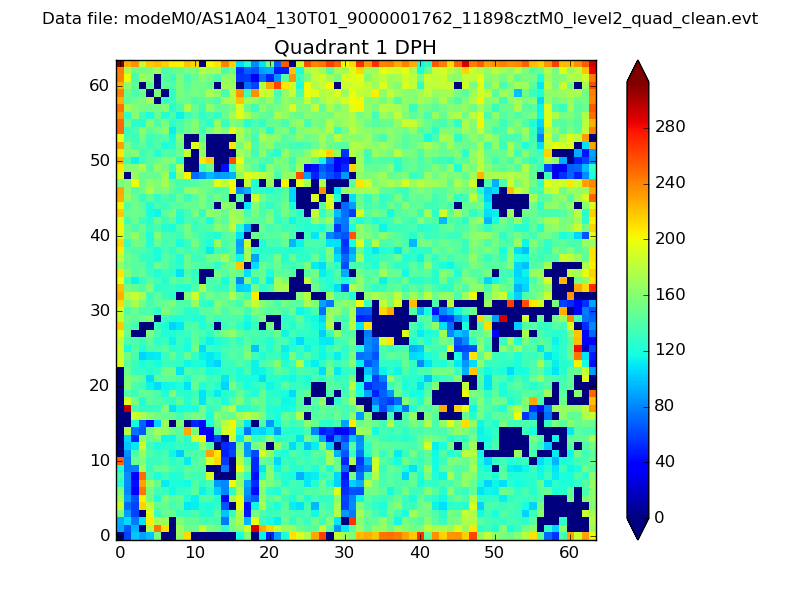 |
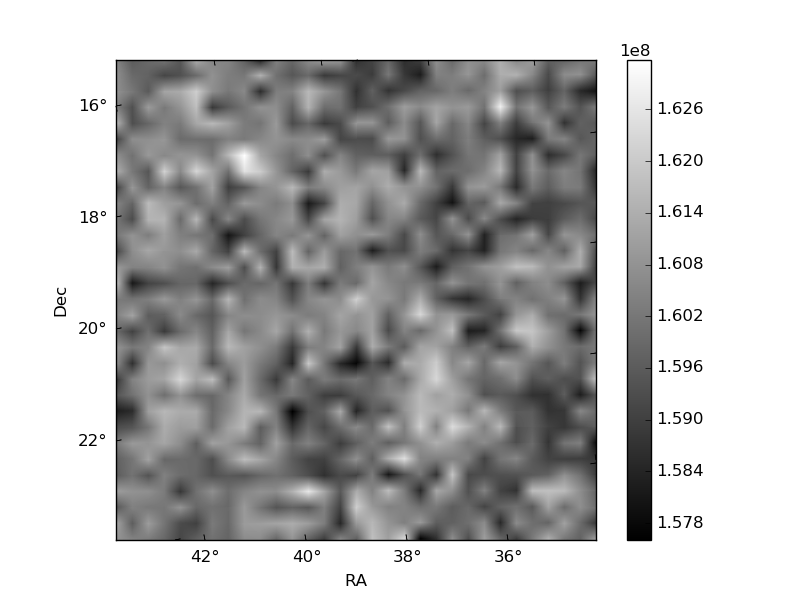
Quadrant B |
|---|---|---|---|
| Quadrant D | 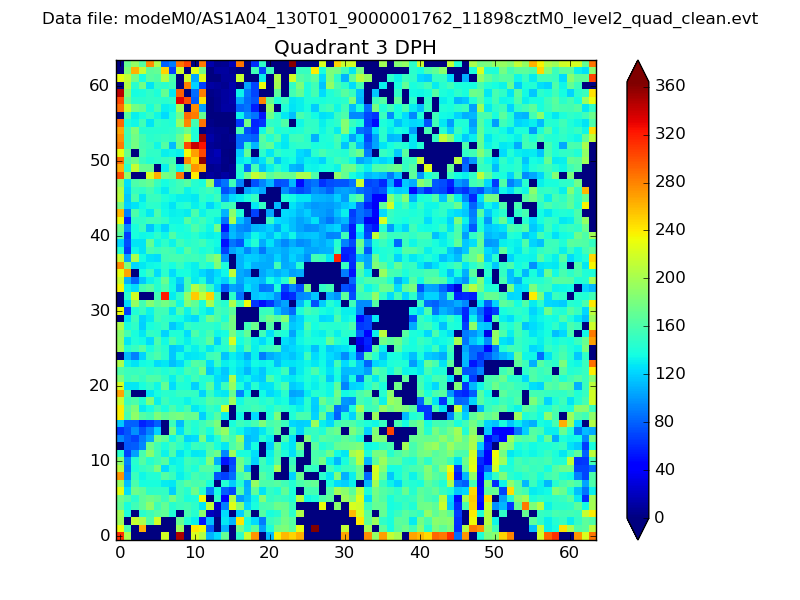 |
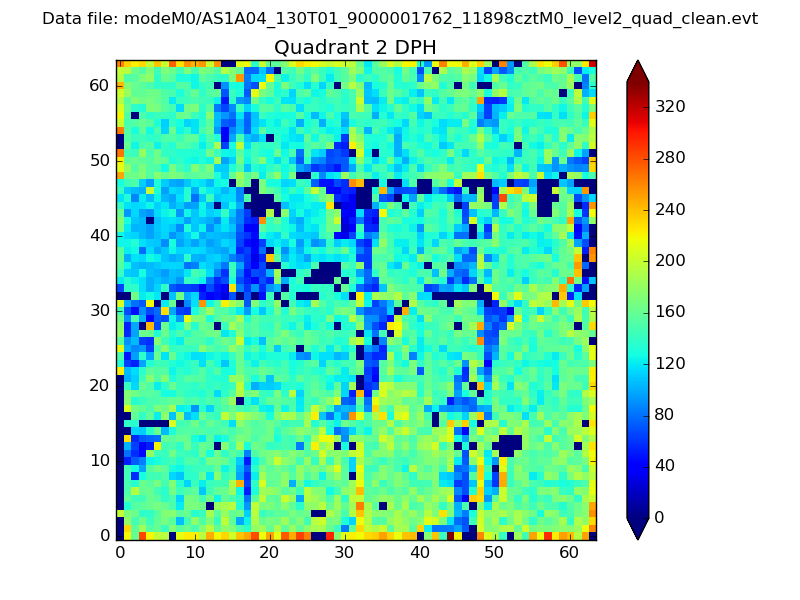 |
Quadrant C |
| Plot type | Count rate plots | Images |
|---|---|---|
| Comparison with Poisson distribution Blue bars denote a histogram of data divided into 1 sec bins. Red curve is a Poisson curve with rate = median count rate of data. |
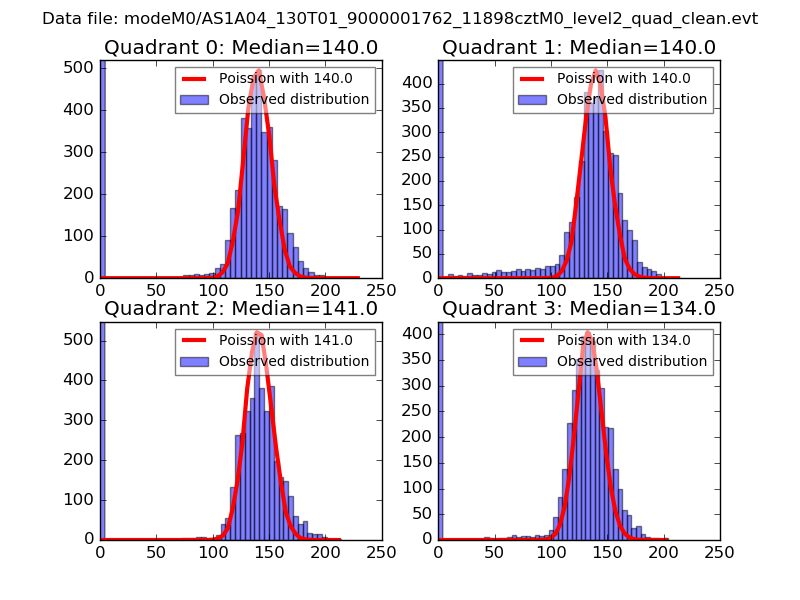 |
 |
| Quadrant-wise count rates Data is divided into 100 sec bins |
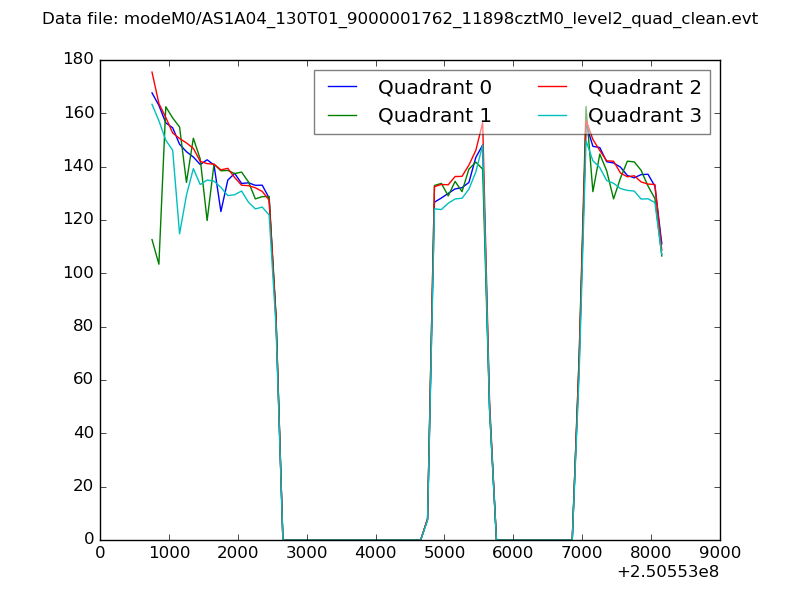 |
|
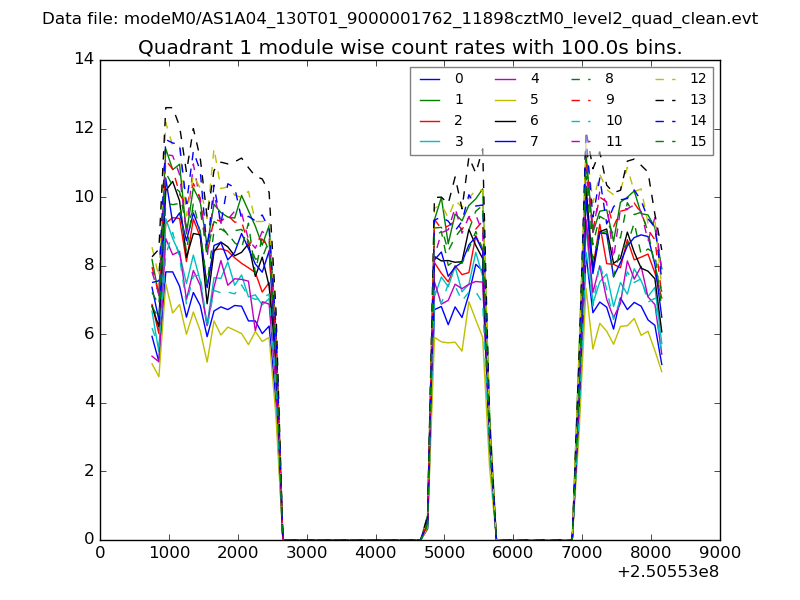
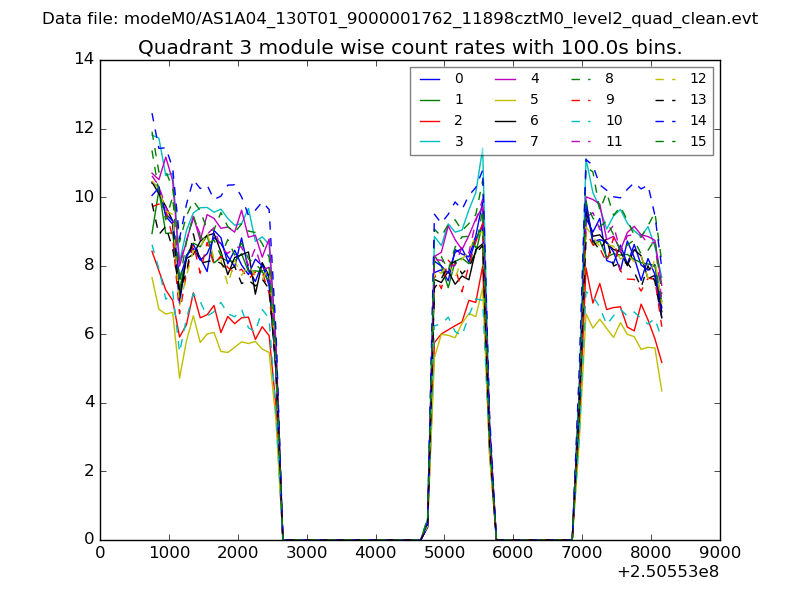
| Module-wise count rates for Quadrant A Data is divided into 100 sec bins |
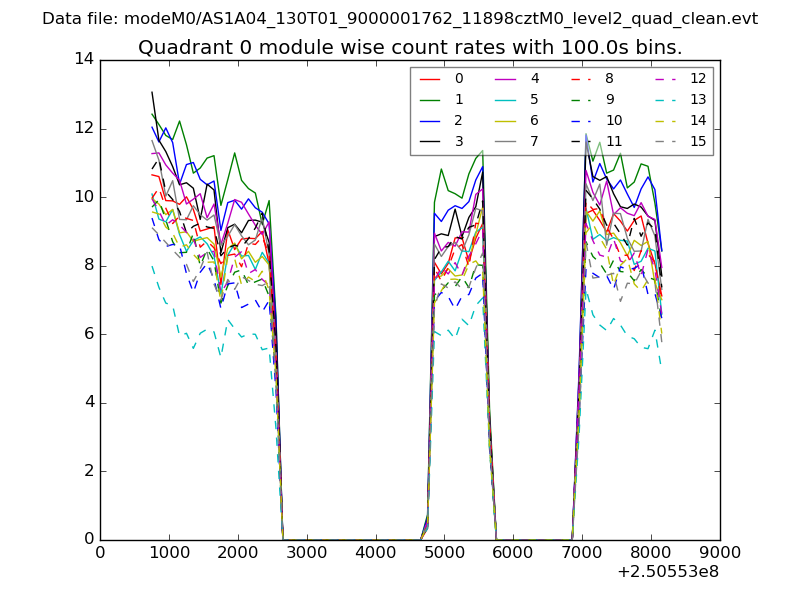 |
 |
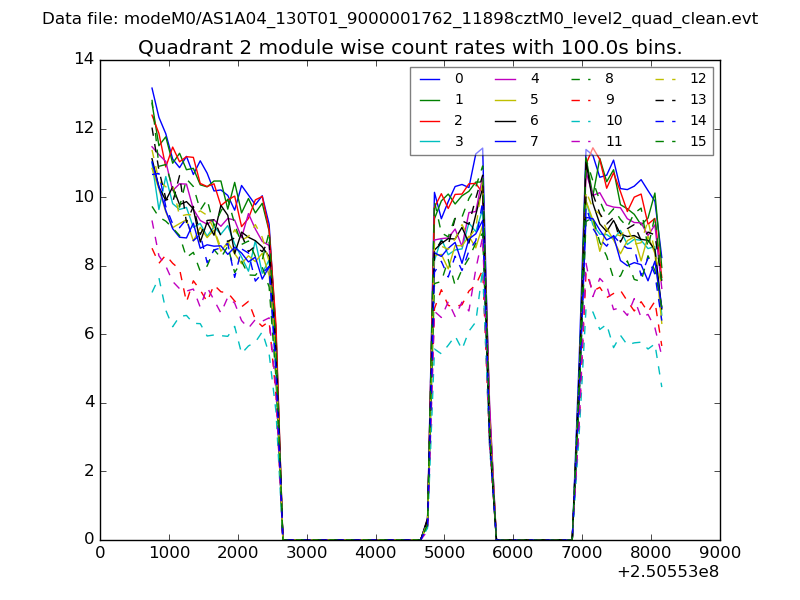
| Module-wise count rates for Quadrant B Data is divided into 100 sec bins |
 |
 |
| Module-wise count rates for Quadrant C Data is divided into 100 sec bins |
 |
 |
| Module-wise count rates for Quadrant D Data is divided into 100 sec bins |
 |
 |
| Parameter | Plot |
|---|---|
| CZT HV Monitor | 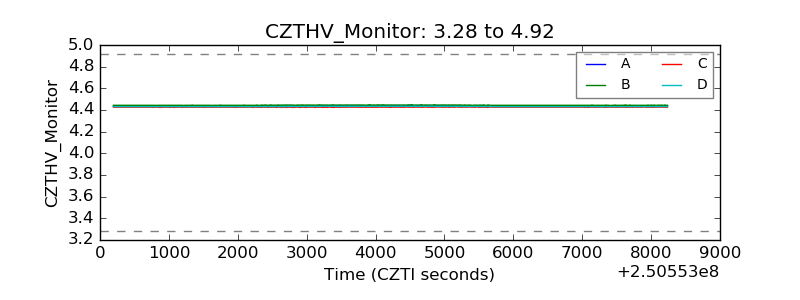 |
| D_VDD | 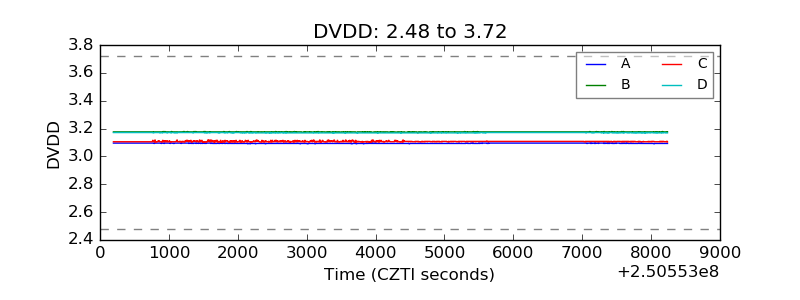 |
| Temperature 1 | 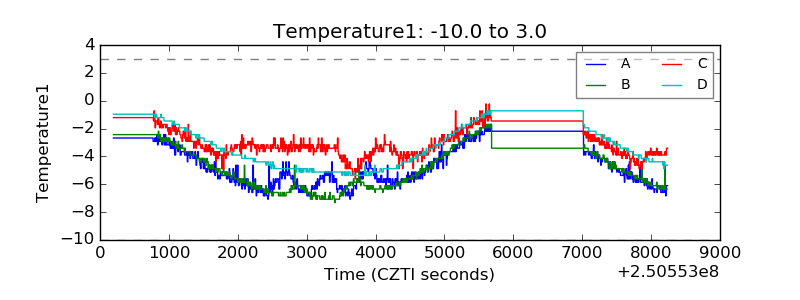 |
| Veto HV Monitor | 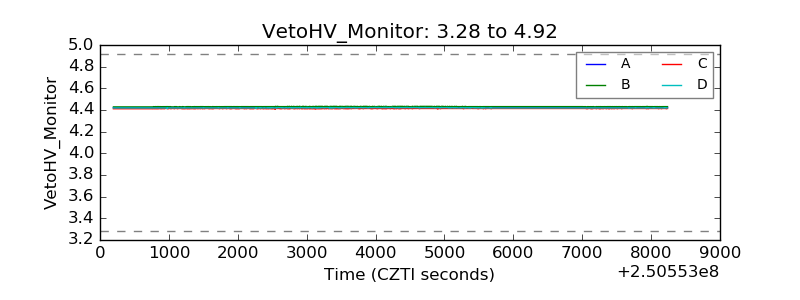 |
| Veto LLD | 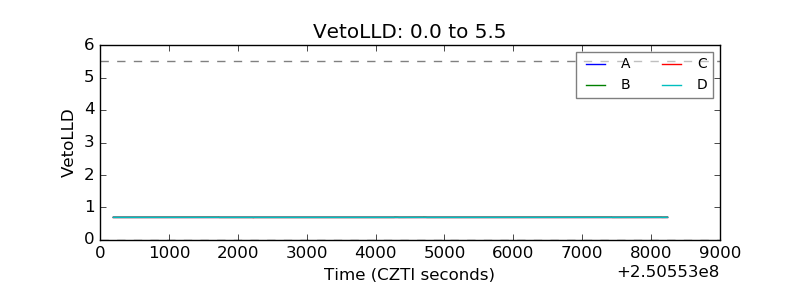 |
| Alpha Counter | 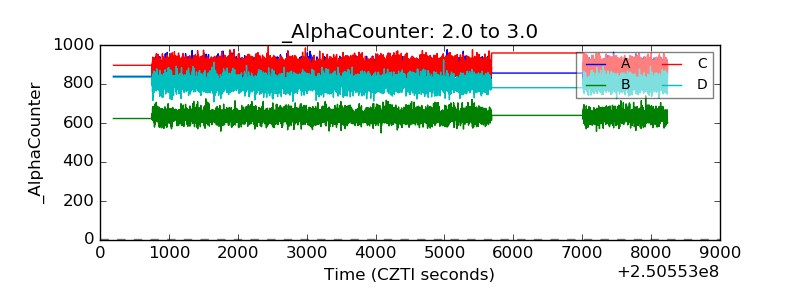 |
| _CPM_Rate | 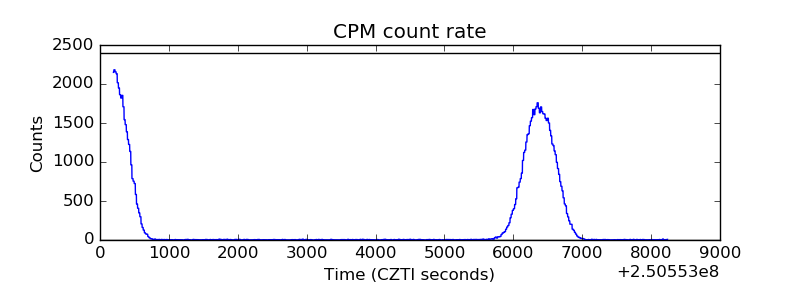 |
| CZT Counter | 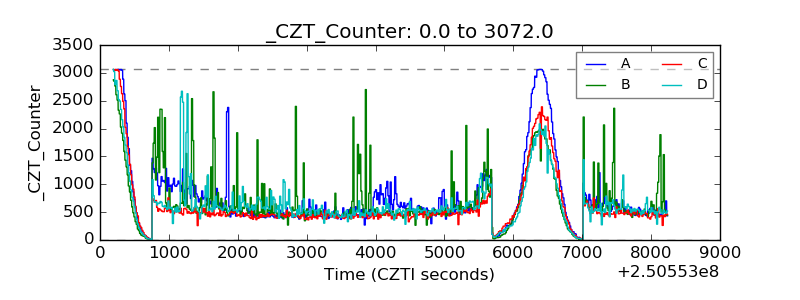 |
| +2.5 Volts monitor |  |
| +5 Volts monitor |  |
| _ROLL_ROT | 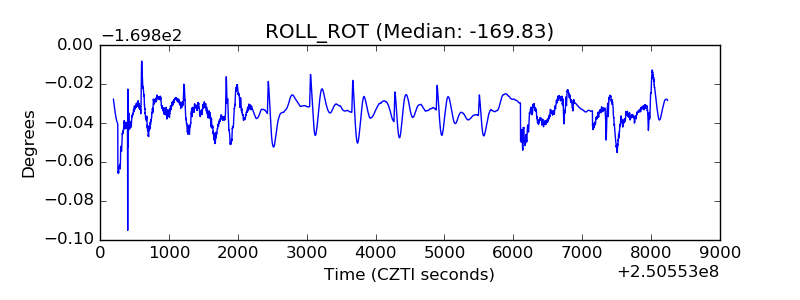 |
| _Roll_DEC | 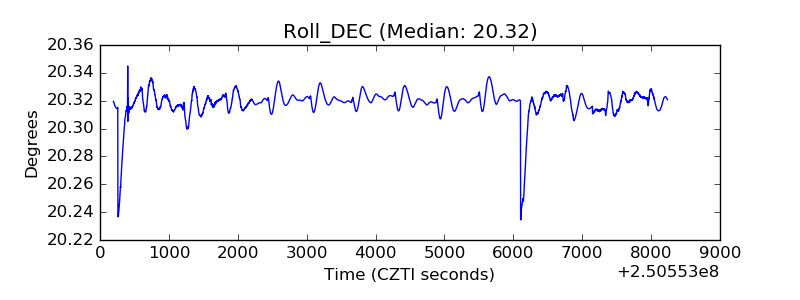 |
| _Roll_RA | 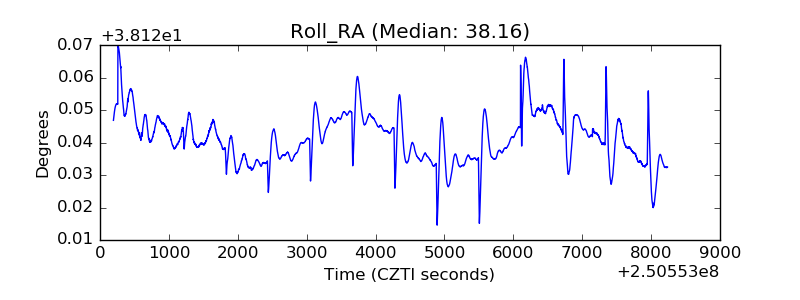 |
| Veto Counter | 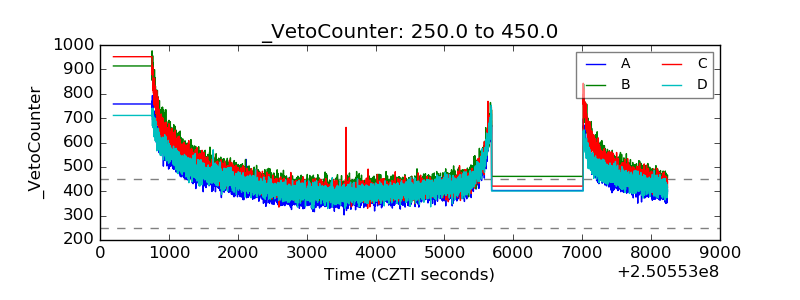 |