| Param | Original file | Final file |
|---|---|---|
| Filename | modeM0/AS1A04_130T01_9000001762_11901cztM0_level2.evt | modeM0/AS1A04_130T01_9000001762_11901cztM0_level2_quad_clean.evt |
| Size (bytes) | 617,872,320 | 94,884,480 |
| Size | 589.2 MB | 90.5 MB |
| Events in quadrant A | 4,534,217 | 582,492 |
| Events in quadrant B | 4,777,015 | 570,186 |
| Events in quadrant C | 3,743,289 | 593,017 |
| Events in quadrant D | 5,105,732 | 561,407 |
| Mode SS | |||
|---|---|---|---|
| Quadrant | BADHDUFLAG | Total packets | Discarded packets |
| A | 0 | 168 | 0 |
| B | 0 | 168 | 0 |
| C | 0 | 168 | 0 |
| D | 0 | 168 | 0 |
| Mode M0 | |||
|---|---|---|---|
| Quadrant | BADHDUFLAG | Total packets | Discarded packets |
| A | 0 | 18762 | 3 |
| B | 0 | 19497 | 2 |
| C | 0 | 16766 | 2 |
| D | 0 | 20510 | 2 |
| Mode M9 | |||
|---|---|---|---|
| Quadrant | BADHDUFLAG | Total packets | Discarded packets |
| A | 0 | 14 | 0 |
| B | 0 | 14 | 0 |
| C | 0 | 14 | 0 |
| D | 0 | 14 | 0 |
| Quadrant | Total seconds | Saturated seconds | Saturation percentage |
|---|---|---|---|
| A | 8142 | 132 | 1.621223% |
| B | 8142 | 314 | 3.856546% |
| C | 8142 | 44 | 0.540408% |
| D | 8142 | 161 | 1.977401% |
Noise dominated data is calculated using 1-second bins in cleaned event files. If a bin has >2000 counts, and if more than 50% of those come from <1% of pixels, then it is considered to be noise-dominated and hence unusable.
| Quadrant | # 1 sec bins | Bins with >0 counts | Bins with >2000 counts | High rate bins dominated by noise | Noise dominated (total time) | Noise dominated (detector-on time) | Marked lightcurve |
|---|---|---|---|---|---|---|---|
| A | 9598 | 8145 | 2 | 2 | 0.02% | 0.02% | 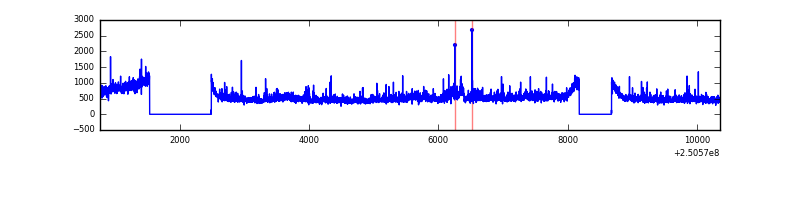 |
| B | 9598 | 8145 | 130 | 130 | 1.35% | 1.60% | 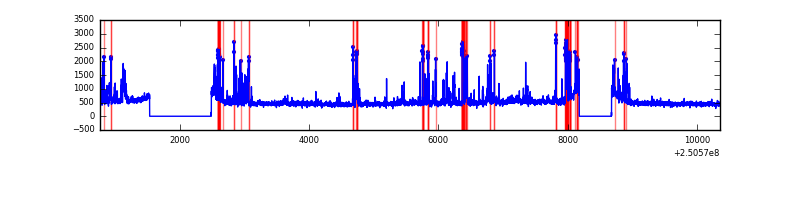 |
| C | 9598 | 8145 | 0 | 0 | 0.00% | 0.00% | 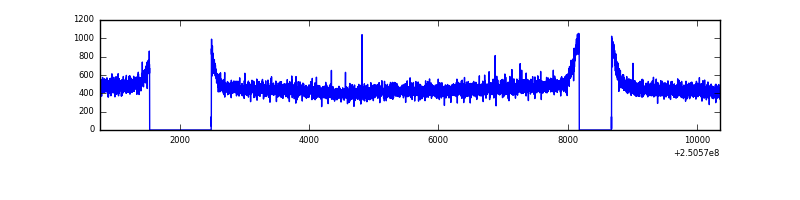 |
| D | 9598 | 8145 | 51 | 51 | 0.53% | 0.63% | 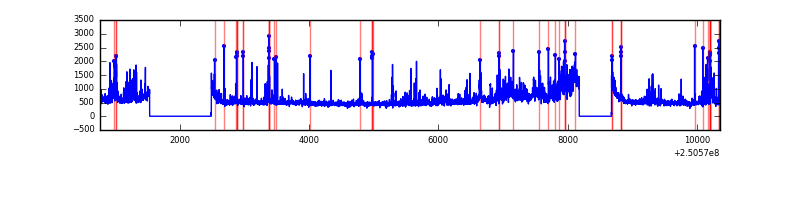 |
Top three noisy pixels from each quadrant. If the there are fewer than three noisy pixels in the level2.evt file, extra rows are filled as -1
| Pixel properties | Quadrant properties | ||||||
|---|---|---|---|---|---|---|---|
| Quadrant | DetID | PixID | Counts | Sigma | Mean | Median | Sigma |
| A | 14 | 63 | 398538 | 1996.54 | 977 | 954 | 199.1 |
| A | 8 | 15 | 108546 | 540.29 | 977 | 954 | 199.1 |
| A | 1 | 162 | 104299 | 518.96 | 977 | 954 | 199.1 |
| B | 4 | 239 | 780198 | 4164.29 | 967 | 941 | 187.1 |
| B | 15 | 204 | 70564 | 372.06 | 967 | 941 | 187.1 |
| B | 0 | 214 | 38986 | 203.31 | 967 | 941 | 187.1 |
| C | 13 | 61 | 6956 | 26.72 | 959 | 966 | 224.2 |
| C | 4 | 175 | 2897 | 8.61 | 959 | 966 | 224.2 |
| C | 3 | 202 | 2437 | 6.56 | 959 | 966 | 224.2 |
| D | 1 | 52 | 559936 | 2217.37 | 938 | 919 | 252.1 |
| D | 8 | 195 | 541031 | 2142.38 | 938 | 919 | 252.1 |
| D | 12 | 2 | 116448 | 458.25 | 938 | 919 | 252.1 |
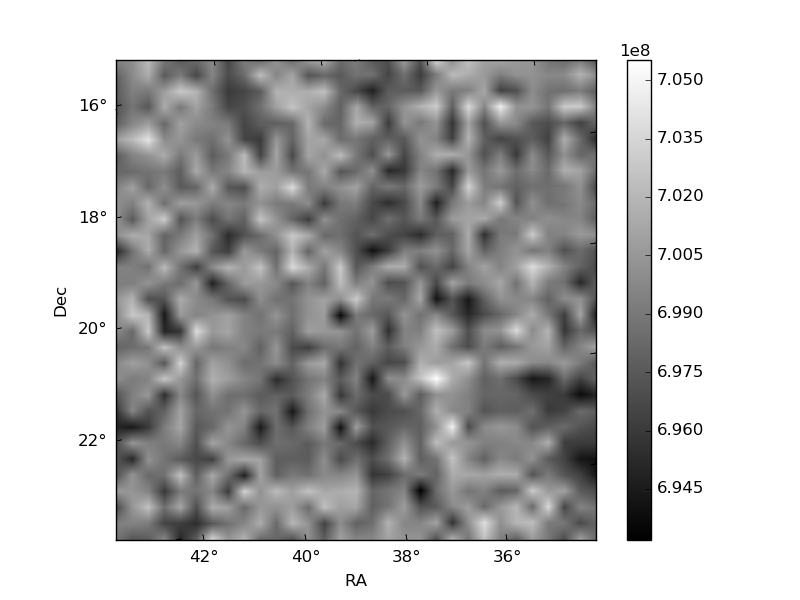
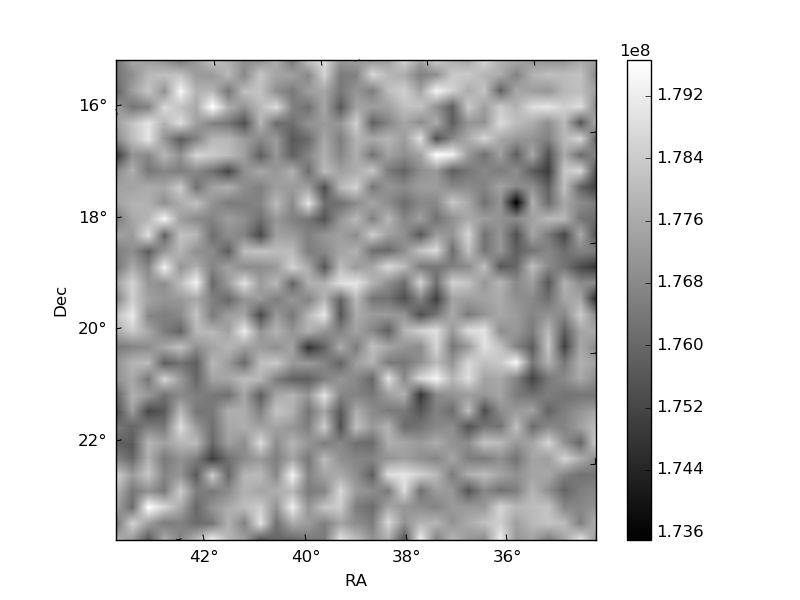
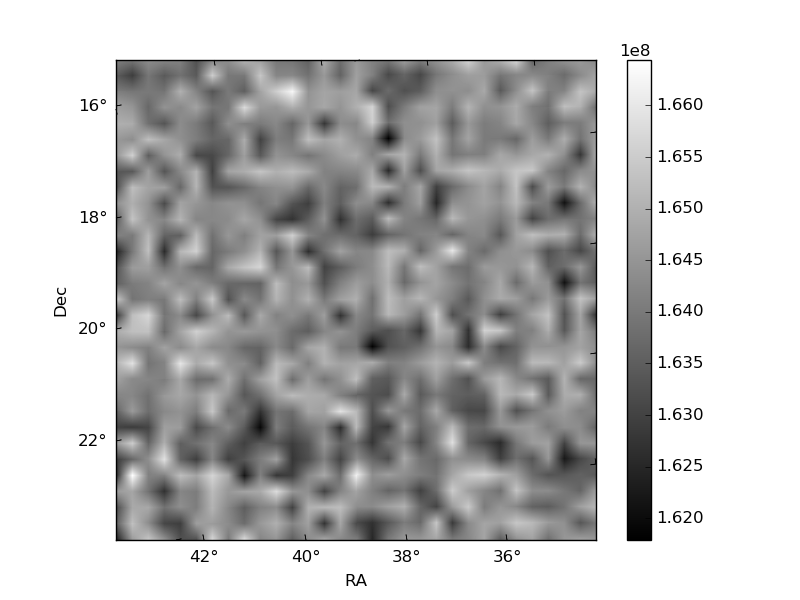
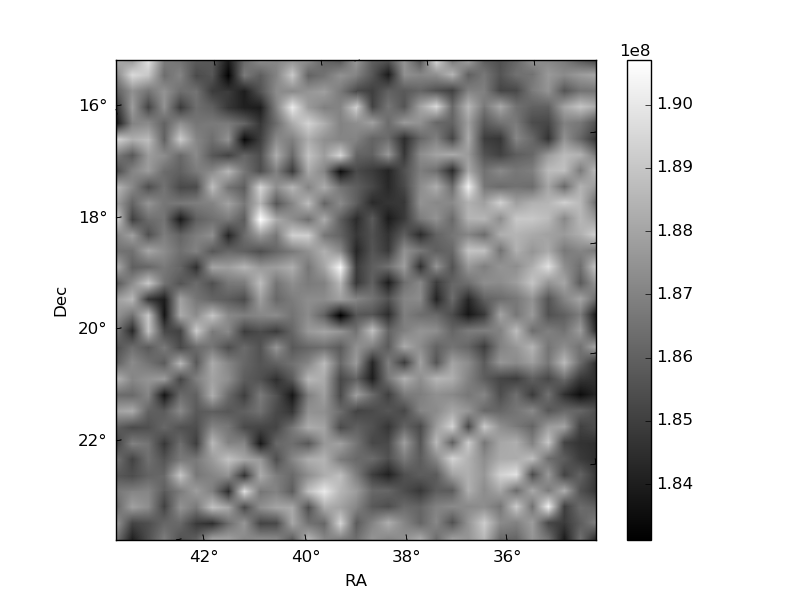
Histogram calculated using DETX and DETY for each event in the final _common_clean file
| Quadrant A | 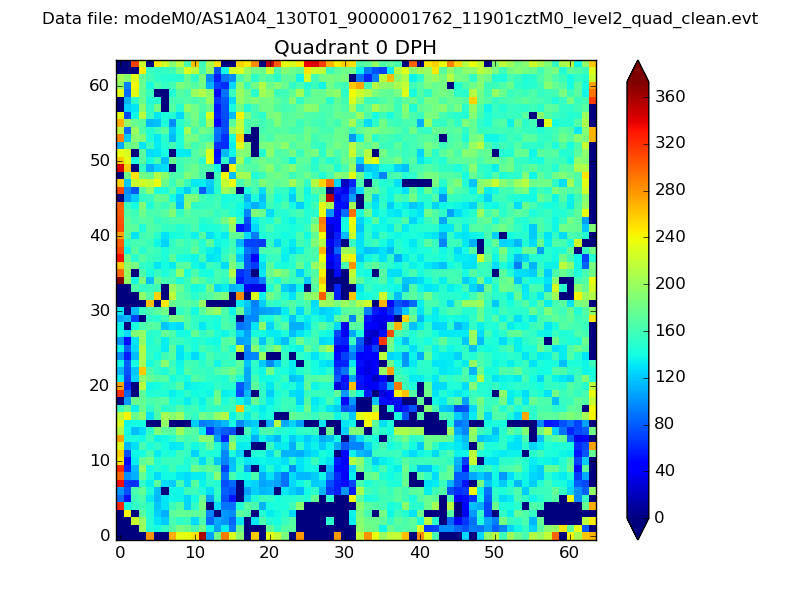 |
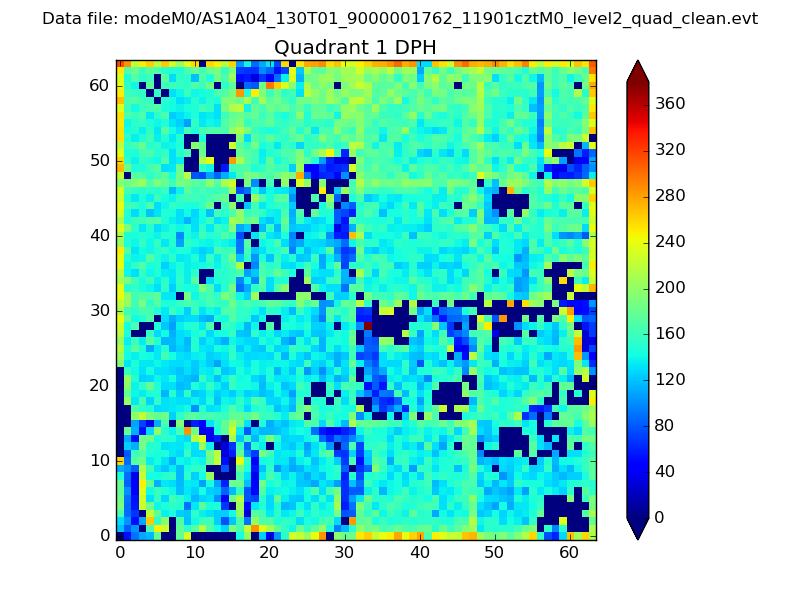 |
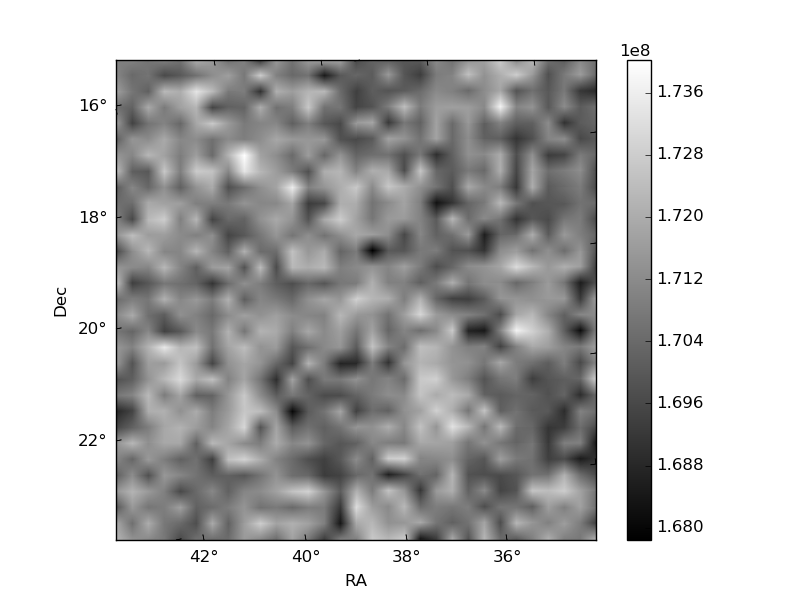
Quadrant B |
|---|---|---|---|
| Quadrant D | 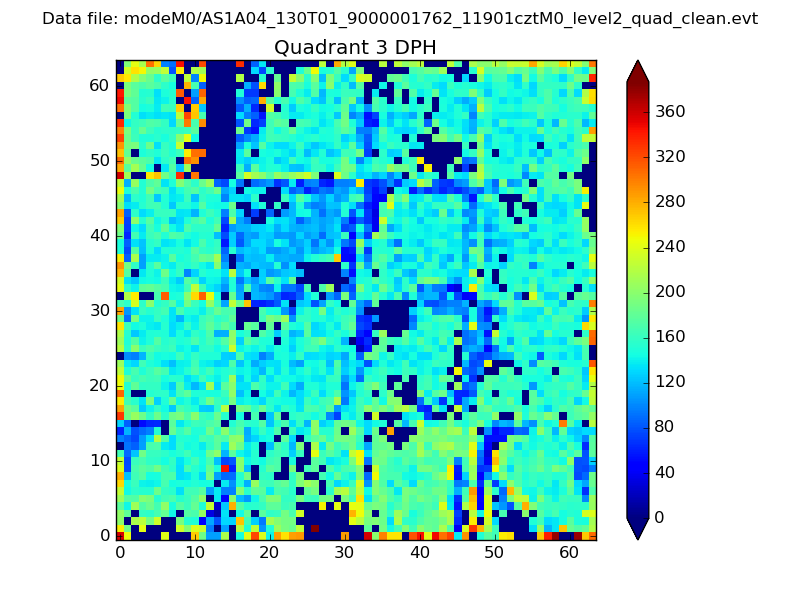 |
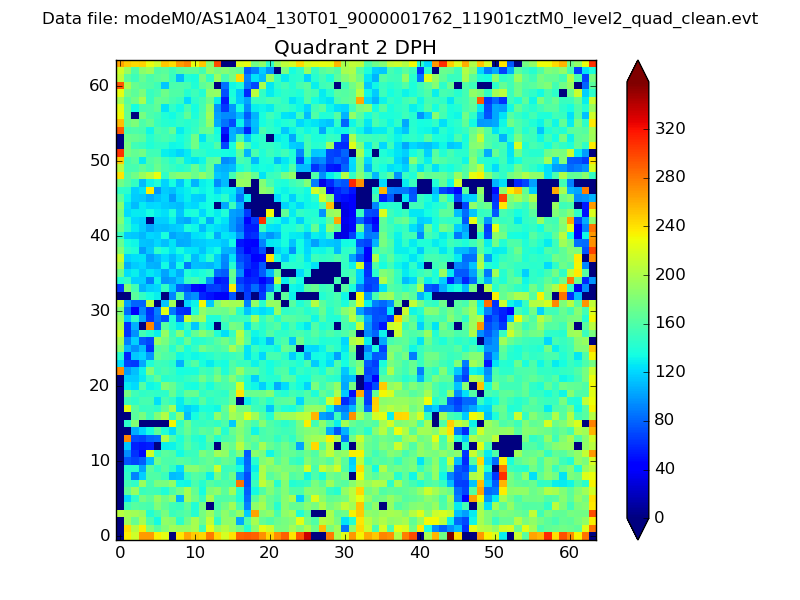 |
Quadrant C |
| Plot type | Count rate plots | Images |
|---|---|---|
| Comparison with Poisson distribution Blue bars denote a histogram of data divided into 1 sec bins. Red curve is a Poisson curve with rate = median count rate of data. |
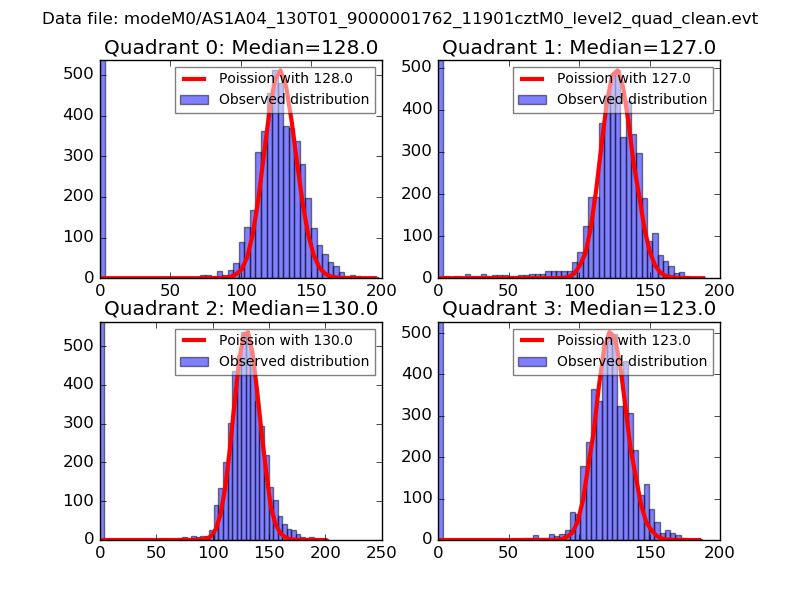 |
 |
| Quadrant-wise count rates Data is divided into 100 sec bins |
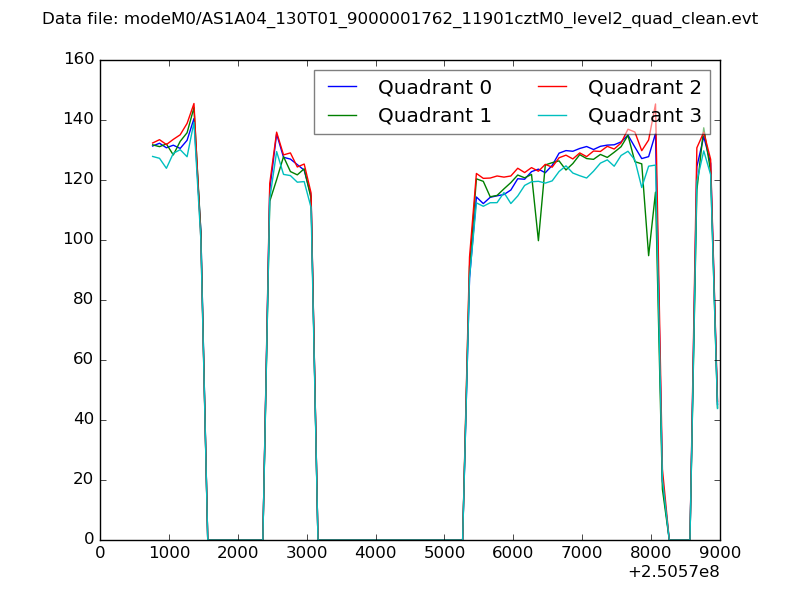 |
|
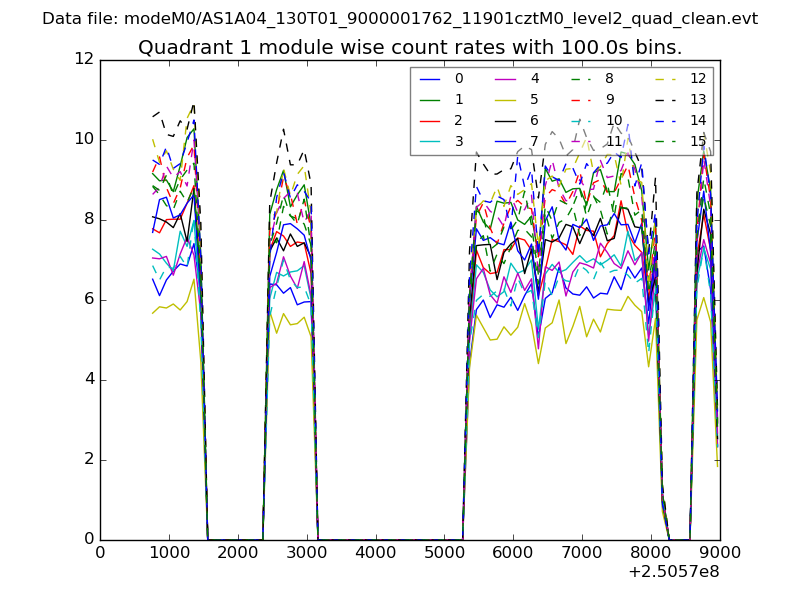
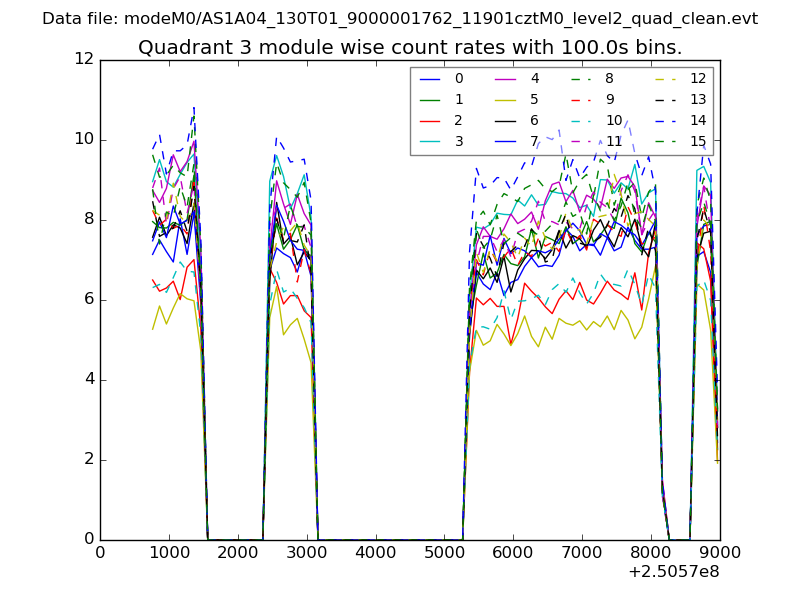
| Module-wise count rates for Quadrant A Data is divided into 100 sec bins |
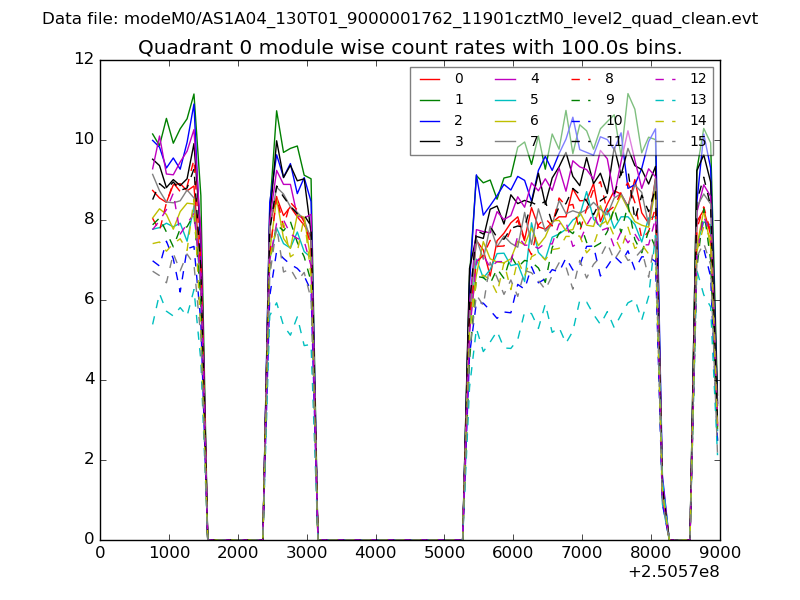 |
 |
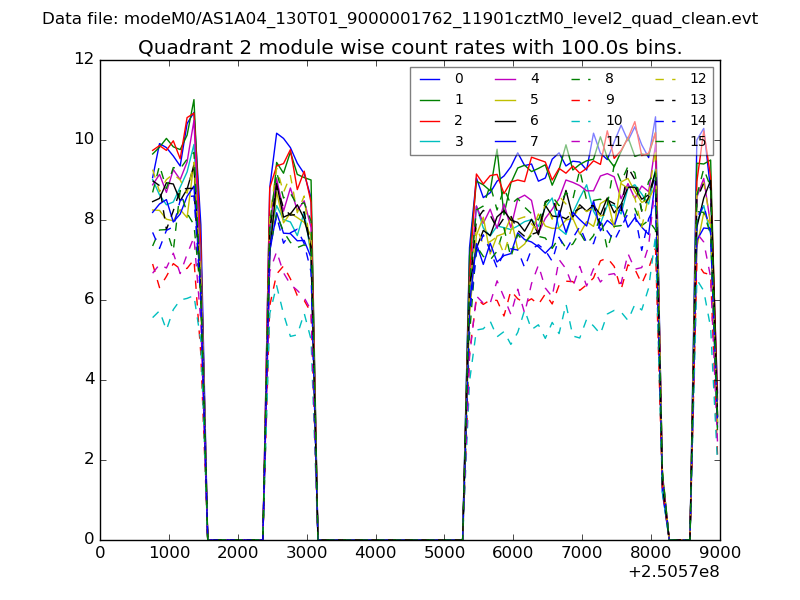
| Module-wise count rates for Quadrant B Data is divided into 100 sec bins |
 |
 |
| Module-wise count rates for Quadrant C Data is divided into 100 sec bins |
 |
 |
| Module-wise count rates for Quadrant D Data is divided into 100 sec bins |
 |
 |
| Parameter | Plot |
|---|---|
| CZT HV Monitor | 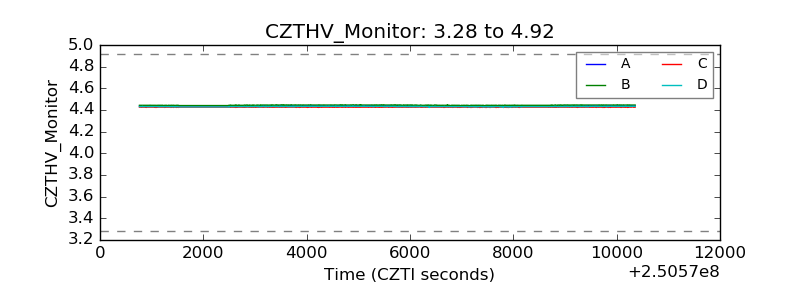 |
| D_VDD | 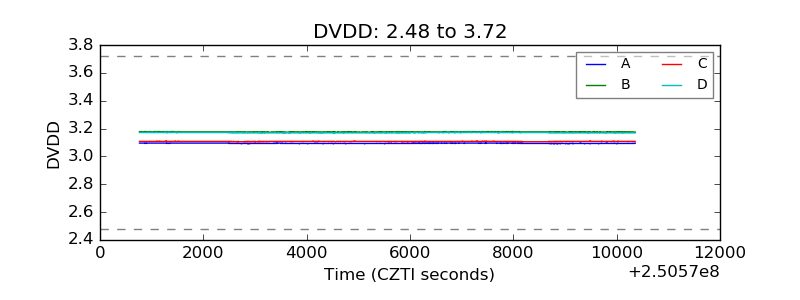 |
| Temperature 1 | 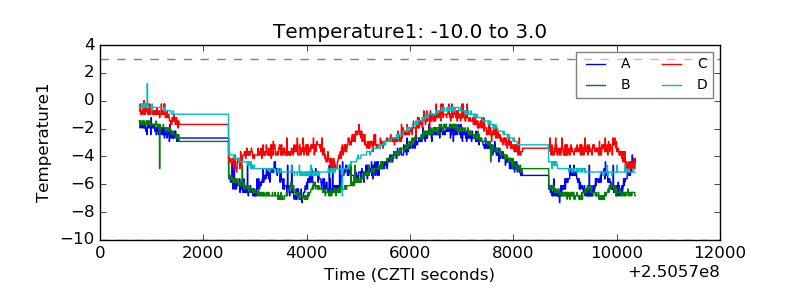 |
| Veto HV Monitor | 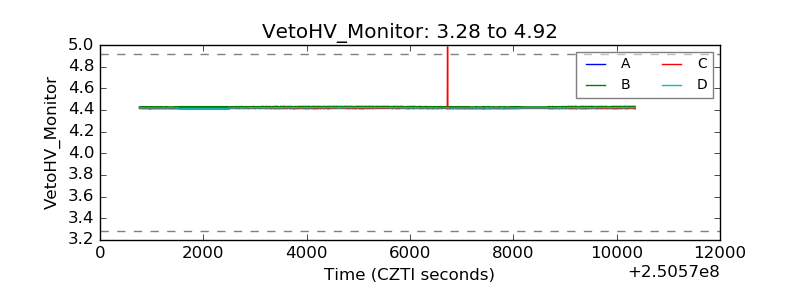 |
| Veto LLD | 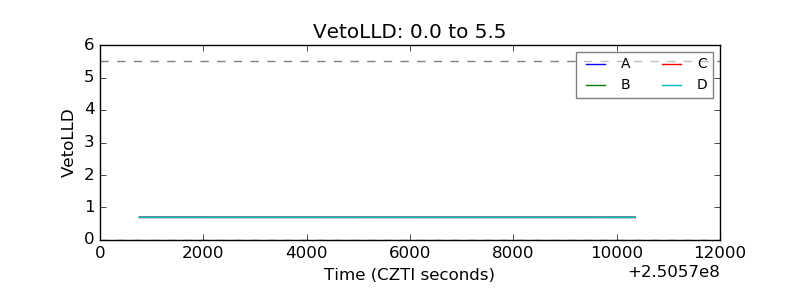 |
| Alpha Counter | 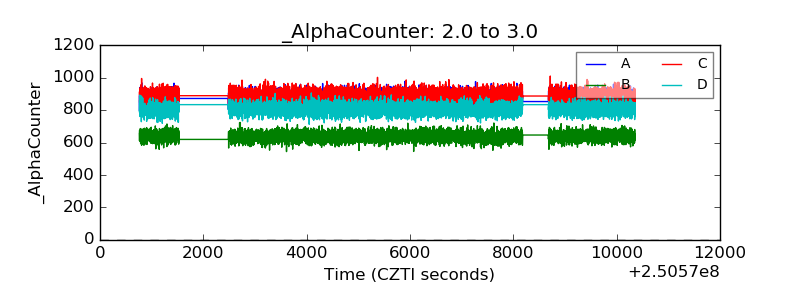 |
| _CPM_Rate | 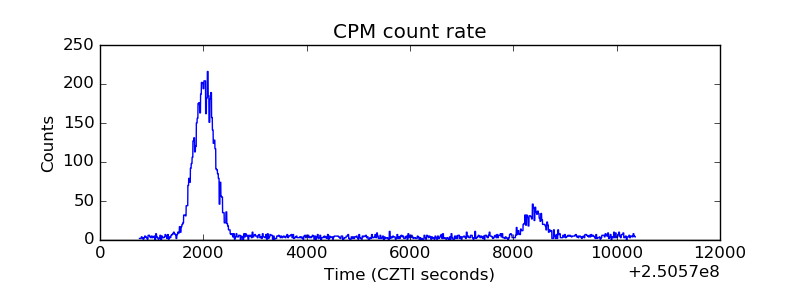 |
| CZT Counter | 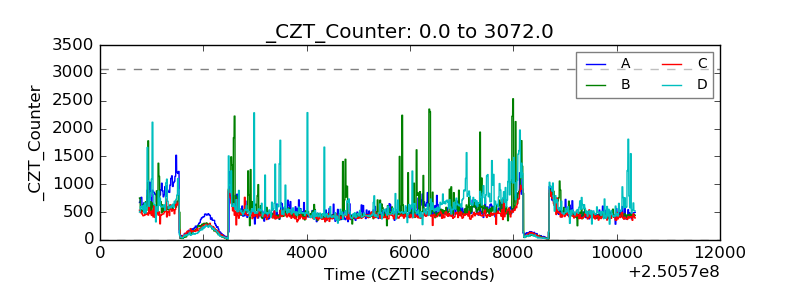 |
| +2.5 Volts monitor |  |
| +5 Volts monitor |  |
| _ROLL_ROT | 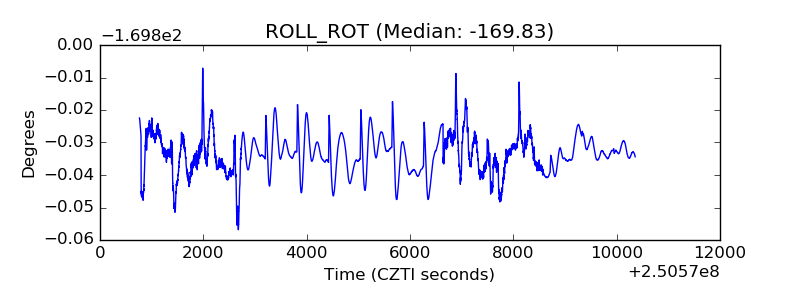 |
| _Roll_DEC | 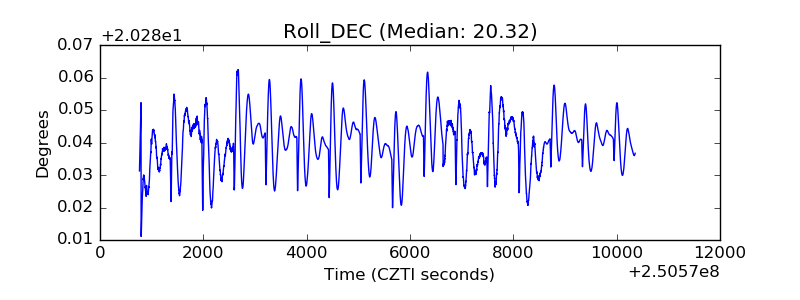 |
| _Roll_RA | 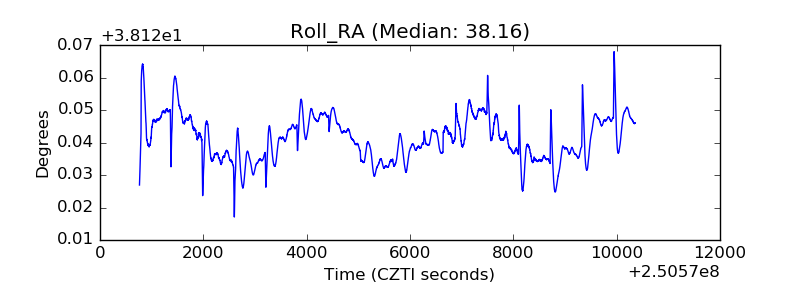 |
| Veto Counter | 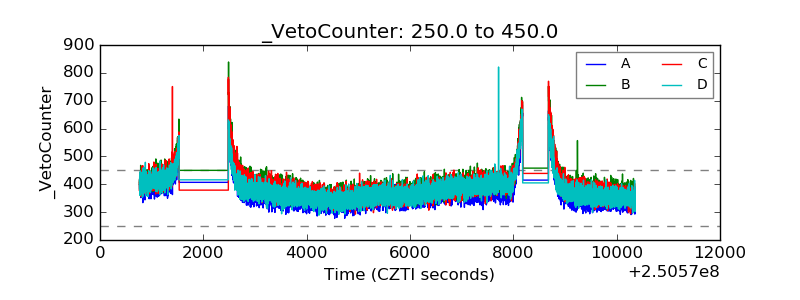 |