| Param | Original file | Final file |
|---|---|---|
| Filename | modeM0/AS1A04_130T01_9000001762_11902cztM0_level2.evt | modeM0/AS1A04_130T01_9000001762_11902cztM0_level2_quad_clean.evt |
| Size (bytes) | 408,631,680 | 57,168,000 |
| Size | 389.7 MB | 54.5 MB |
| Events in quadrant A | 2,708,283 | 350,014 |
| Events in quadrant B | 3,193,823 | 331,737 |
| Events in quadrant C | 2,286,379 | 357,884 |
| Events in quadrant D | 3,840,053 | 333,303 |
| Mode SS | |||
|---|---|---|---|
| Quadrant | BADHDUFLAG | Total packets | Discarded packets |
| A | 0 | 104 | 0 |
| B | 0 | 104 | 0 |
| C | 0 | 104 | 0 |
| D | 0 | 104 | 0 |
| Mode M0 | |||
|---|---|---|---|
| Quadrant | BADHDUFLAG | Total packets | Discarded packets |
| A | 0 | 11342 | 1 |
| B | 0 | 12883 | 1 |
| C | 0 | 10509 | 1 |
| D | 0 | 14658 | 1 |
| Mode M9 | |||
|---|---|---|---|
| Quadrant | BADHDUFLAG | Total packets | Discarded packets |
| A | 0 | 5 | 0 |
| B | 0 | 5 | 0 |
| C | 0 | 5 | 0 |
| D | 0 | 5 | 0 |
| Quadrant | Total seconds | Saturated seconds | Saturation percentage |
|---|---|---|---|
| A | 5100 | 115 | 2.254902% |
| B | 5100 | 351 | 6.882353% |
| C | 5100 | 36 | 0.705882% |
| D | 5100 | 290 | 5.686275% |
Noise dominated data is calculated using 1-second bins in cleaned event files. If a bin has >2000 counts, and if more than 50% of those come from <1% of pixels, then it is considered to be noise-dominated and hence unusable.
| Quadrant | # 1 sec bins | Bins with >0 counts | Bins with >2000 counts | High rate bins dominated by noise | Noise dominated (total time) | Noise dominated (detector-on time) | Marked lightcurve |
|---|---|---|---|---|---|---|---|
| A | 5601 | 5102 | 13 | 13 | 0.23% | 0.25% |  |
| B | 5601 | 5102 | 204 | 204 | 3.64% | 4.00% |  |
| C | 5601 | 5102 | 0 | 0 | 0.00% | 0.00% | 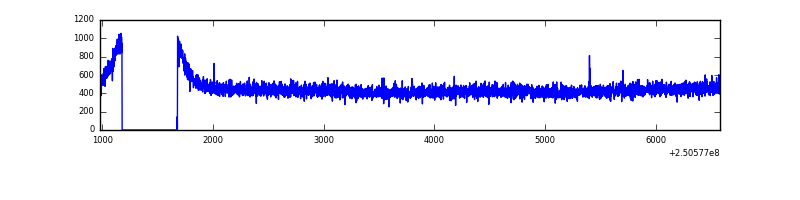 |
| D | 5601 | 5102 | 213 | 213 | 3.80% | 4.17% |  |
Top three noisy pixels from each quadrant. If the there are fewer than three noisy pixels in the level2.evt file, extra rows are filled as -1
| Pixel properties | Quadrant properties | ||||||
|---|---|---|---|---|---|---|---|
| Quadrant | DetID | PixID | Counts | Sigma | Mean | Median | Sigma |
| A | 14 | 63 | 104291 | 836.42 | 601 | 589 | 124.0 |
| A | 8 | 15 | 87638 | 702.1 | 601 | 589 | 124.0 |
| A | 1 | 162 | 79845 | 639.25 | 601 | 589 | 124.0 |
| B | 4 | 239 | 455205 | 3950.67 | 583 | 568 | 115.1 |
| B | 3 | 64 | 380751 | 3303.69 | 583 | 568 | 115.1 |
| B | 15 | 204 | 35761 | 305.82 | 583 | 568 | 115.1 |
| C | 13 | 61 | 4196 | 26.32 | 585 | 588 | 137.1 |
| C | 14 | 234 | 2004 | 10.33 | 585 | 588 | 137.1 |
| C | 12 | 4 | 1635 | 7.64 | 585 | 588 | 137.1 |
| D | 1 | 52 | 1156138 | 7970.88 | 572 | 558 | 145.0 |
| D | 8 | 195 | 356568 | 2455.66 | 572 | 558 | 145.0 |
| D | 10 | 50 | 33018 | 223.9 | 572 | 558 | 145.0 |
Histogram calculated using DETX and DETY for each event in the final _common_clean file
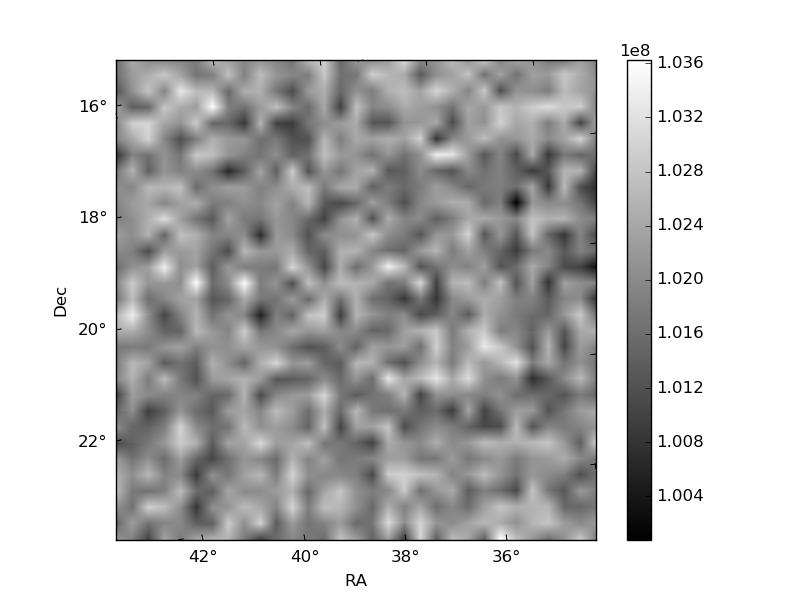
| Quadrant A | 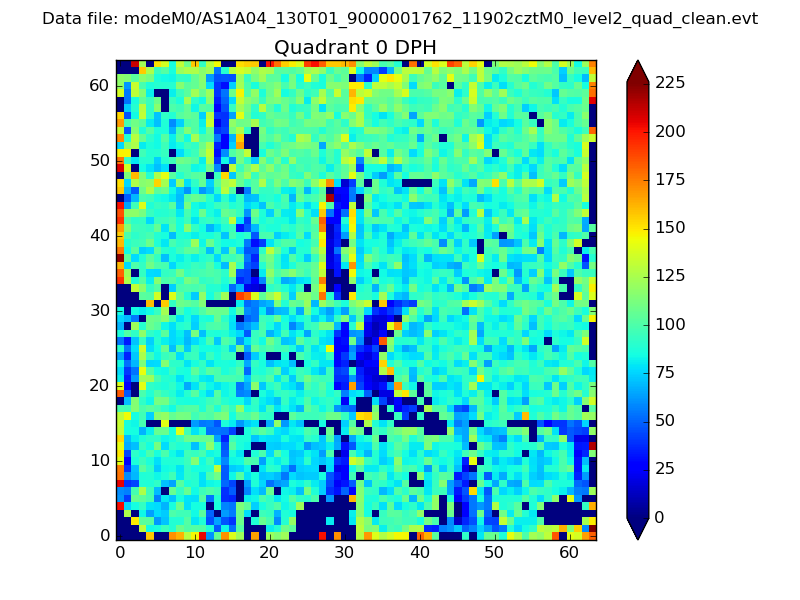 |
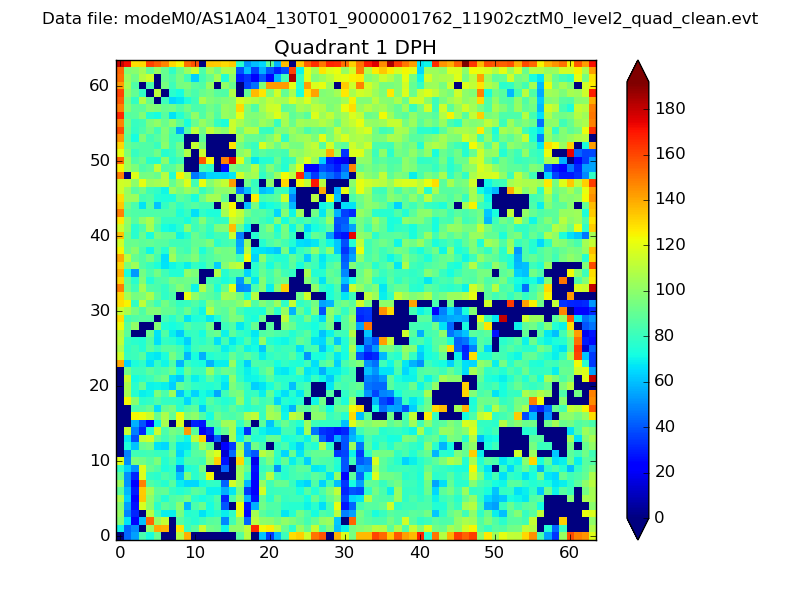 |
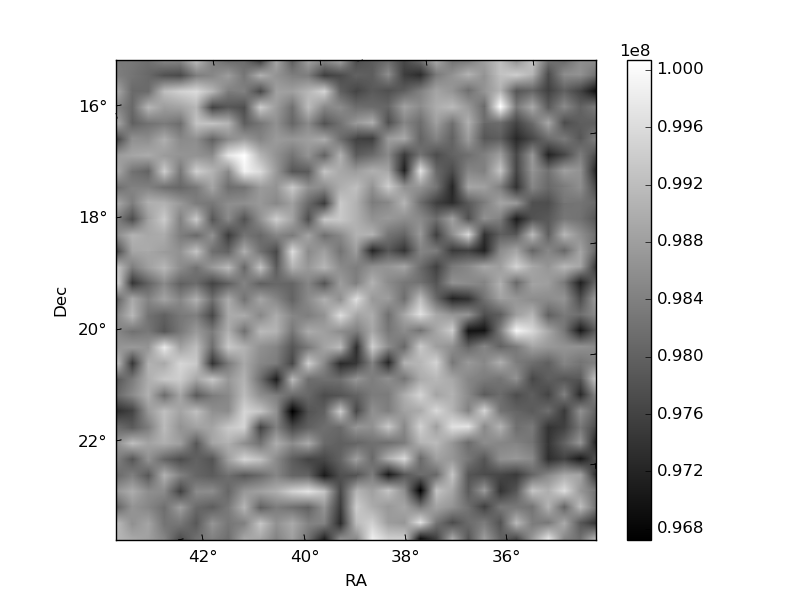
Quadrant B |
|---|---|---|---|
| Quadrant D | 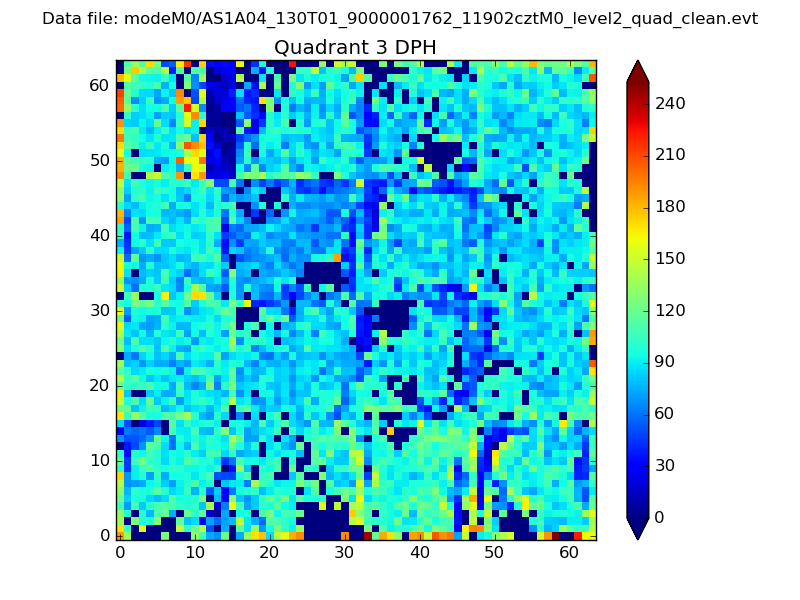 |
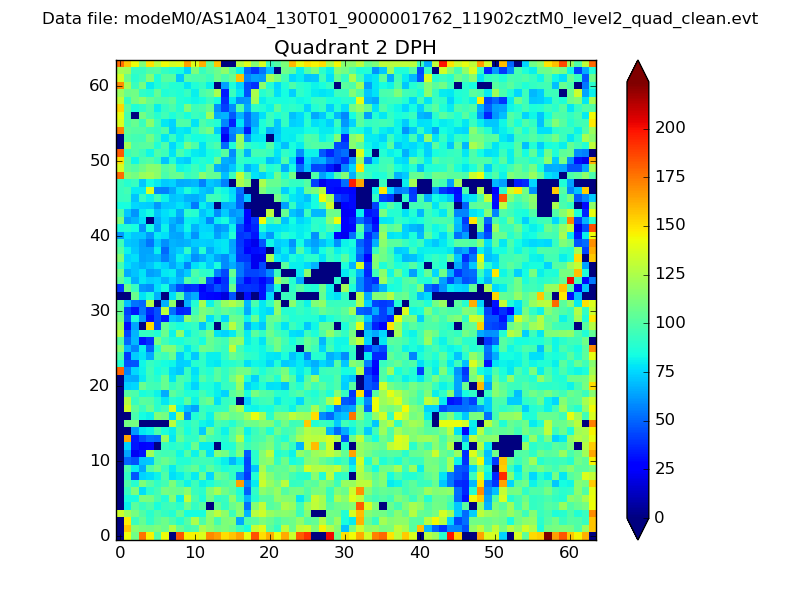 |
Quadrant C |
| Plot type | Count rate plots | Images |
|---|---|---|
| Comparison with Poisson distribution Blue bars denote a histogram of data divided into 1 sec bins. Red curve is a Poisson curve with rate = median count rate of data. |
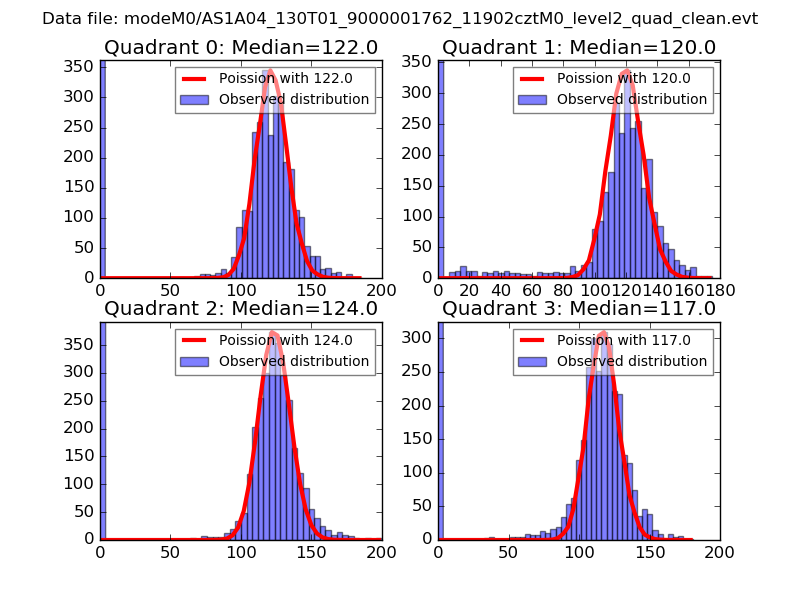 |
 |
| Quadrant-wise count rates Data is divided into 100 sec bins |
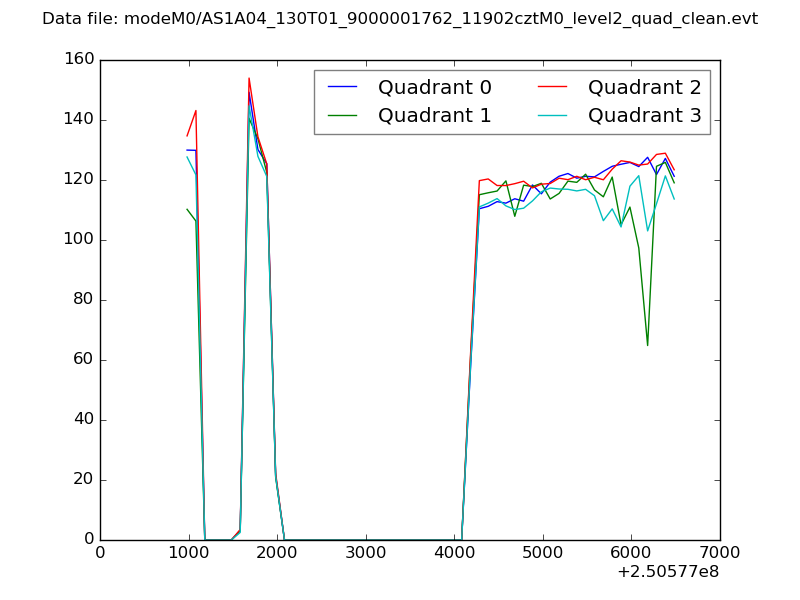 |
|
| Module-wise count rates for Quadrant A Data is divided into 100 sec bins |
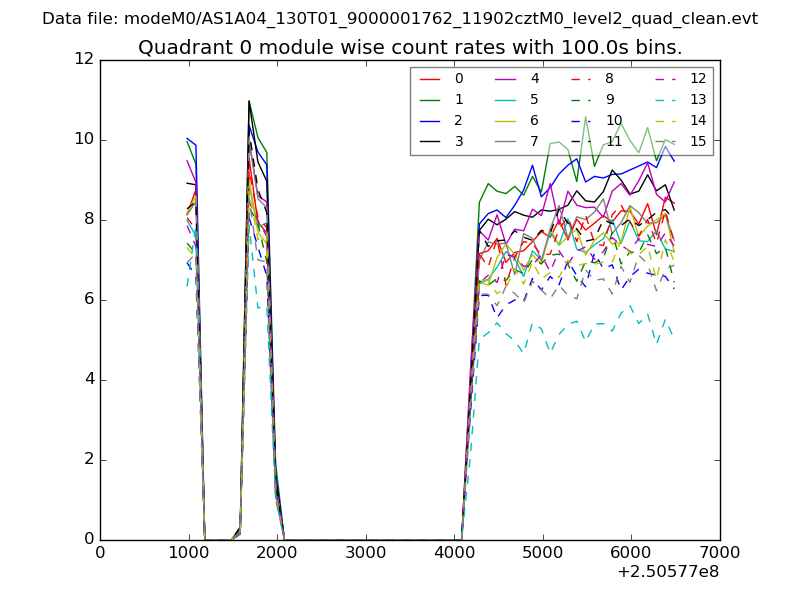 |
 |
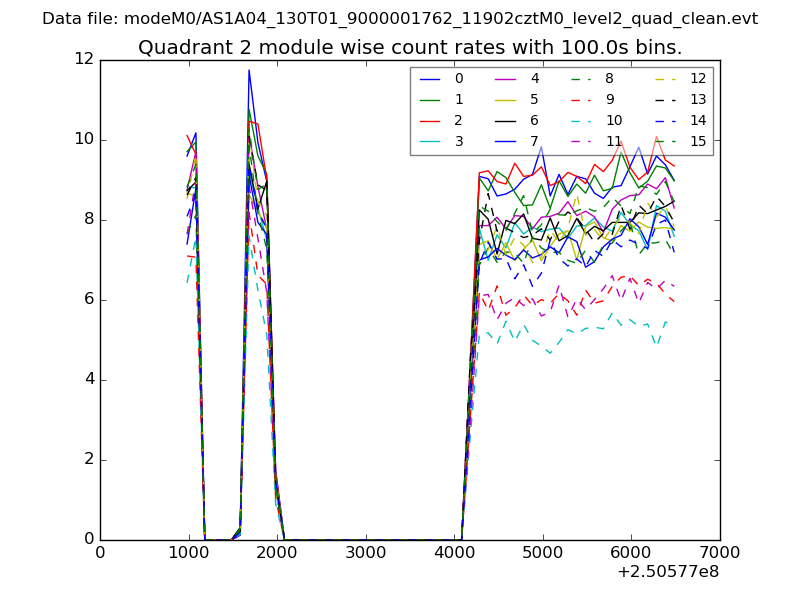
| Module-wise count rates for Quadrant B Data is divided into 100 sec bins |
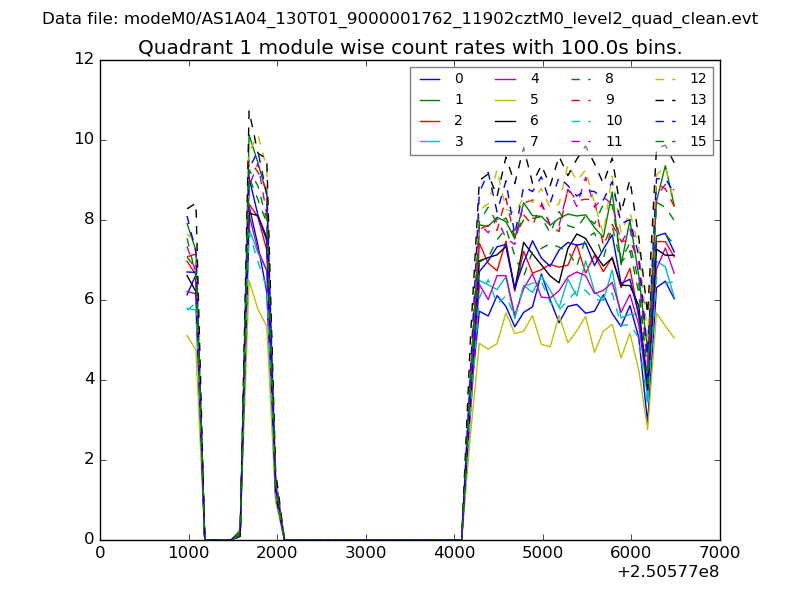 |
 |
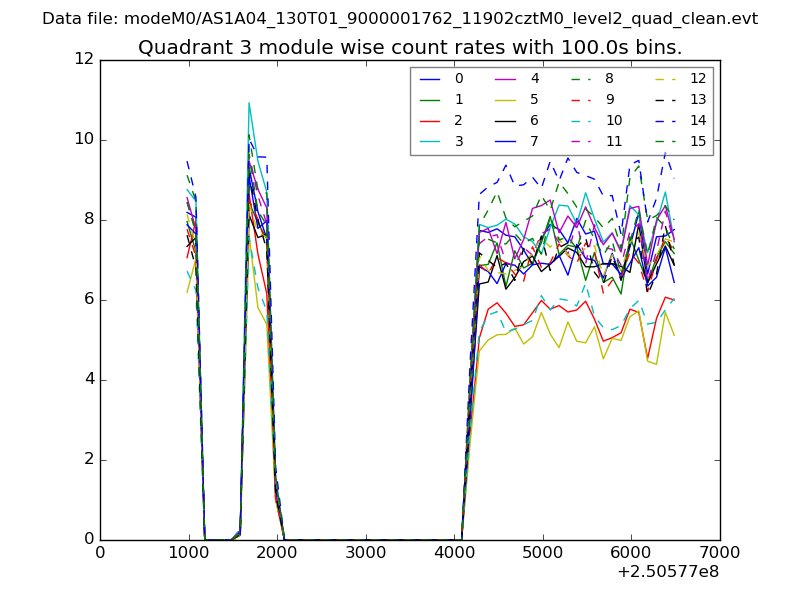
| Module-wise count rates for Quadrant C Data is divided into 100 sec bins |
 |
 |
| Module-wise count rates for Quadrant D Data is divided into 100 sec bins |
 |
 |
| Parameter | Plot |
|---|---|
| CZT HV Monitor | 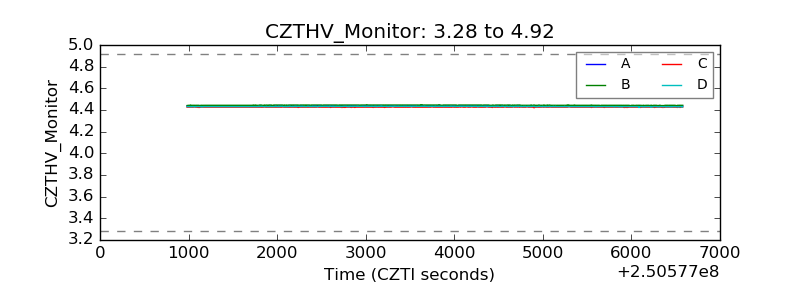 |
| D_VDD | 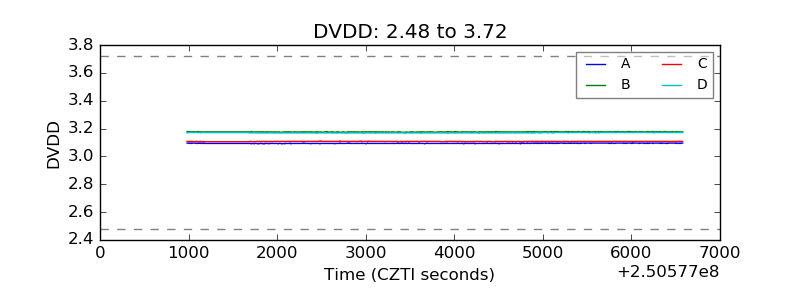 |
| Temperature 1 | 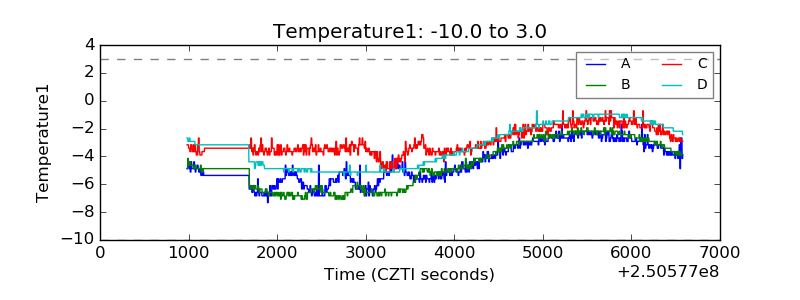 |
| Veto HV Monitor | 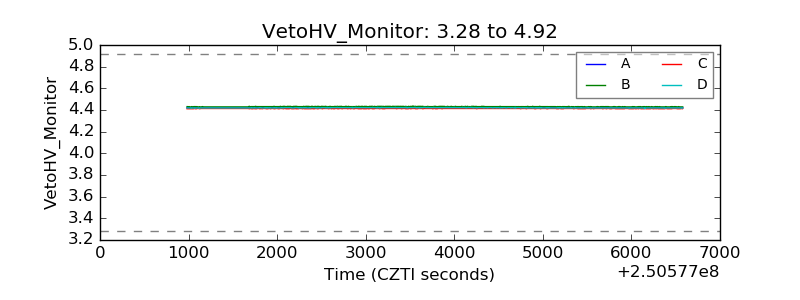 |
| Veto LLD | 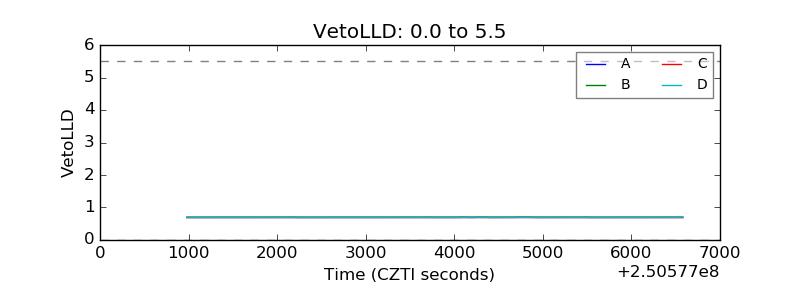 |
| Alpha Counter | 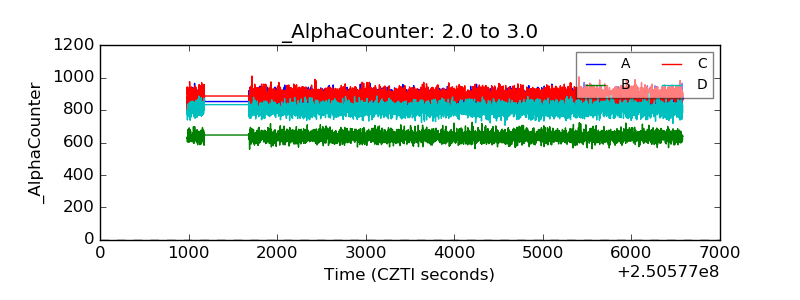 |
| _CPM_Rate | 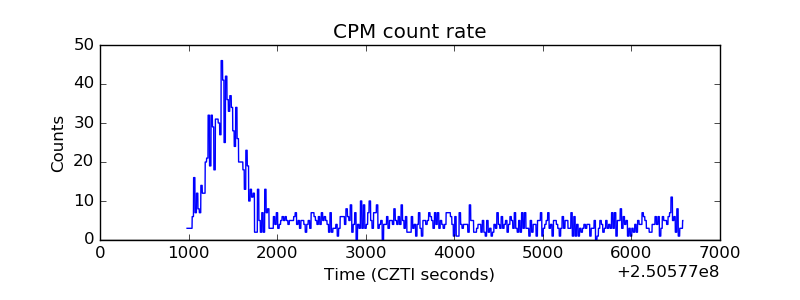 |
| CZT Counter | 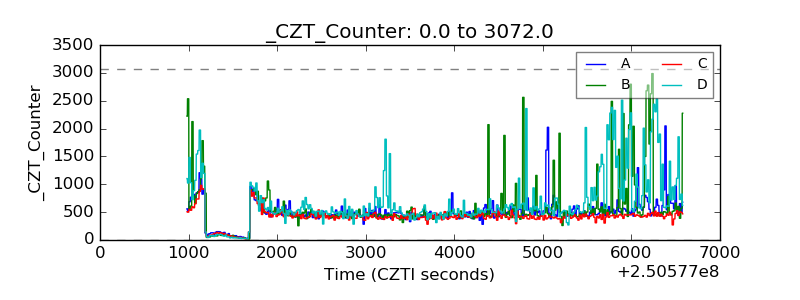 |
| +2.5 Volts monitor |  |
| +5 Volts monitor | 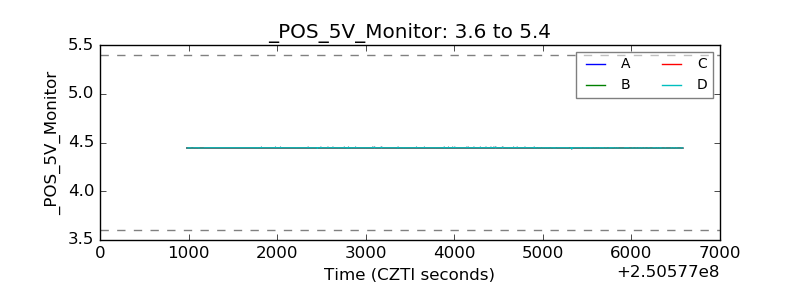 |
| _ROLL_ROT | 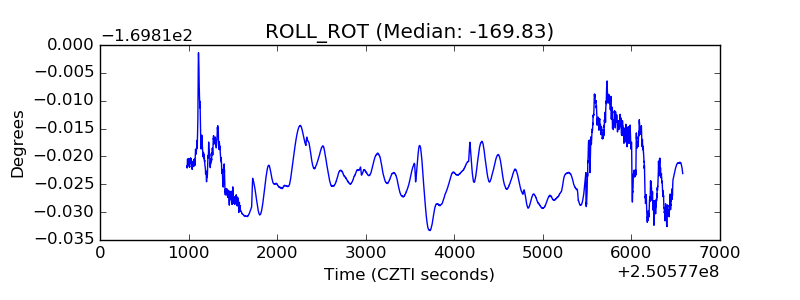 |
| _Roll_DEC | 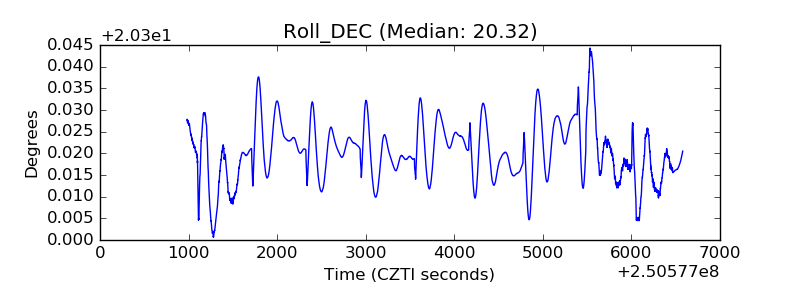 |
| _Roll_RA | 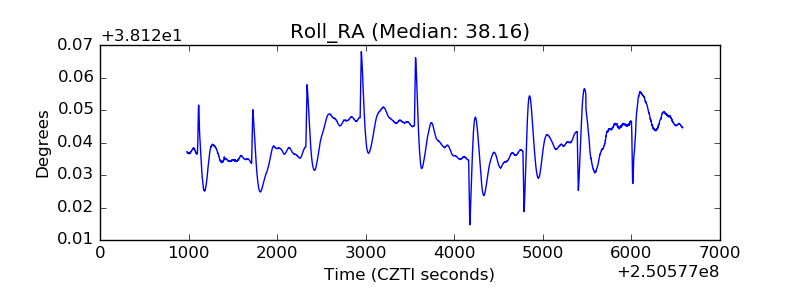 |
| Veto Counter | 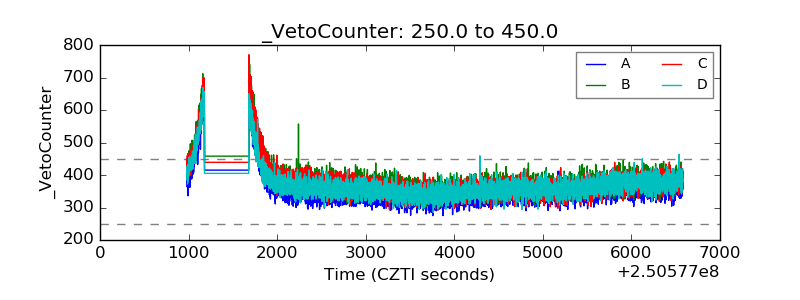 |