| Param | Original file | Final file |
|---|---|---|
| Filename | modeM0/AS1G08_083T04_9000001760cztM0_level2.fits | modeM0/AS1G08_083T04_9000001760cztM0_level2_quad_clean.evt |
| Size (bytes) | 274,469,760 | 291,899,520 |
| Size | 261.8 MB | 278.4 MB |
| Events in quadrant A | 1,634,506 | 1,763,778 |
| Events in quadrant B | 1,552,936 | 1,683,983 |
| Events in quadrant C | 1,635,542 | 1,730,153 |
| Events in quadrant D | 1,397,806 | 1,571,746 |
| Mode SS | |||
|---|---|---|---|
| Quadrant | BADHDUFLAG | Total packets | Discarded packets |
| A | 0 | 622 | 0 |
| B | 0 | 622 | 0 |
| C | 0 | 622 | 0 |
| D | 0 | 622 | 0 |
| Mode M0 | |||
|---|---|---|---|
| Quadrant | BADHDUFLAG | Total packets | Discarded packets |
| A | 0 | 68929 | 0 |
| B | 0 | 79148 | 0 |
| C | 0 | 62234 | 0 |
| D | 0 | 74288 | 0 |
| Mode M9 | |||
|---|---|---|---|
| Quadrant | BADHDUFLAG | Total packets | Discarded packets |
| A | 0 | 33 | 0 |
| B | 0 | 33 | 0 |
| C | 0 | 33 | 0 |
| D | 0 | 33 | 0 |
| Quadrant | Total seconds | Saturated seconds | Saturation percentage |
|---|---|---|---|
| A | 30399 | 857 | 2.819172% |
| B | 30399 | 1571 | 5.167933% |
| C | 30399 | 422 | 1.388204% |
| D | 30399 | 1001 | 3.292871% |
Noise dominated data is calculated using 1-second bins in cleaned event files. If a bin has >2000 counts, and if more than 50% of those come from <1% of pixels, then it is considered to be noise-dominated and hence unusable.
| Quadrant | # 1 sec bins | Bins with >0 counts | Bins with >2000 counts | High rate bins dominated by noise | Noise dominated (total time) | Noise dominated (detector-on time) | Marked lightcurve |
|---|---|---|---|---|---|---|---|
| A | 33874 | 30399 | 0 | 0 | 0.00% | 0.00% |  |
| B | 33874 | 30393 | 0 | 0 | 0.00% | 0.00% |  |
| C | 33874 | 30399 | 0 | 0 | 0.00% | 0.00% |  |
| D | 33873 | 30395 | 0 | 0 | 0.00% | 0.00% |  |
Top three noisy pixels from each quadrant. If the there are fewer than three noisy pixels in the level2.evt file, extra rows are filled as -1
| Pixel properties | Quadrant properties | ||||||
|---|---|---|---|---|---|---|---|
| Quadrant | DetID | PixID | Counts | Sigma | Mean | Median | Sigma |
| A | 14 | 188 | 1613 | 11.15 | 425 | 397 | 109.0 |
| A | 0 | 29 | 1576 | 10.81 | 425 | 397 | 109.0 |
| A | 14 | 204 | 1414 | 9.33 | 425 | 397 | 109.0 |
| B | 2 | 9 | 1402 | 12.1 | 410 | 389 | 83.7 |
| B | 3 | 17 | 1130 | 8.85 | 410 | 389 | 83.7 |
| B | 14 | 254 | 1070 | 8.13 | 410 | 389 | 83.7 |
| C | 1 | 80 | 1242 | 7.47 | 431 | 399 | 112.8 |
| C | 1 | 81 | 1233 | 7.39 | 431 | 399 | 112.8 |
| C | 2 | 191 | 1159 | 6.74 | 431 | 399 | 112.8 |
| D | 6 | 231 | 1018 | 6.08 | 398 | 361 | 108.0 |
| D | 4 | 160 | 1005 | 5.96 | 398 | 361 | 108.0 |
| D | 3 | 159 | 988 | 5.81 | 398 | 361 | 108.0 |
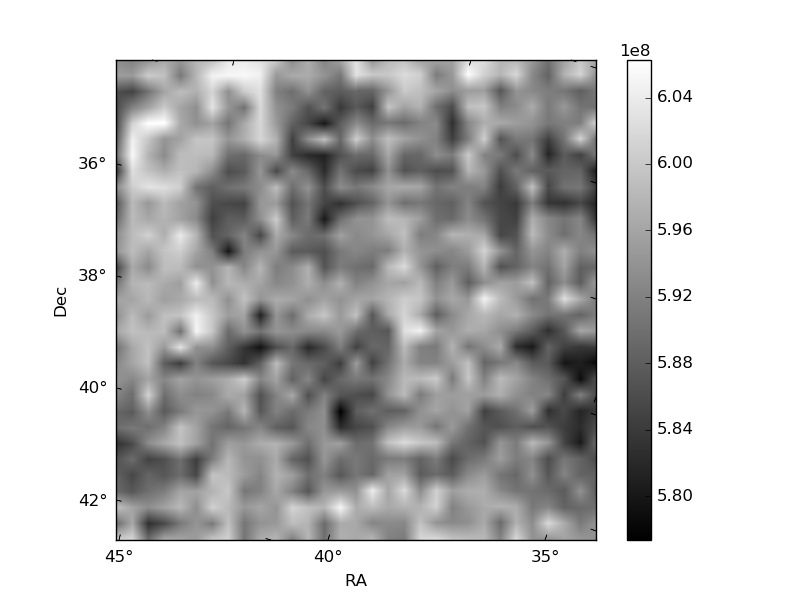
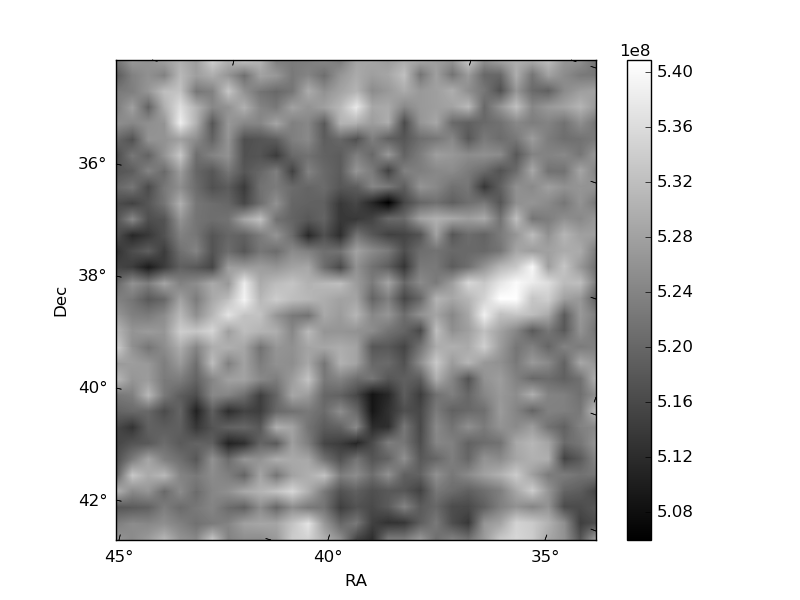
Histogram calculated using DETX and DETY for each event in the final _common_clean file
| Quadrant A | 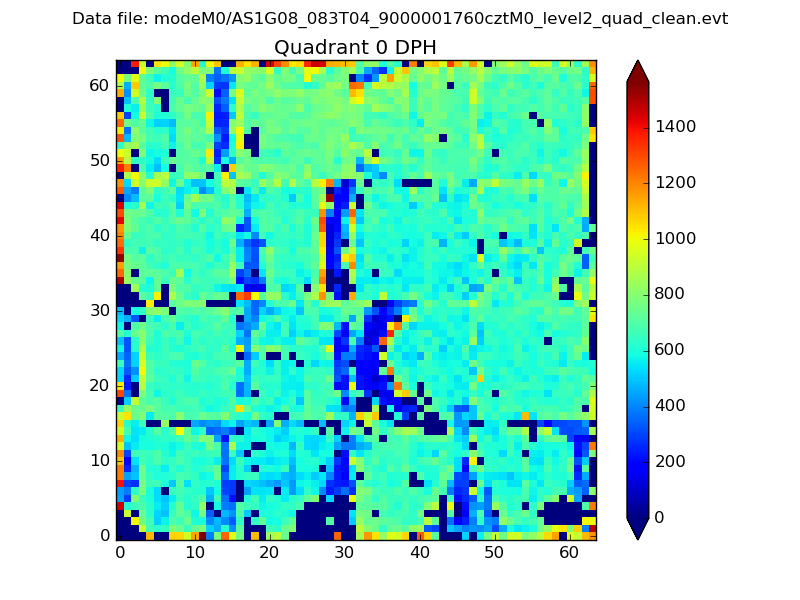 |
 |
Quadrant B |
|---|---|---|---|
| Quadrant D | 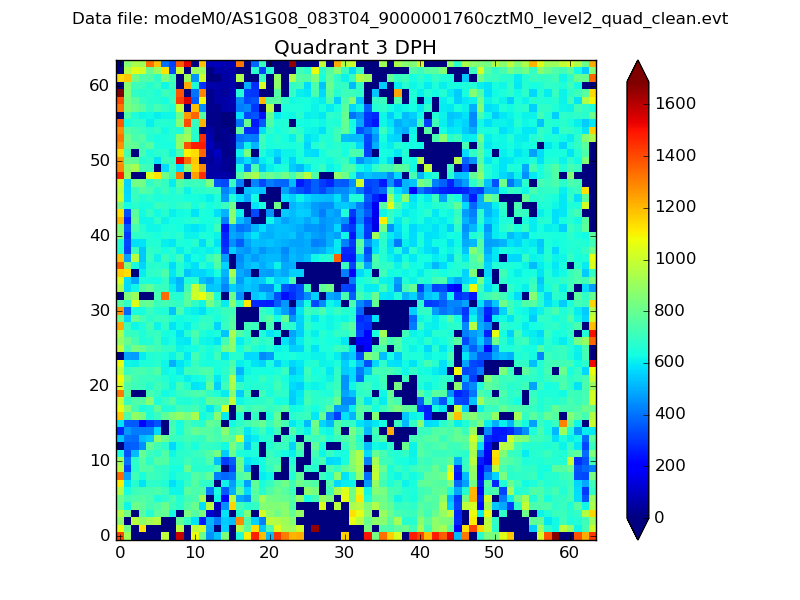 |
 |
Quadrant C |
| Plot type | Count rate plots | Images |
|---|---|---|
| Comparison with Poisson distribution Blue bars denote a histogram of data divided into 1 sec bins. Red curve is a Poisson curve with rate = median count rate of data. |
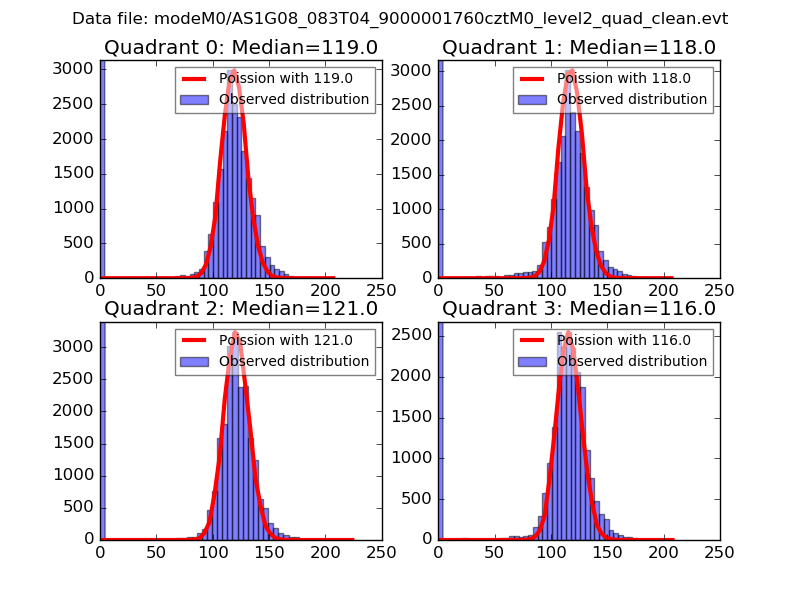 |
 |
| Quadrant-wise count rates Data is divided into 100 sec bins |
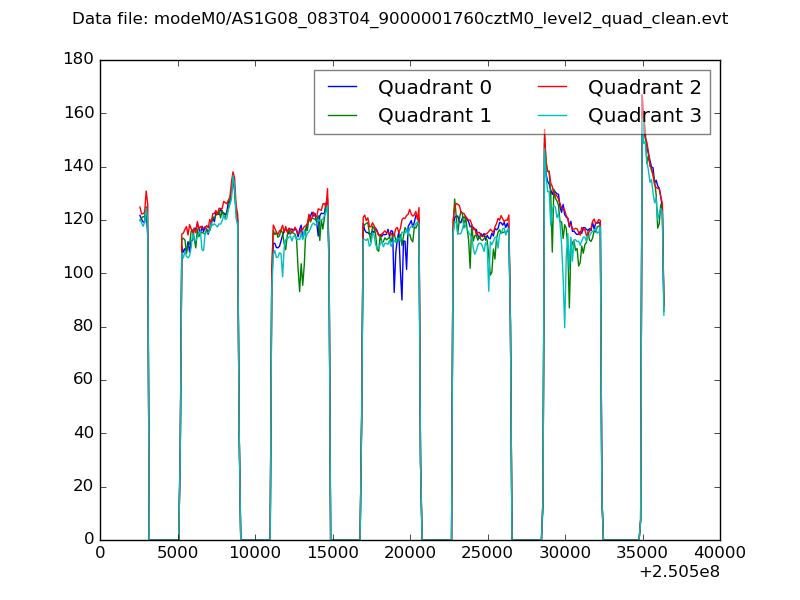 |
|
| Module-wise count rates for Quadrant A Data is divided into 100 sec bins |
 |
 |
| Module-wise count rates for Quadrant B Data is divided into 100 sec bins |
 |
 |
| Module-wise count rates for Quadrant C Data is divided into 100 sec bins |
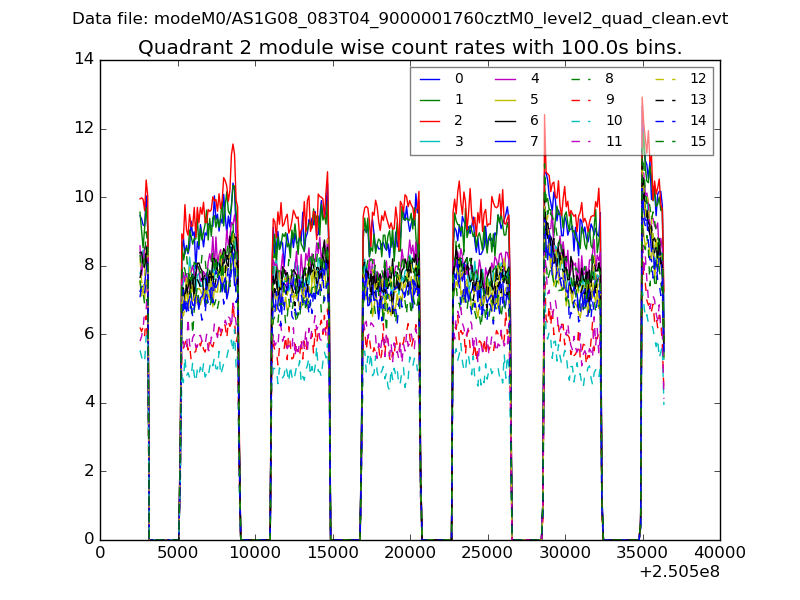 |
 |
| Module-wise count rates for Quadrant D Data is divided into 100 sec bins |
 |
 |
| Parameter | Plot |
|---|---|
| CZT HV Monitor |  |
| D_VDD |  |
| Temperature 1 |  |
| Veto HV Monitor |  |
| Veto LLD |  |
| Alpha Counter |  |
| _CPM_Rate |  |
| CZT Counter |  |
| +2.5 Volts monitor |  |
| +5 Volts monitor | 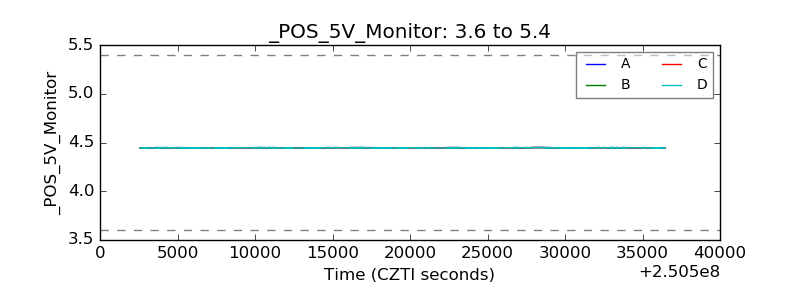 |
| _ROLL_ROT |  |
| _Roll_DEC |  |
| _Roll_RA |  |
| Veto Counter |  |