| Param | Original file | Final file |
|---|---|---|
| Filename | modeM0/AS1G08_083T04_9000001760_11888cztM0_level2.evt | modeM0/AS1G08_083T04_9000001760_11888cztM0_level2_quad_clean.evt |
| Size (bytes) | 167,063,040 | 15,287,040 |
| Size | 159.3 MB | 14.6 MB |
| Events in quadrant A | 1,285,445 | 72,070 |
| Events in quadrant B | 1,198,145 | 72,930 |
| Events in quadrant C | 1,152,140 | 75,272 |
| Events in quadrant D | 1,261,399 | 72,466 |
| Mode SS | |||
|---|---|---|---|
| Quadrant | BADHDUFLAG | Total packets | Discarded packets |
| A | 0 | 50 | 0 |
| B | 0 | 50 | 0 |
| C | 0 | 50 | 0 |
| D | 0 | 50 | 0 |
| Mode M0 | |||
|---|---|---|---|
| Quadrant | BADHDUFLAG | Total packets | Discarded packets |
| A | 0 | 5289 | 2 |
| B | 0 | 5115 | 1 |
| C | 0 | 5048 | 1 |
| D | 0 | 5207 | 1 |
| Mode M9 | |||
|---|---|---|---|
| Quadrant | BADHDUFLAG | Total packets | Discarded packets |
| A | 0 | 1 | 0 |
| B | 0 | 1 | 0 |
| C | 0 | 1 | 0 |
| D | 0 | 1 | 0 |
| Quadrant | Total seconds | Saturated seconds | Saturation percentage |
|---|---|---|---|
| A | 2347 | 184 | 7.839795% |
| B | 2347 | 190 | 8.095441% |
| C | 2347 | 105 | 4.473796% |
| D | 2347 | 119 | 5.070303% |
Noise dominated data is calculated using 1-second bins in cleaned event files. If a bin has >2000 counts, and if more than 50% of those come from <1% of pixels, then it is considered to be noise-dominated and hence unusable.
| Quadrant | # 1 sec bins | Bins with >0 counts | Bins with >2000 counts | High rate bins dominated by noise | Noise dominated (total time) | Noise dominated (detector-on time) | Marked lightcurve |
|---|---|---|---|---|---|---|---|
| A | 2488 | 2349 | 1 | 1 | 0.04% | 0.04% | 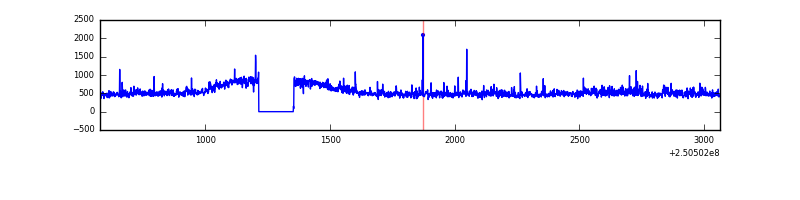 |
| B | 2488 | 2349 | 1 | 1 | 0.04% | 0.04% | 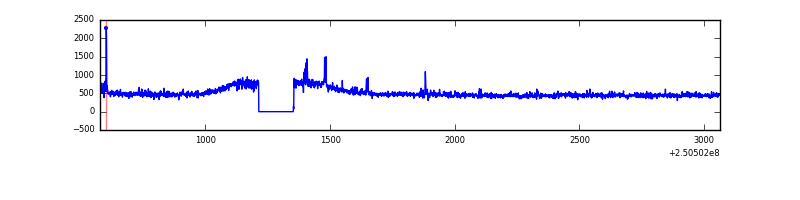 |
| C | 2488 | 2349 | 0 | 0 | 0.00% | 0.00% | 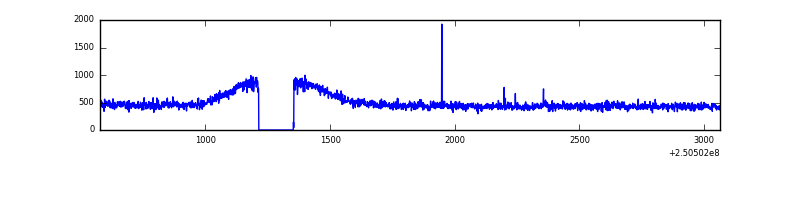 |
| D | 2488 | 2349 | 2 | 2 | 0.08% | 0.09% | 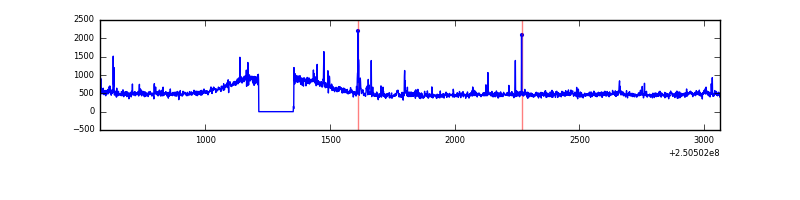 |
Top three noisy pixels from each quadrant. If the there are fewer than three noisy pixels in the level2.evt file, extra rows are filled as -1
| Pixel properties | Quadrant properties | ||||||
|---|---|---|---|---|---|---|---|
| Quadrant | DetID | PixID | Counts | Sigma | Mean | Median | Sigma |
| A | 8 | 15 | 66512 | 1047.23 | 294 | 286 | 63.2 |
| A | 1 | 162 | 30629 | 479.81 | 294 | 286 | 63.2 |
| A | 1 | 178 | 15834 | 245.86 | 294 | 286 | 63.2 |
| B | 4 | 239 | 17572 | 286.02 | 297 | 288 | 60.4 |
| B | 12 | 111 | 6832 | 108.29 | 297 | 288 | 60.4 |
| B | 11 | 111 | 5686 | 89.33 | 297 | 288 | 60.4 |
| C | 8 | 128 | 3373 | 43.59 | 293 | 293 | 70.7 |
| C | 12 | 4 | 3199 | 41.13 | 293 | 293 | 70.7 |
| C | 13 | 61 | 2177 | 26.66 | 293 | 293 | 70.7 |
| D | 8 | 195 | 119911 | 1687.99 | 288 | 278 | 70.9 |
| D | 9 | 85 | 14637 | 202.6 | 288 | 278 | 70.9 |
| D | 13 | 104 | 10803 | 148.51 | 288 | 278 | 70.9 |
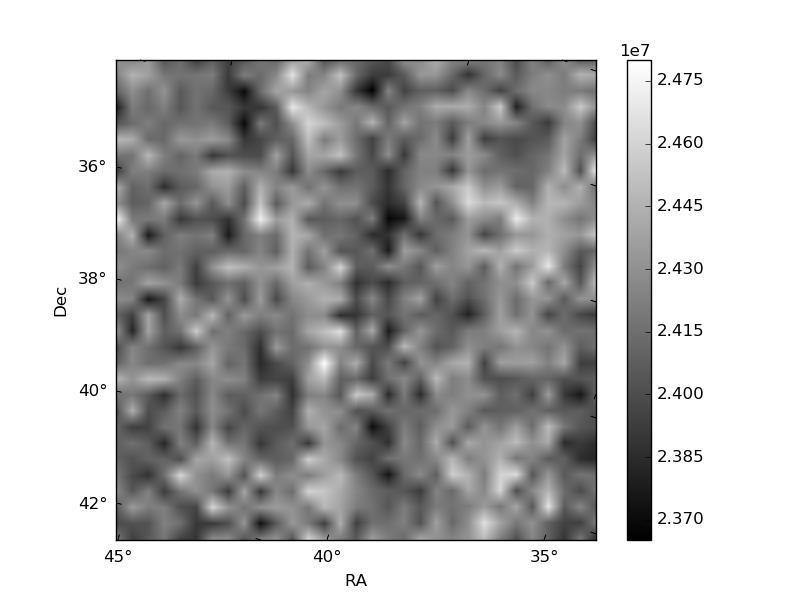
Histogram calculated using DETX and DETY for each event in the final _common_clean file
| Quadrant A | 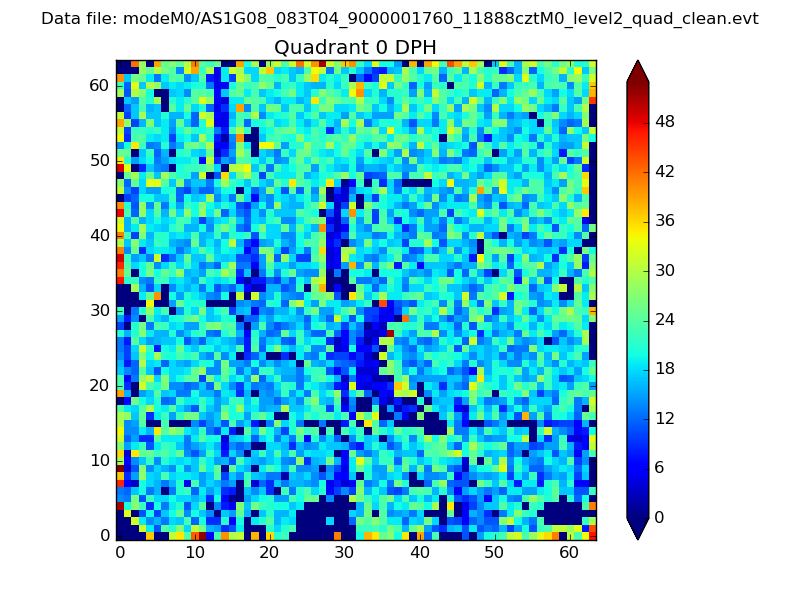 |
 |
Quadrant B |
|---|---|---|---|
| Quadrant D |  |
 |
Quadrant C |
| Plot type | Count rate plots | Images |
|---|---|---|
| Comparison with Poisson distribution Blue bars denote a histogram of data divided into 1 sec bins. Red curve is a Poisson curve with rate = median count rate of data. |
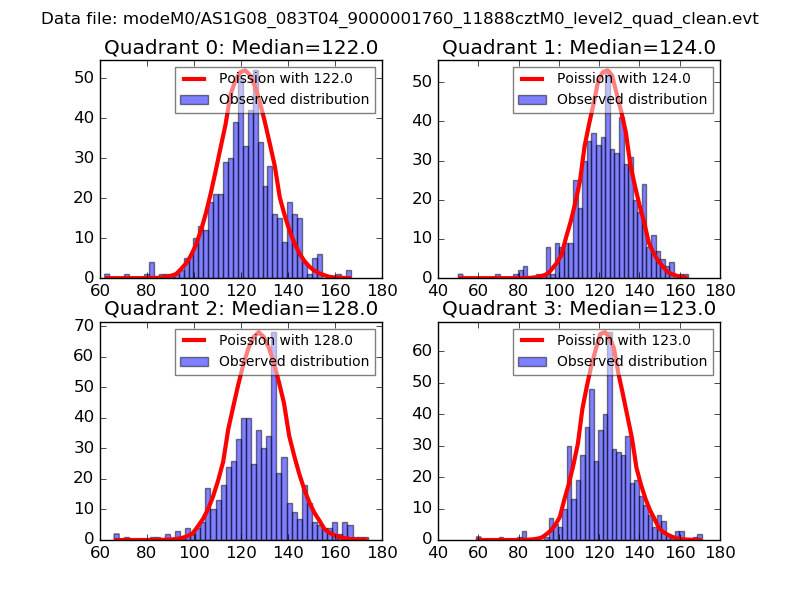 |
 |
| Quadrant-wise count rates Data is divided into 100 sec bins |
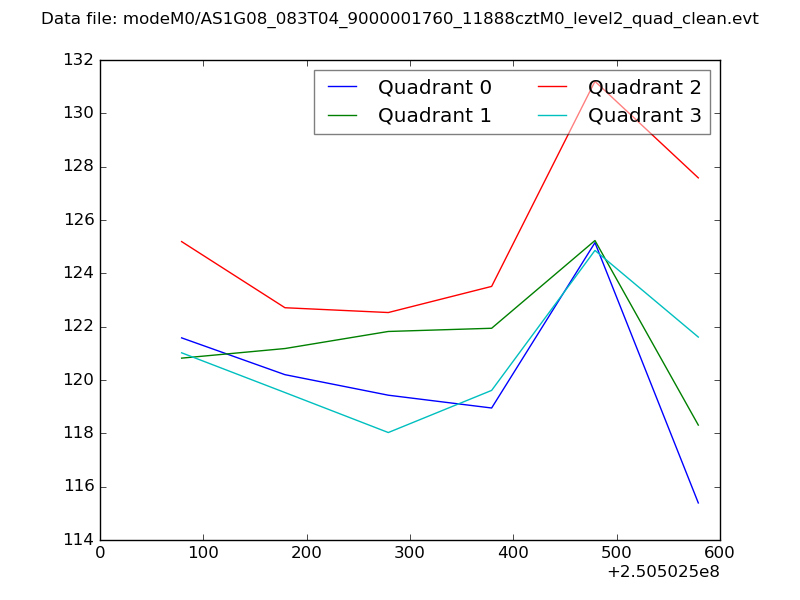 |
|
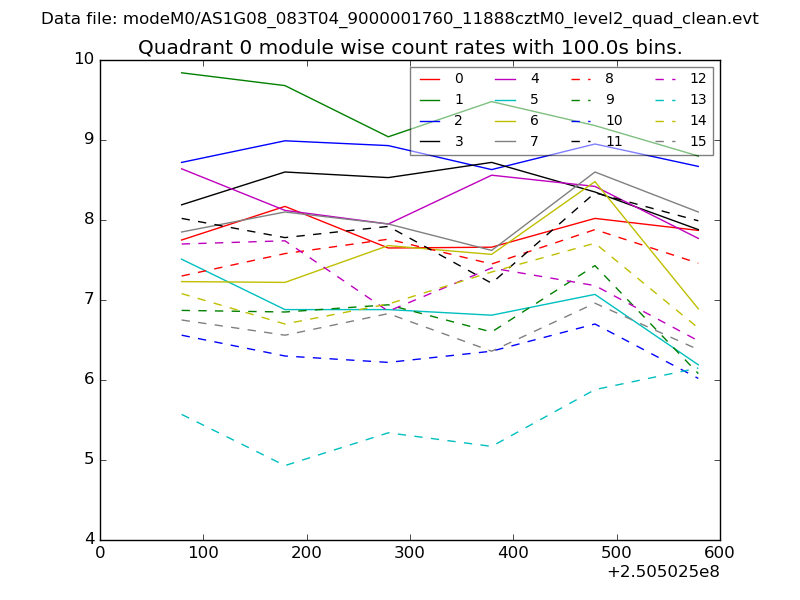
| Module-wise count rates for Quadrant A Data is divided into 100 sec bins |
 |
 |
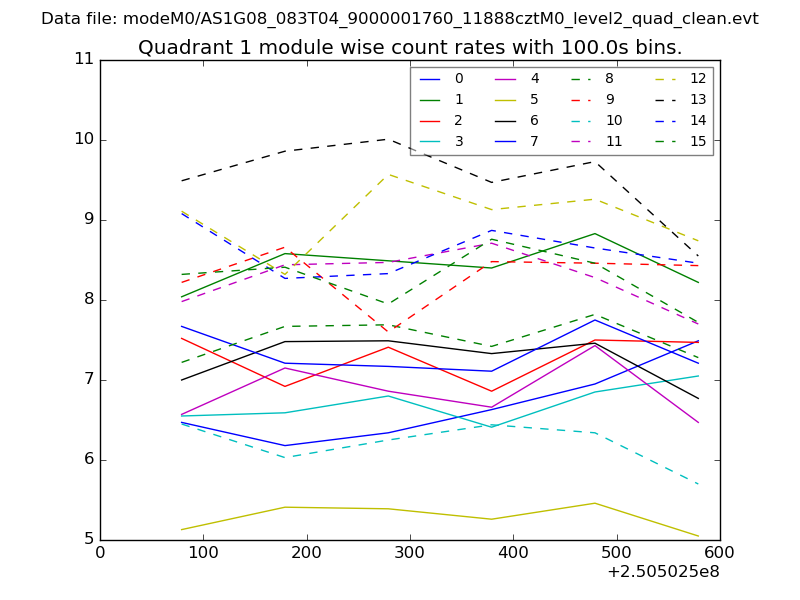
| Module-wise count rates for Quadrant B Data is divided into 100 sec bins |
 |
 |
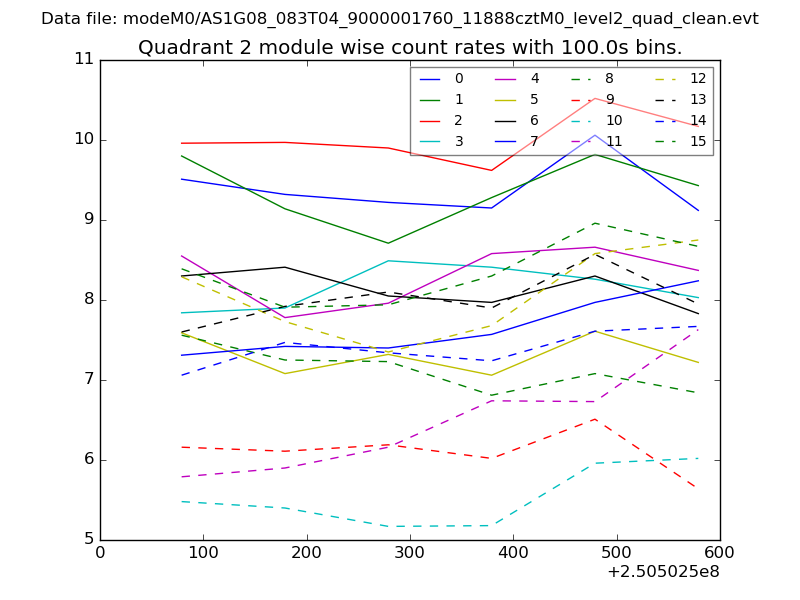
| Module-wise count rates for Quadrant C Data is divided into 100 sec bins |
 |
 |
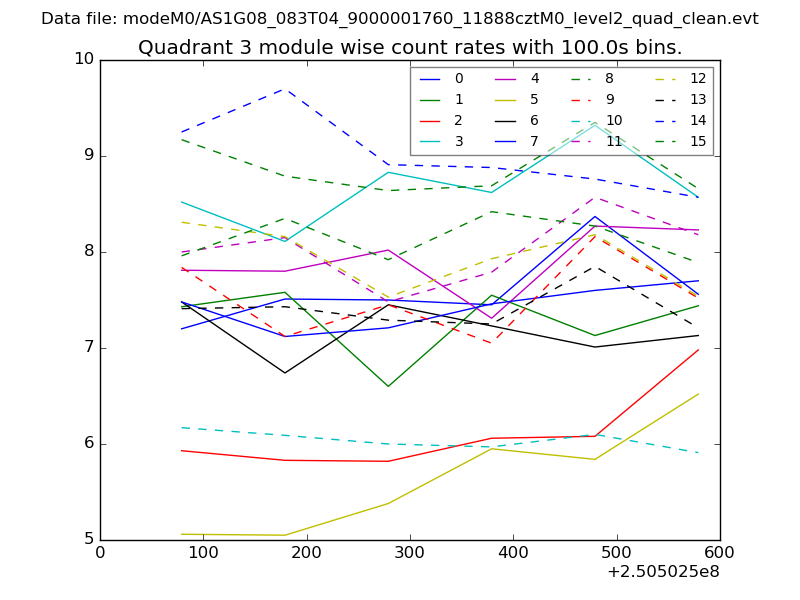
| Module-wise count rates for Quadrant D Data is divided into 100 sec bins |
 |
 |
| Parameter | Plot |
|---|---|
| CZT HV Monitor | 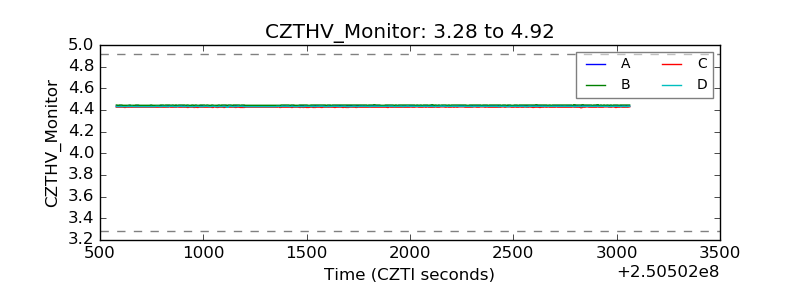 |
| D_VDD | 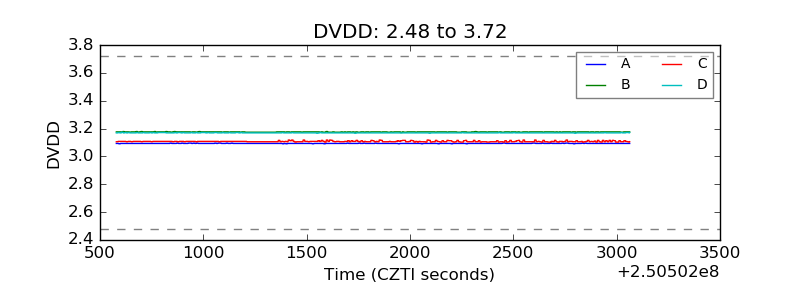 |
| Temperature 1 | 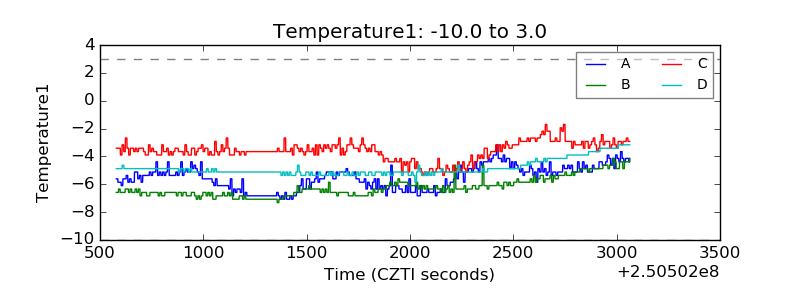 |
| Veto HV Monitor | 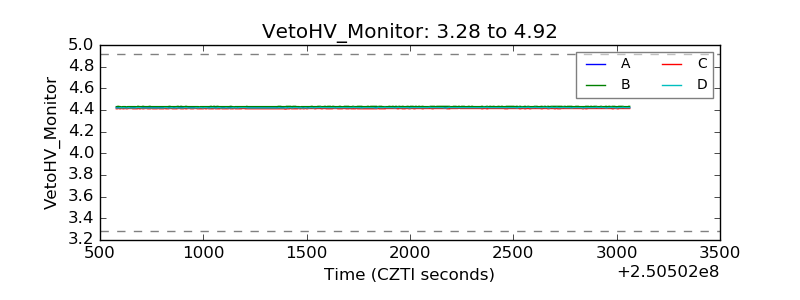 |
| Veto LLD | 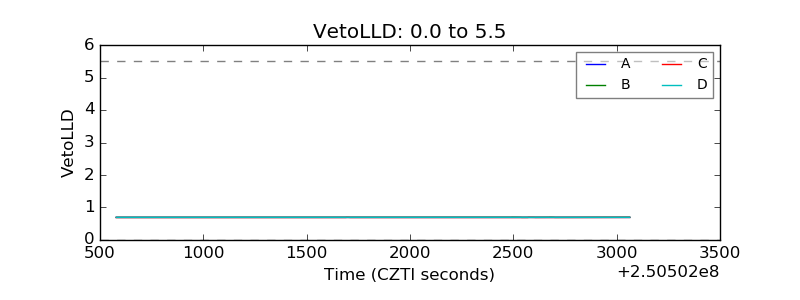 |
| Alpha Counter | 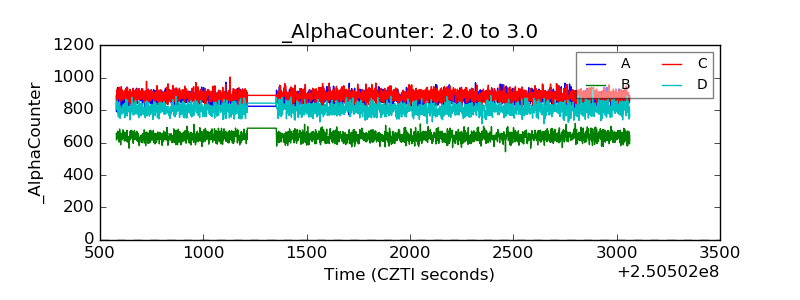 |
| _CPM_Rate | 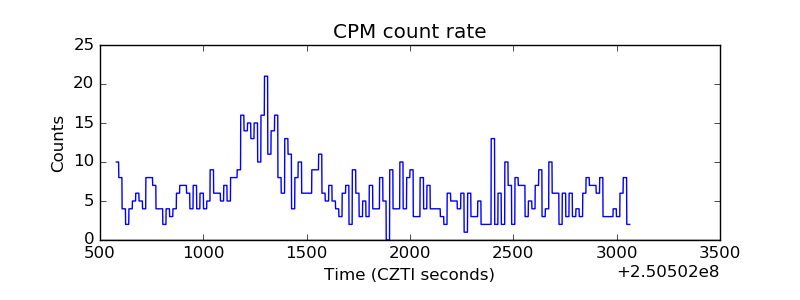 |
| CZT Counter | 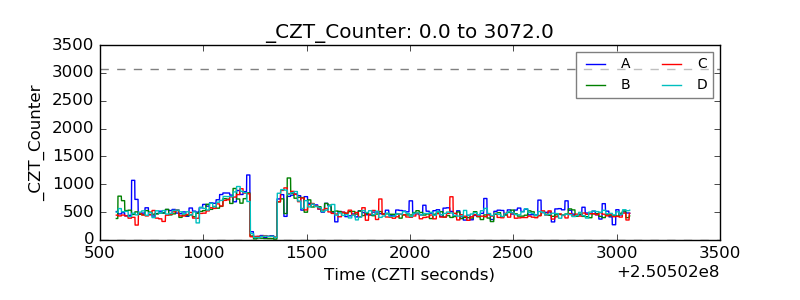 |
| +2.5 Volts monitor |  |
| +5 Volts monitor |  |
| _ROLL_ROT | 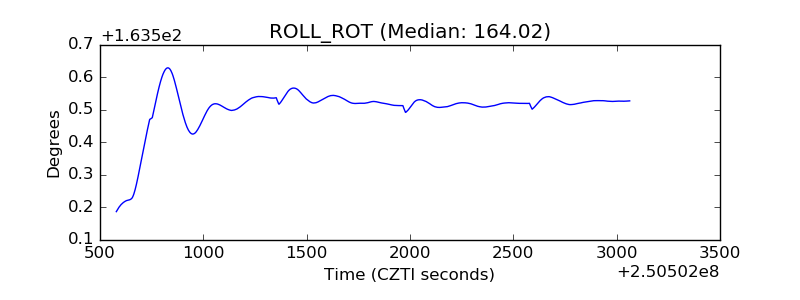 |
| _Roll_DEC | 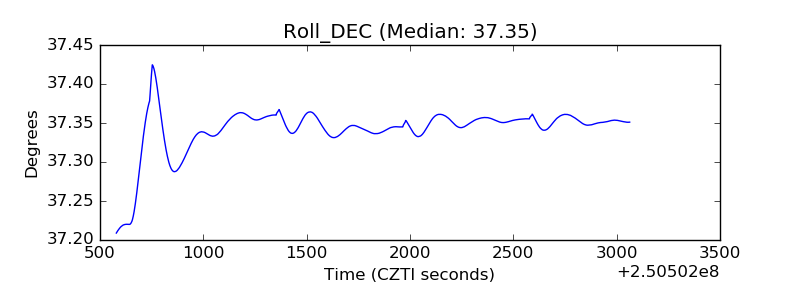 |
| _Roll_RA | 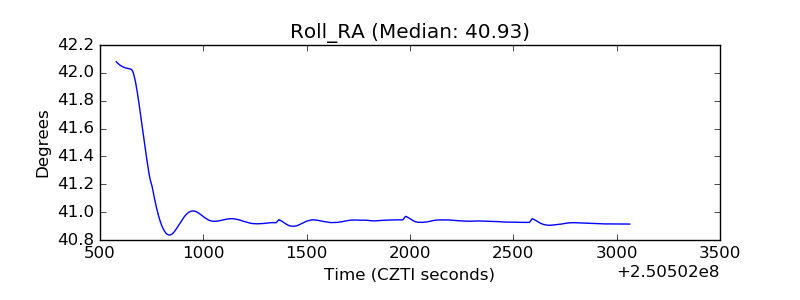 |
| Veto Counter | 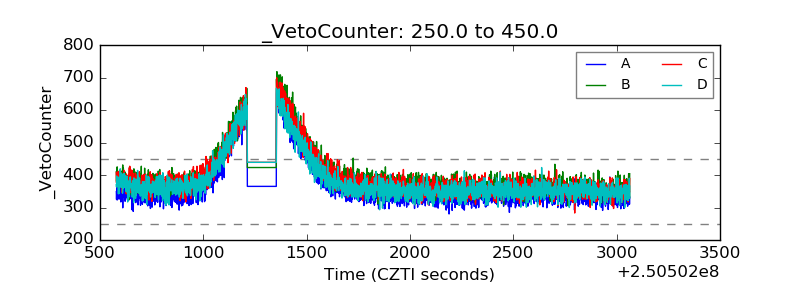 |