| Param | Original file | Final file |
|---|---|---|
| Filename | modeM0/AS1G08_083T04_9000001760_11889cztM0_level2.evt | modeM0/AS1G08_083T04_9000001760_11889cztM0_level2_quad_clean.evt |
| Size (bytes) | 288,072,000 | 41,463,360 |
| Size | 274.7 MB | 39.5 MB |
| Events in quadrant A | 2,242,876 | 243,245 |
| Events in quadrant B | 2,219,120 | 242,851 |
| Events in quadrant C | 1,769,035 | 248,171 |
| Events in quadrant D | 2,218,665 | 237,255 |
| Mode SS | |||
|---|---|---|---|
| Quadrant | BADHDUFLAG | Total packets | Discarded packets |
| A | 0 | 80 | 0 |
| B | 0 | 80 | 0 |
| C | 0 | 80 | 0 |
| D | 0 | 80 | 0 |
| Mode M0 | |||
|---|---|---|---|
| Quadrant | BADHDUFLAG | Total packets | Discarded packets |
| A | 0 | 9300 | 2 |
| B | 0 | 9242 | 1 |
| C | 0 | 8233 | 1 |
| D | 0 | 9054 | 1 |
| Quadrant | Total seconds | Saturated seconds | Saturation percentage |
|---|---|---|---|
| A | 4020 | 104 | 2.587065% |
| B | 4020 | 159 | 3.955224% |
| C | 4020 | 55 | 1.368159% |
| D | 4020 | 83 | 2.064677% |
Noise dominated data is calculated using 1-second bins in cleaned event files. If a bin has >2000 counts, and if more than 50% of those come from <1% of pixels, then it is considered to be noise-dominated and hence unusable.
| Quadrant | # 1 sec bins | Bins with >0 counts | Bins with >2000 counts | High rate bins dominated by noise | Noise dominated (total time) | Noise dominated (detector-on time) | Marked lightcurve |
|---|---|---|---|---|---|---|---|
| A | 4021 | 4021 | 1 | 1 | 0.02% | 0.02% | 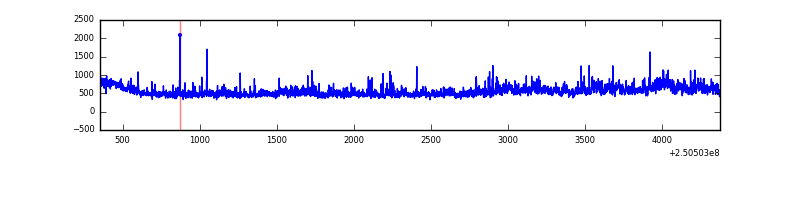 |
| B | 4021 | 4021 | 35 | 35 | 0.87% | 0.87% | 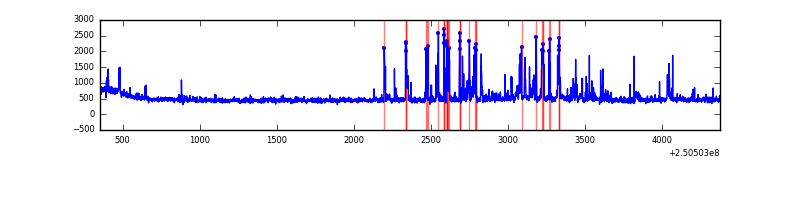 |
| C | 4021 | 4021 | 0 | 0 | 0.00% | 0.00% | 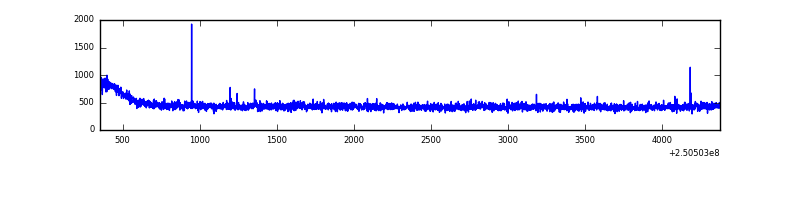 |
| D | 4021 | 4021 | 21 | 21 | 0.52% | 0.52% | 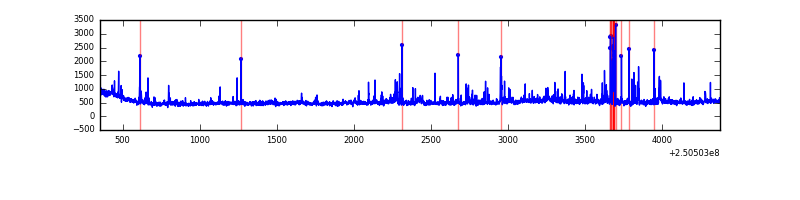 |
Top three noisy pixels from each quadrant. If the there are fewer than three noisy pixels in the level2.evt file, extra rows are filled as -1
| Pixel properties | Quadrant properties | ||||||
|---|---|---|---|---|---|---|---|
| Quadrant | DetID | PixID | Counts | Sigma | Mean | Median | Sigma |
| A | 8 | 15 | 242819 | 2501.38 | 463 | 451 | 96.9 |
| A | 1 | 162 | 85628 | 879.08 | 463 | 451 | 96.9 |
| A | 1 | 178 | 45142 | 461.24 | 463 | 451 | 96.9 |
| B | 4 | 239 | 299870 | 3358.47 | 459 | 448 | 89.2 |
| B | 15 | 204 | 38411 | 425.81 | 459 | 448 | 89.2 |
| B | 3 | 209 | 24596 | 270.85 | 459 | 448 | 89.2 |
| C | 8 | 128 | 4731 | 40.54 | 451 | 452 | 105.5 |
| C | 13 | 61 | 3384 | 27.78 | 451 | 452 | 105.5 |
| C | 12 | 4 | 3375 | 27.7 | 451 | 452 | 105.5 |
| D | 8 | 195 | 234312 | 2120.0 | 449 | 434 | 110.3 |
| D | 10 | 199 | 47625 | 427.76 | 449 | 434 | 110.3 |
| D | 13 | 249 | 44967 | 403.67 | 449 | 434 | 110.3 |
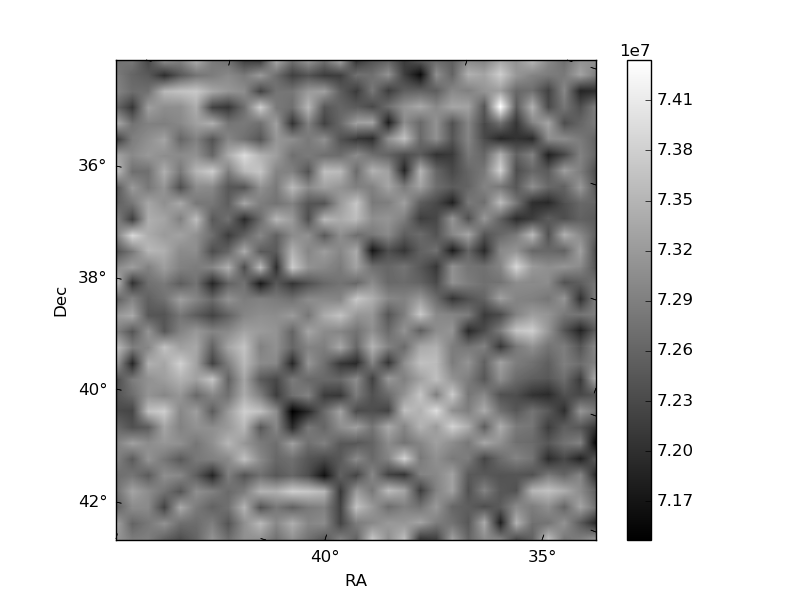
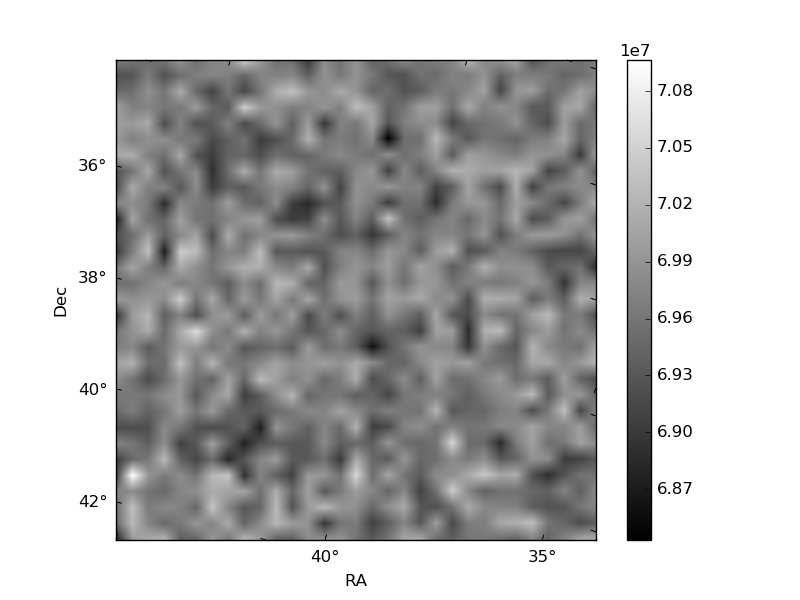
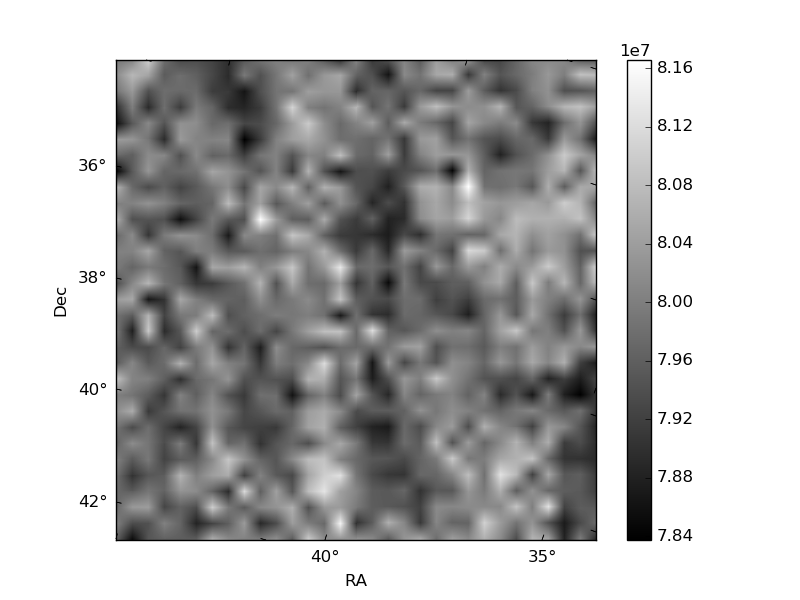
Histogram calculated using DETX and DETY for each event in the final _common_clean file
| Quadrant A | 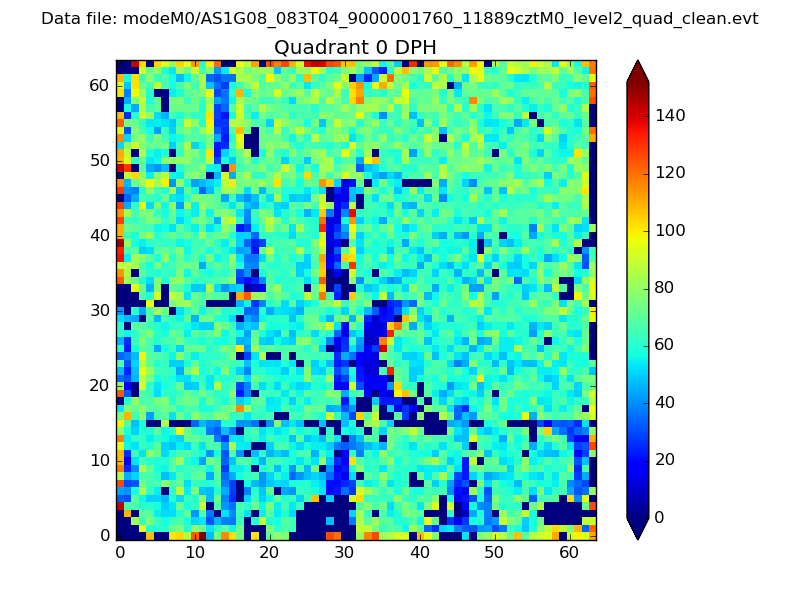 |
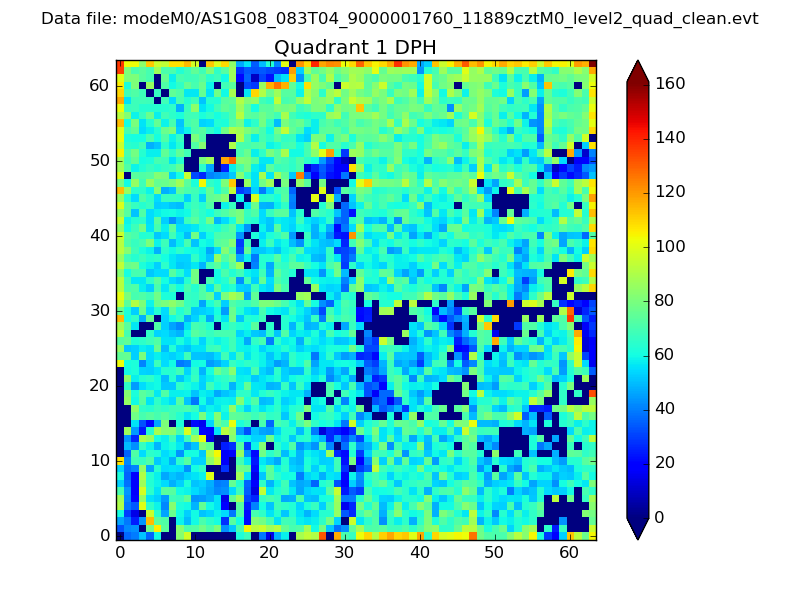 |
Quadrant B |
|---|---|---|---|
| Quadrant D | 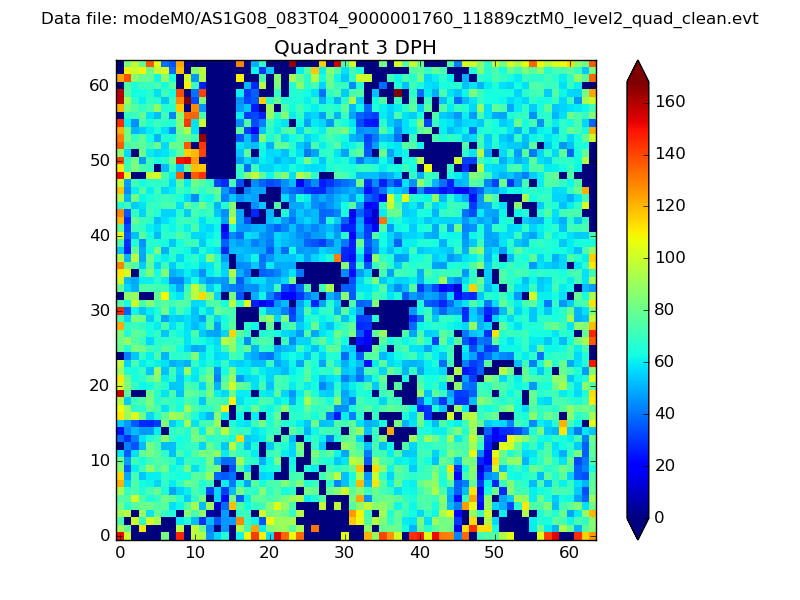 |
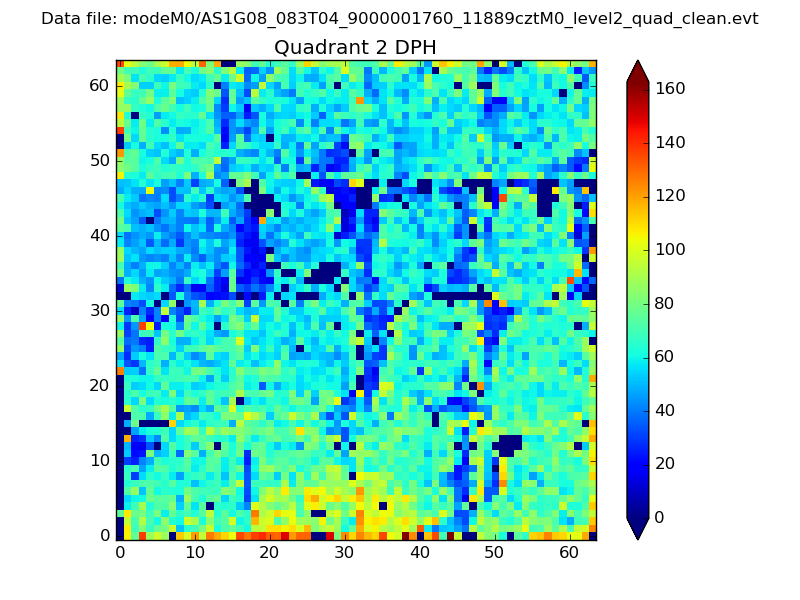 |
Quadrant C |
| Plot type | Count rate plots | Images |
|---|---|---|
| Comparison with Poisson distribution Blue bars denote a histogram of data divided into 1 sec bins. Red curve is a Poisson curve with rate = median count rate of data. |
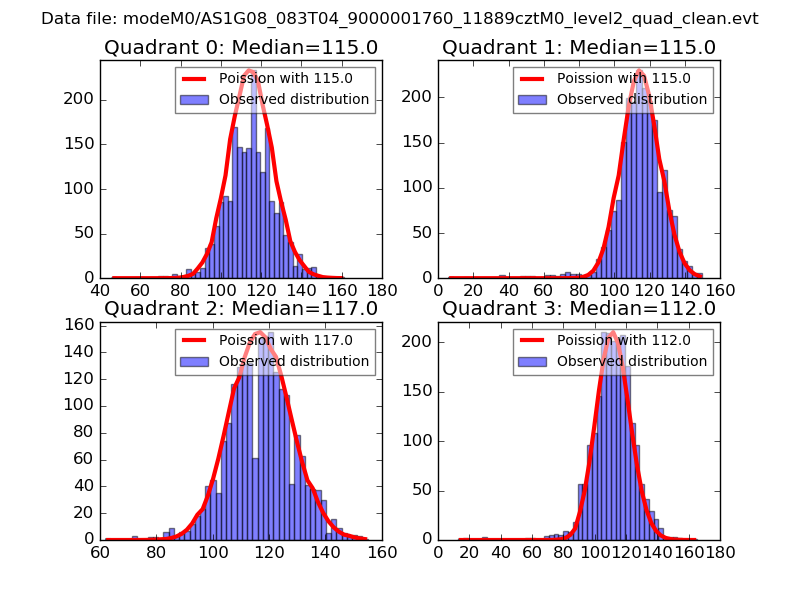 |
 |
| Quadrant-wise count rates Data is divided into 100 sec bins |
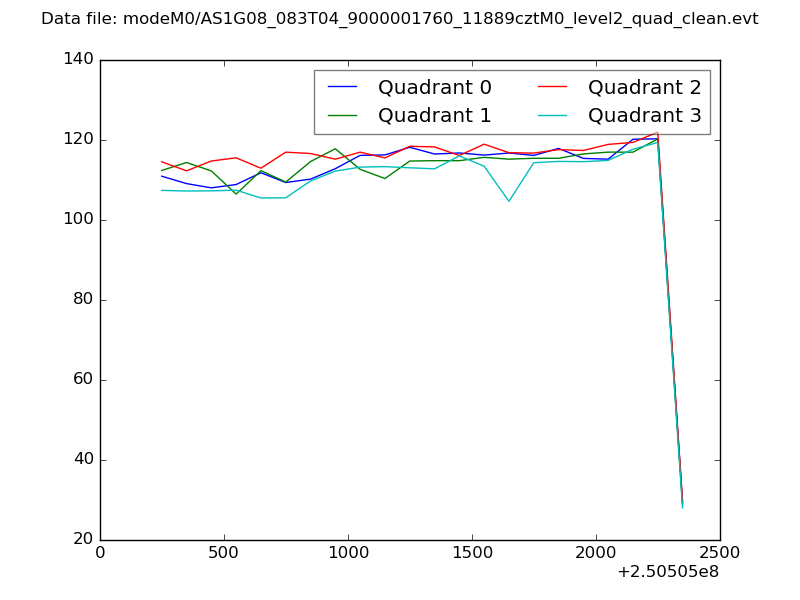 |
|
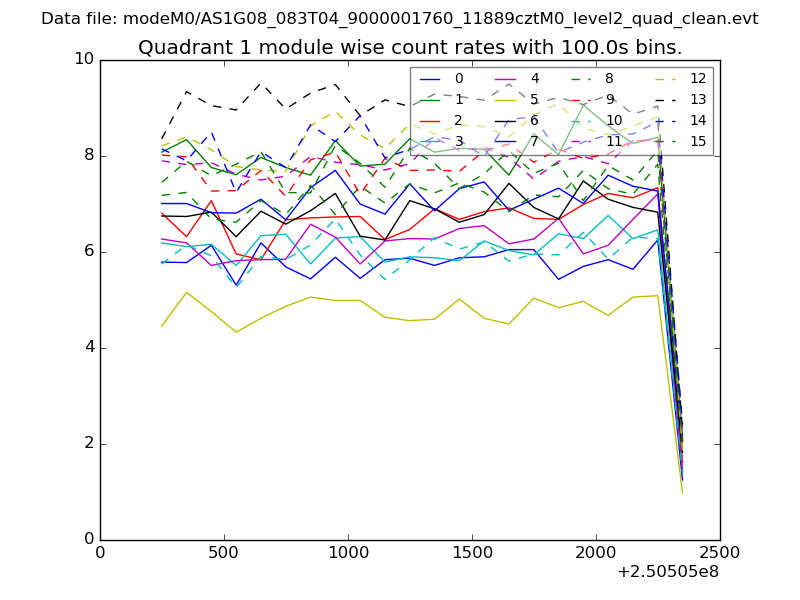
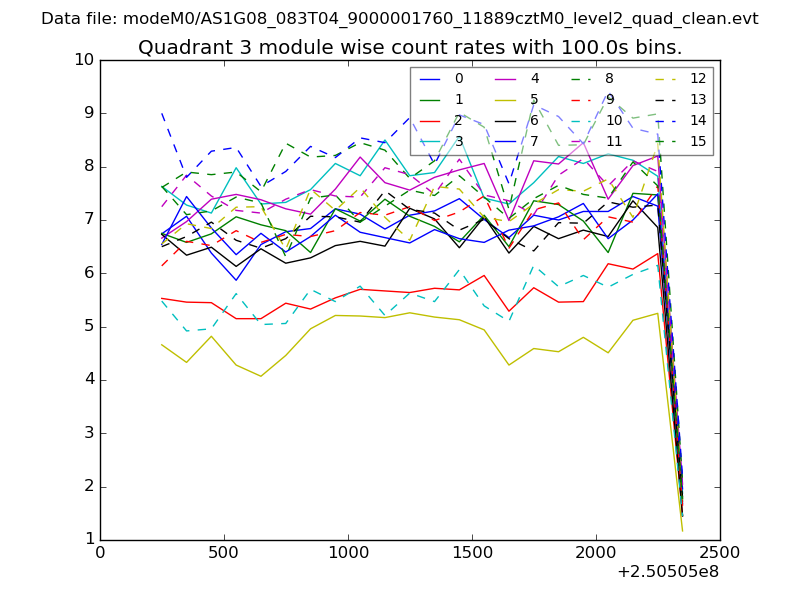
| Module-wise count rates for Quadrant A Data is divided into 100 sec bins |
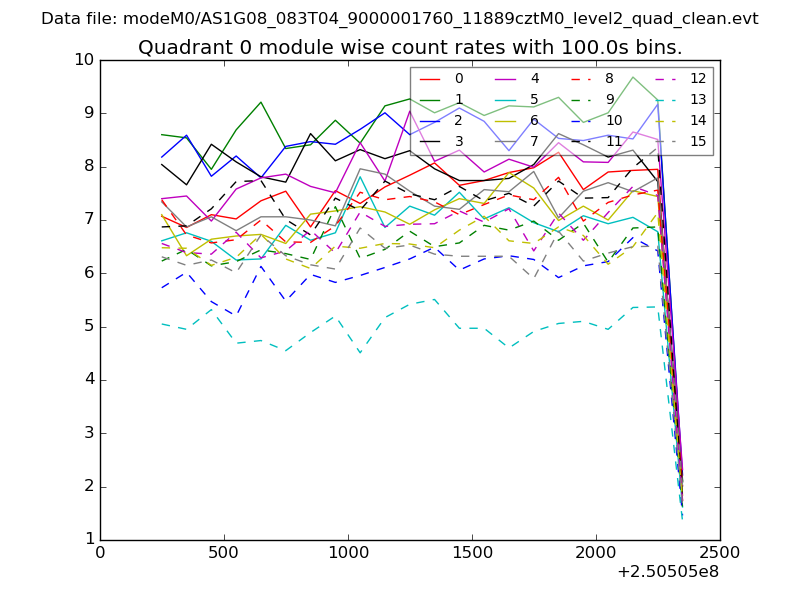 |
 |
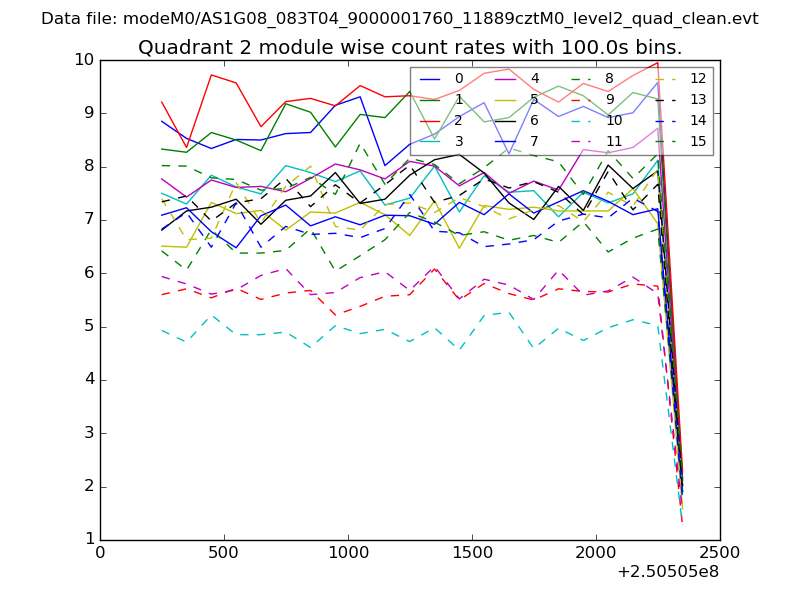
| Module-wise count rates for Quadrant B Data is divided into 100 sec bins |
 |
 |
| Module-wise count rates for Quadrant C Data is divided into 100 sec bins |
 |
 |
| Module-wise count rates for Quadrant D Data is divided into 100 sec bins |
 |
 |
| Parameter | Plot |
|---|---|
| CZT HV Monitor | 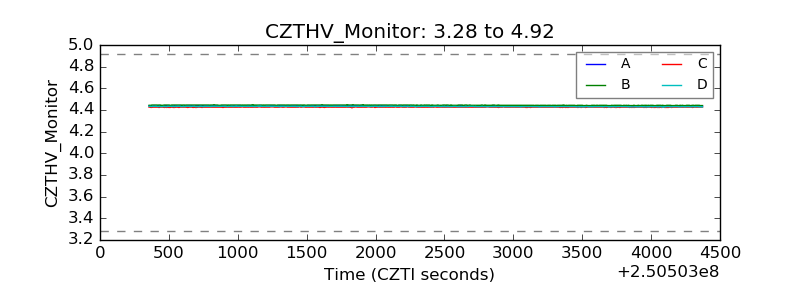 |
| D_VDD |  |
| Temperature 1 | 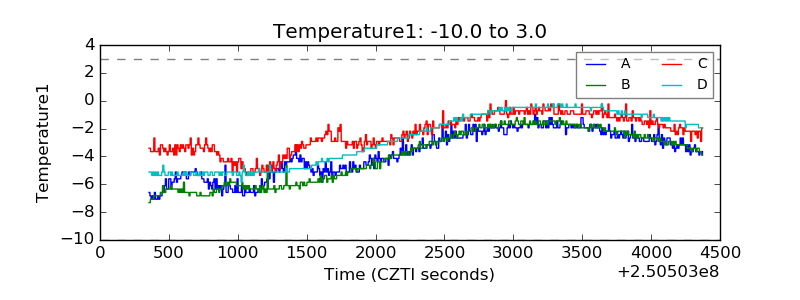 |
| Veto HV Monitor | 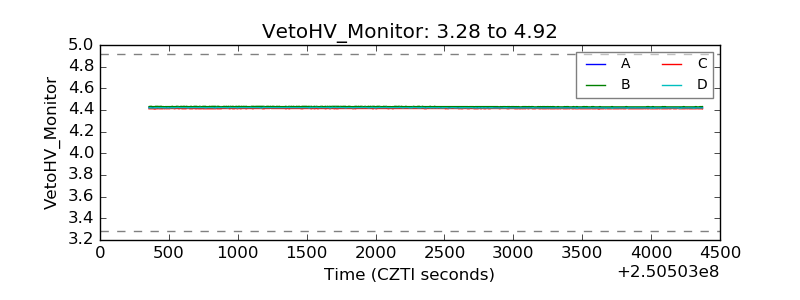 |
| Veto LLD | 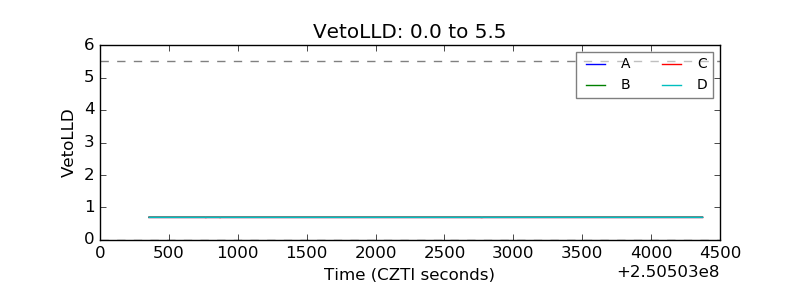 |
| Alpha Counter | 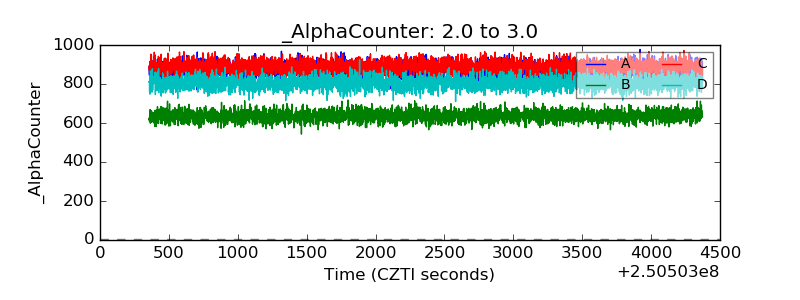 |
| _CPM_Rate | 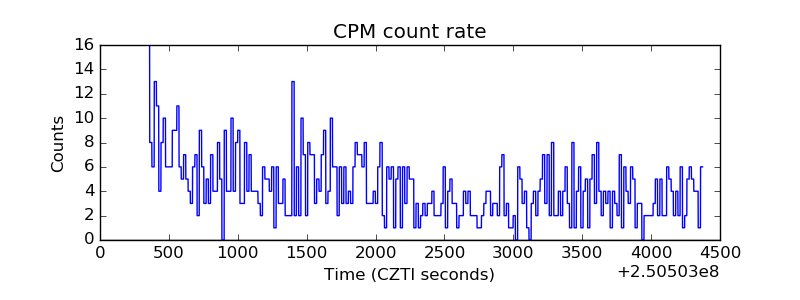 |
| CZT Counter | 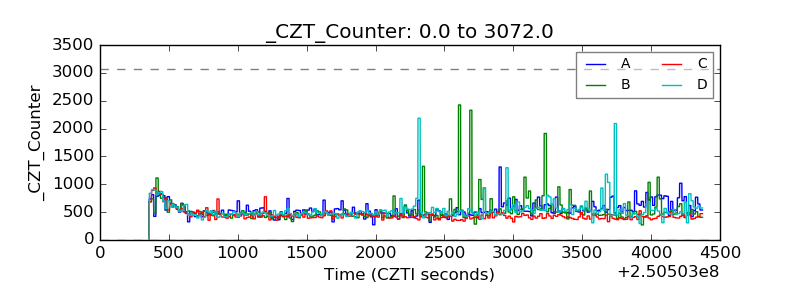 |
| +2.5 Volts monitor |  |
| +5 Volts monitor | 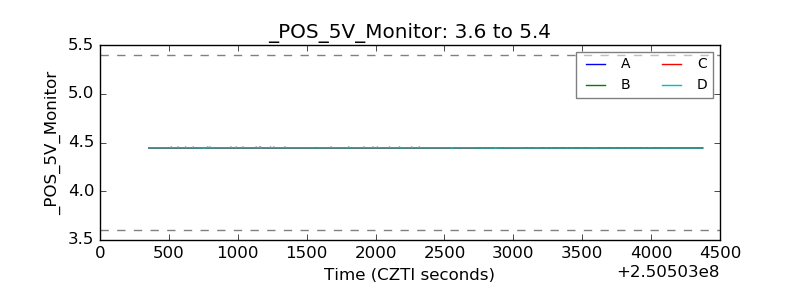 |
| _ROLL_ROT | 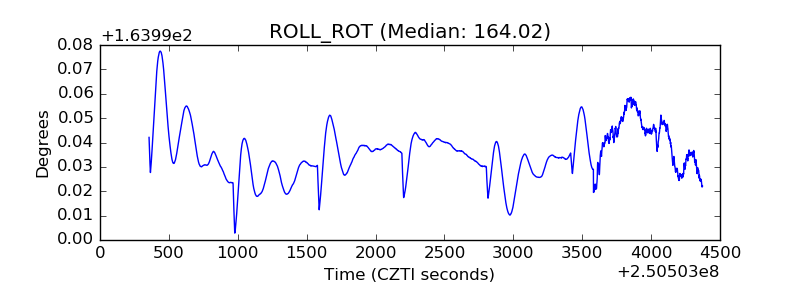 |
| _Roll_DEC | 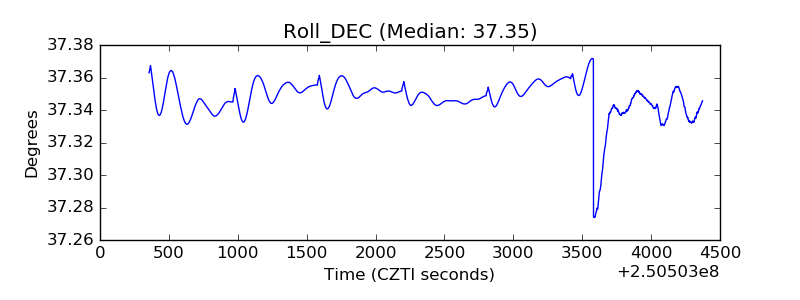 |
| _Roll_RA |  |
| Veto Counter | 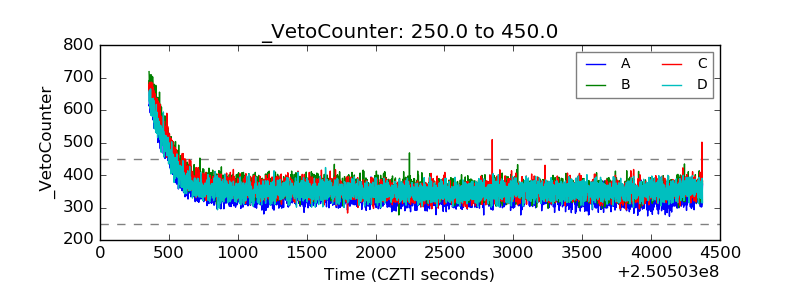 |