| Param | Original file | Final file |
|---|---|---|
| Filename | modeM0/AS1G08_083T04_9000001760_11892cztM0_level2.evt | modeM0/AS1G08_083T04_9000001760_11892cztM0_level2_quad_clean.evt |
| Size (bytes) | 891,771,840 | 161,208,000 |
| Size | 850.5 MB | 153.7 MB |
| Events in quadrant A | 6,331,299 | 1,027,326 |
| Events in quadrant B | 7,667,905 | 1,017,141 |
| Events in quadrant C | 5,047,410 | 1,052,947 |
| Events in quadrant D | 7,191,557 | 997,905 |
| Mode SS | |||
|---|---|---|---|
| Quadrant | BADHDUFLAG | Total packets | Discarded packets |
| A | 0 | 232 | 0 |
| B | 0 | 232 | 0 |
| C | 0 | 232 | 0 |
| D | 0 | 232 | 0 |
| Mode M0 | |||
|---|---|---|---|
| Quadrant | BADHDUFLAG | Total packets | Discarded packets |
| A | 0 | 26158 | 3 |
| B | 0 | 30262 | 2 |
| C | 0 | 23061 | 2 |
| D | 0 | 28557 | 2 |
| Mode M9 | |||
|---|---|---|---|
| Quadrant | BADHDUFLAG | Total packets | Discarded packets |
| A | 0 | 14 | 0 |
| B | 0 | 14 | 0 |
| C | 0 | 14 | 0 |
| D | 0 | 14 | 0 |
| Quadrant | Total seconds | Saturated seconds | Saturation percentage |
|---|---|---|---|
| A | 11366 | 311 | 2.736231% |
| B | 11366 | 538 | 4.733415% |
| C | 11366 | 73 | 0.642266% |
| D | 11366 | 365 | 3.211332% |
Noise dominated data is calculated using 1-second bins in cleaned event files. If a bin has >2000 counts, and if more than 50% of those come from <1% of pixels, then it is considered to be noise-dominated and hence unusable.
| Quadrant | # 1 sec bins | Bins with >0 counts | Bins with >2000 counts | High rate bins dominated by noise | Noise dominated (total time) | Noise dominated (detector-on time) | Marked lightcurve |
|---|---|---|---|---|---|---|---|
| A | 12902 | 11369 | 167 | 167 | 1.29% | 1.47% | 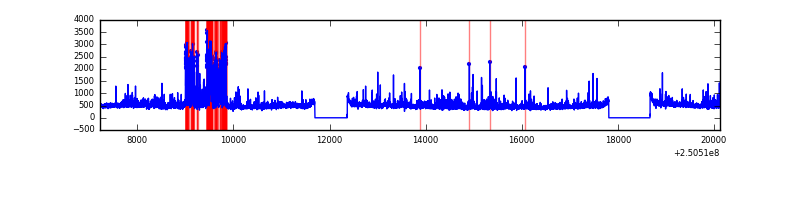 |
| B | 12902 | 11369 | 291 | 291 | 2.26% | 2.56% | 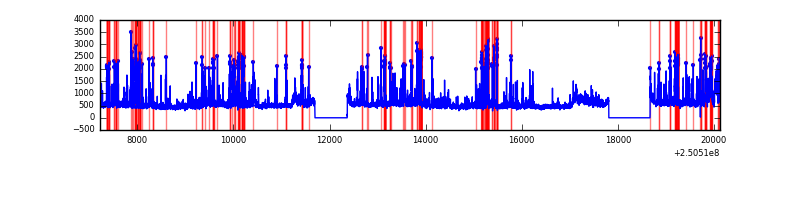 |
| C | 12902 | 11369 | 0 | 0 | 0.00% | 0.00% | 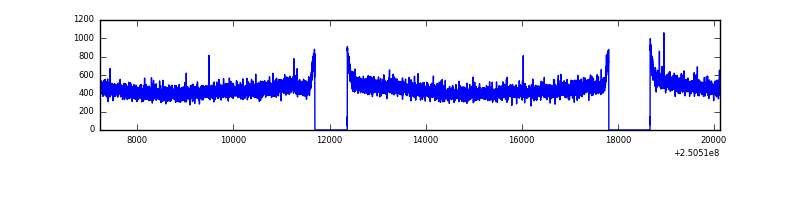 |
| D | 12902 | 11369 | 241 | 241 | 1.87% | 2.12% | 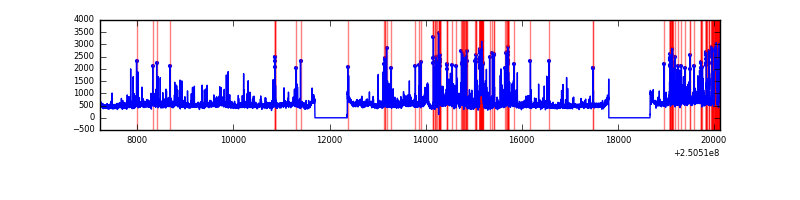 |
Top three noisy pixels from each quadrant. If the there are fewer than three noisy pixels in the level2.evt file, extra rows are filled as -1
| Pixel properties | Quadrant properties | ||||||
|---|---|---|---|---|---|---|---|
| Quadrant | DetID | PixID | Counts | Sigma | Mean | Median | Sigma |
| A | 7 | 144 | 648338 | 2394.18 | 1313 | 1281 | 270.3 |
| A | 1 | 162 | 182534 | 670.66 | 1313 | 1281 | 270.3 |
| A | 8 | 15 | 122015 | 446.73 | 1313 | 1281 | 270.3 |
| B | 4 | 239 | 1453870 | 5852.38 | 1303 | 1268 | 248.2 |
| B | 3 | 64 | 446888 | 1795.36 | 1303 | 1268 | 248.2 |
| B | 15 | 204 | 274414 | 1100.48 | 1303 | 1268 | 248.2 |
| C | 13 | 61 | 9590 | 27.5 | 1294 | 1300 | 301.4 |
| C | 3 | 202 | 3283 | 6.58 | 1294 | 1300 | 301.4 |
| C | 12 | 4 | 3203 | 6.31 | 1294 | 1300 | 301.4 |
| D | 1 | 52 | 952809 | 2857.83 | 1270 | 1246 | 333.0 |
| D | 8 | 195 | 704244 | 2111.32 | 1270 | 1246 | 333.0 |
| D | 7 | 71 | 168103 | 501.12 | 1270 | 1246 | 333.0 |
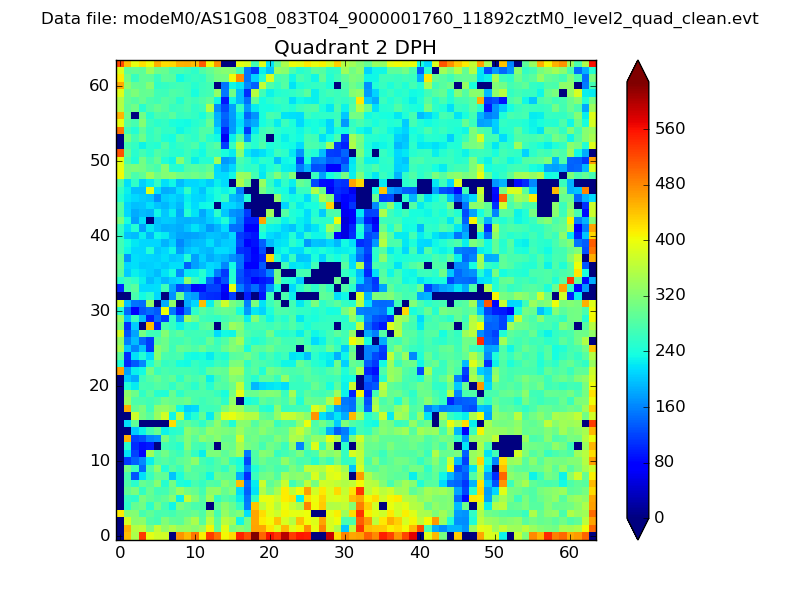
Histogram calculated using DETX and DETY for each event in the final _common_clean file
| Quadrant A | 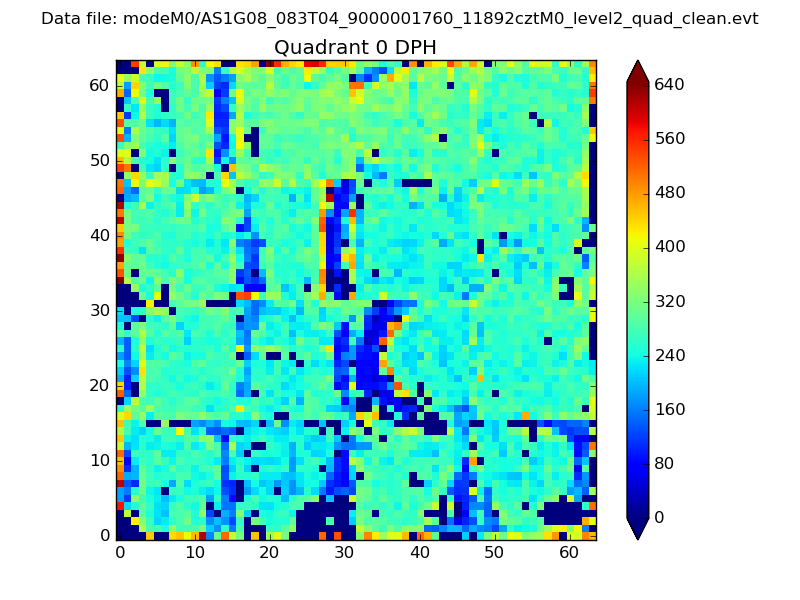 |
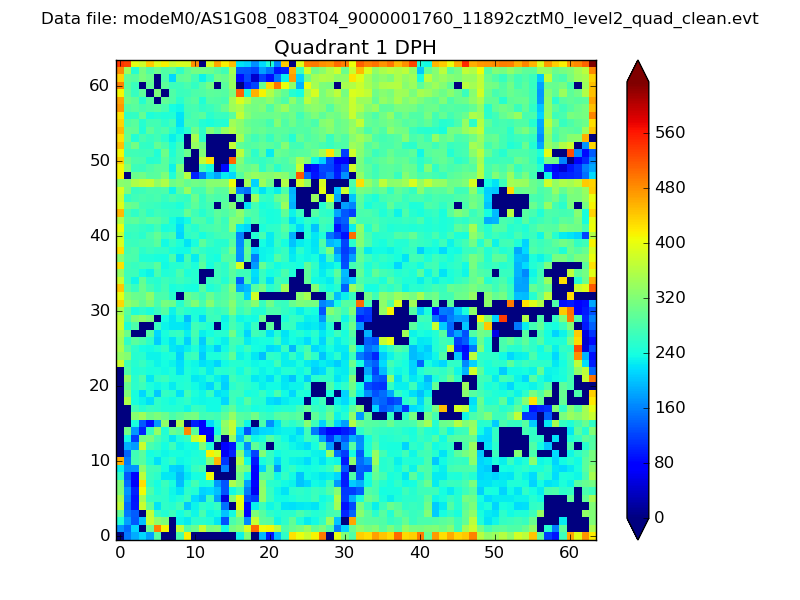 |
Quadrant B |
|---|---|---|---|
| Quadrant D | 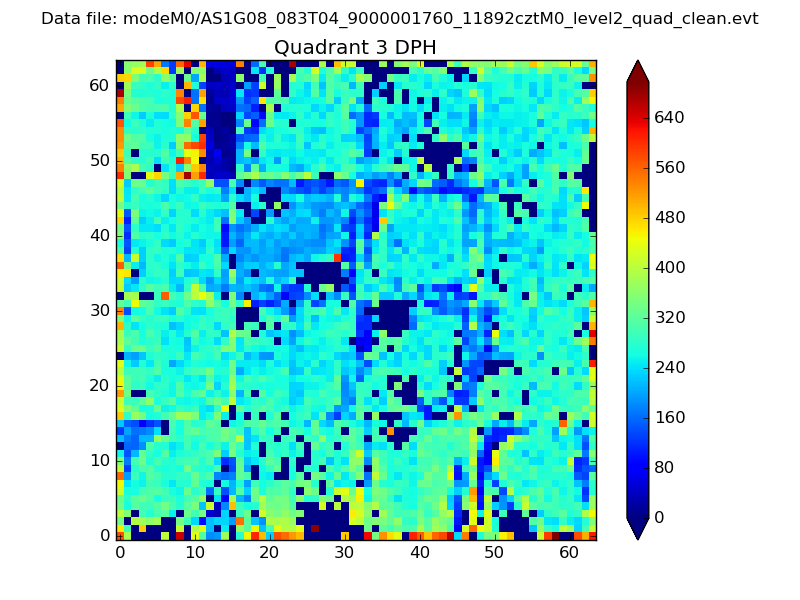 |
 |
Quadrant C |
| Plot type | Count rate plots | Images |
|---|---|---|
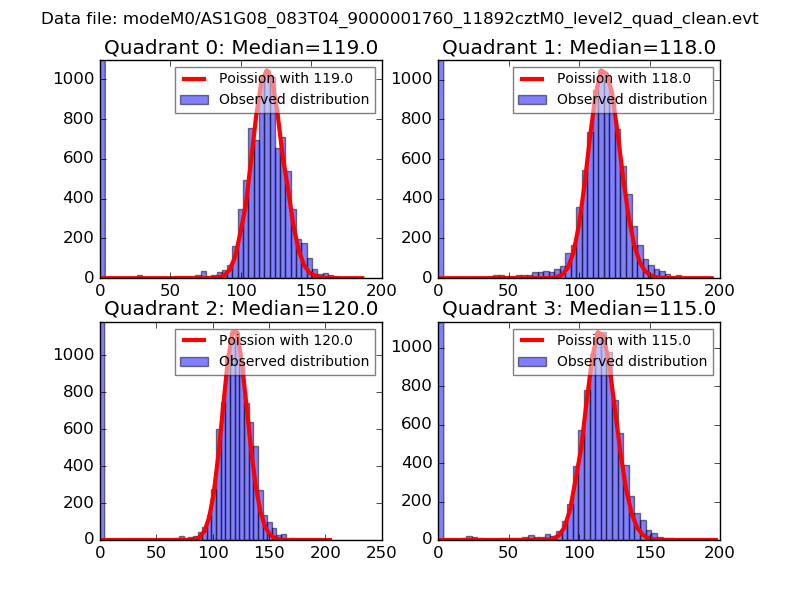
| Comparison with Poisson distribution Blue bars denote a histogram of data divided into 1 sec bins. Red curve is a Poisson curve with rate = median count rate of data. |
 |
 |
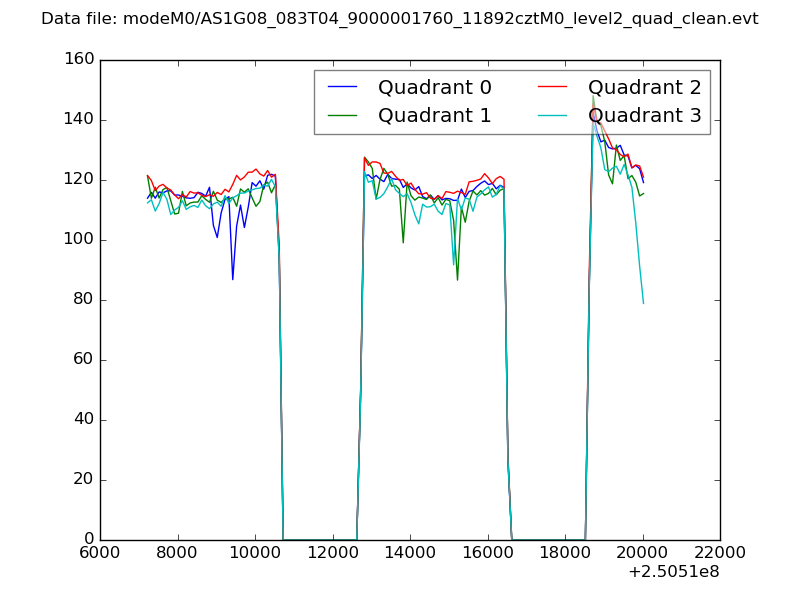
| Quadrant-wise count rates Data is divided into 100 sec bins |
 |
|
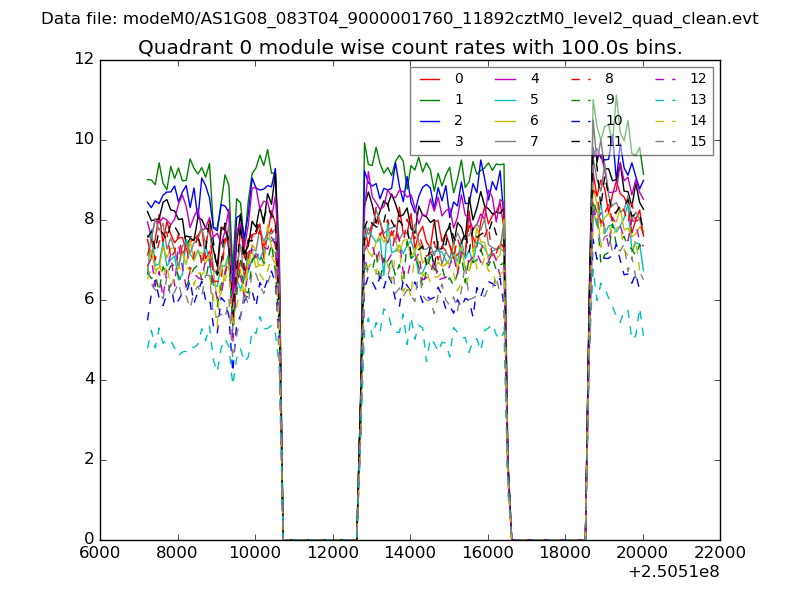
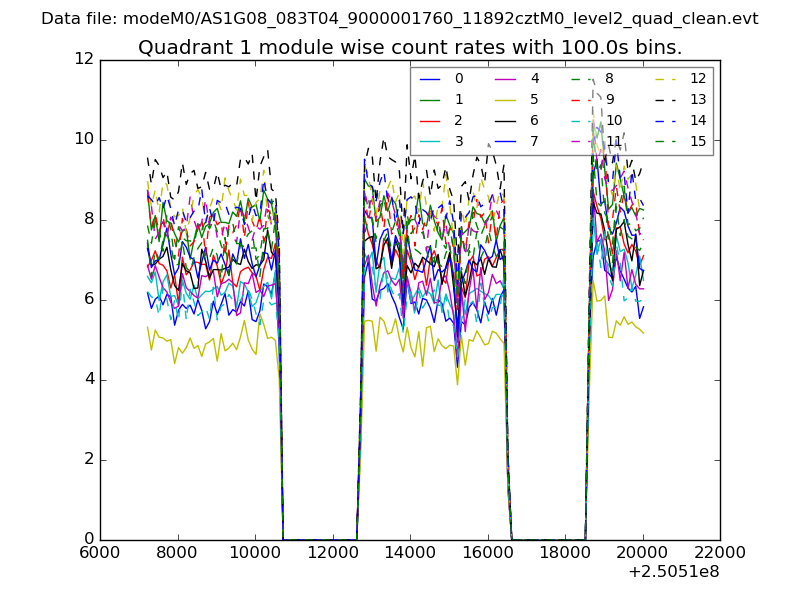
| Module-wise count rates for Quadrant A Data is divided into 100 sec bins |
 |
 |
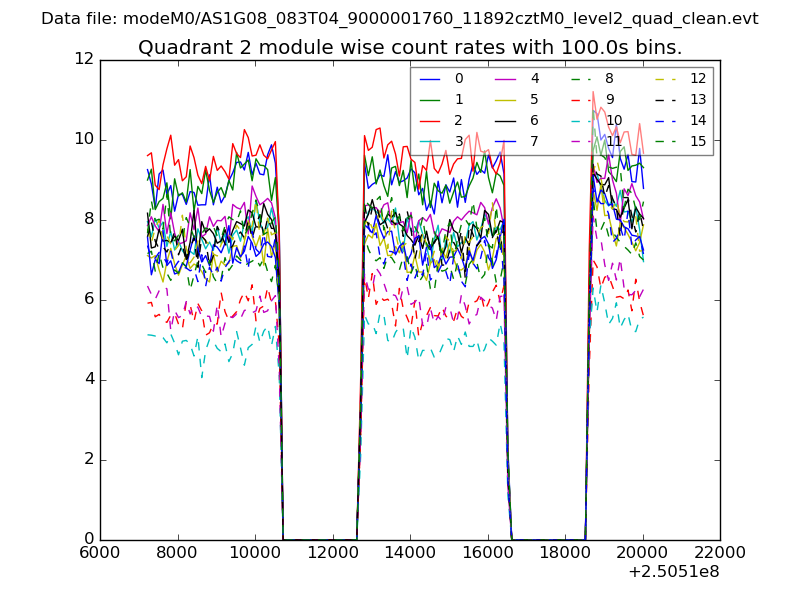
| Module-wise count rates for Quadrant B Data is divided into 100 sec bins |
 |
 |
| Module-wise count rates for Quadrant C Data is divided into 100 sec bins |
 |
 |
| Module-wise count rates for Quadrant D Data is divided into 100 sec bins |
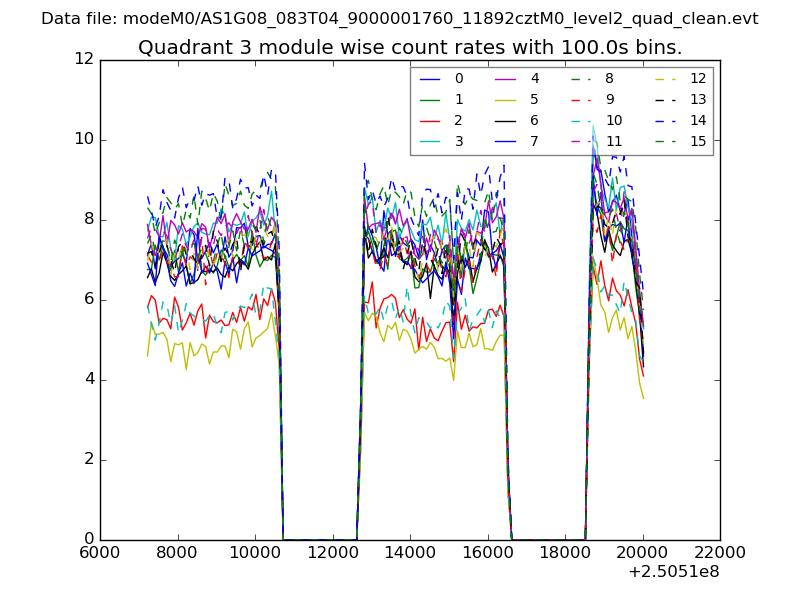 |
 |
| Parameter | Plot |
|---|---|
| CZT HV Monitor | 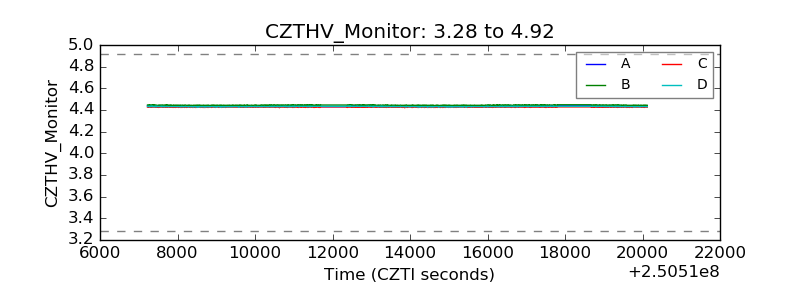 |
| D_VDD | 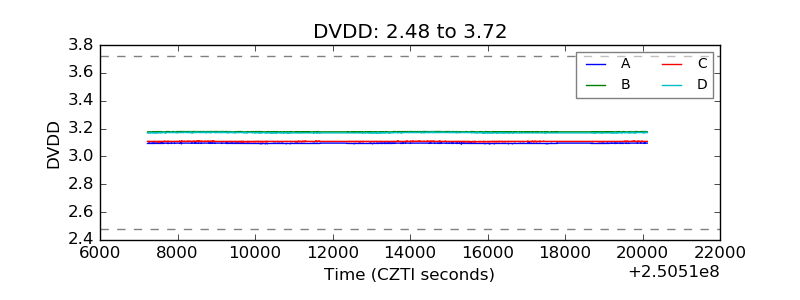 |
| Temperature 1 | 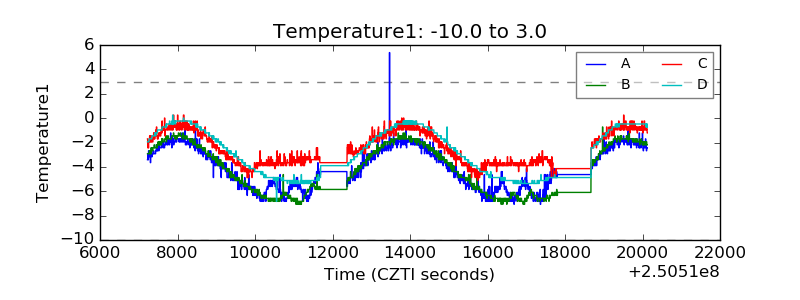 |
| Veto HV Monitor | 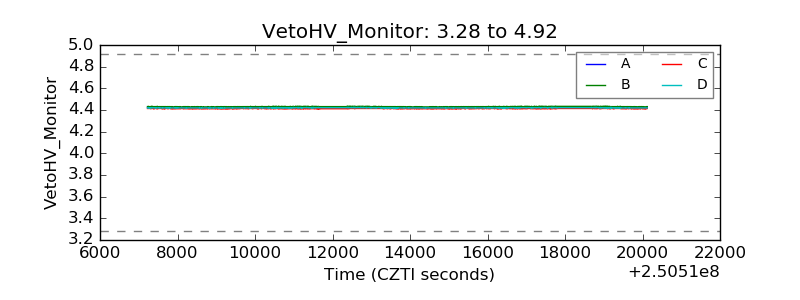 |
| Veto LLD | 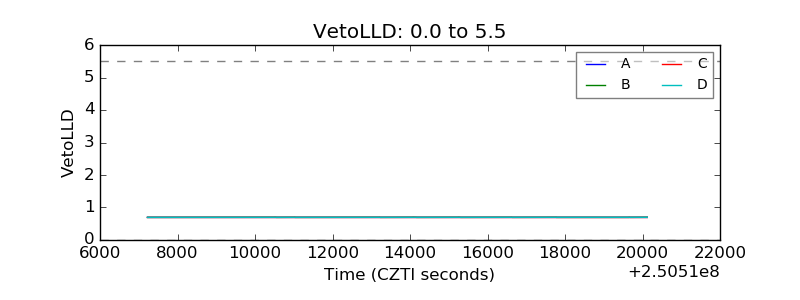 |
| Alpha Counter | 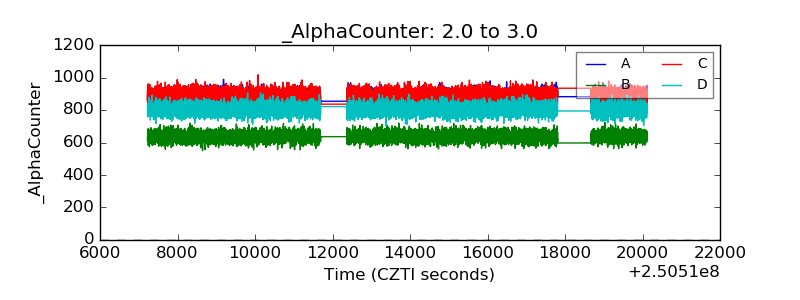 |
| _CPM_Rate | 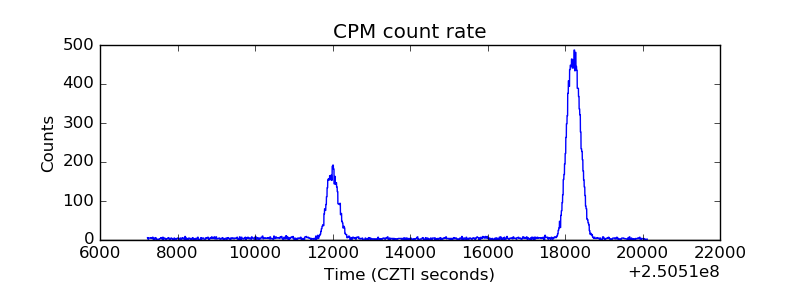 |
| CZT Counter | 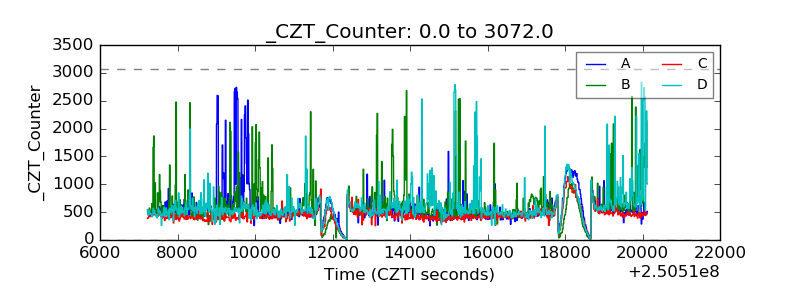 |
| +2.5 Volts monitor |  |
| +5 Volts monitor |  |
| _ROLL_ROT | 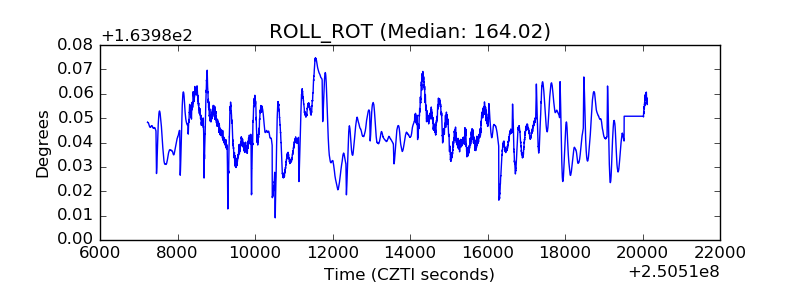 |
| _Roll_DEC | 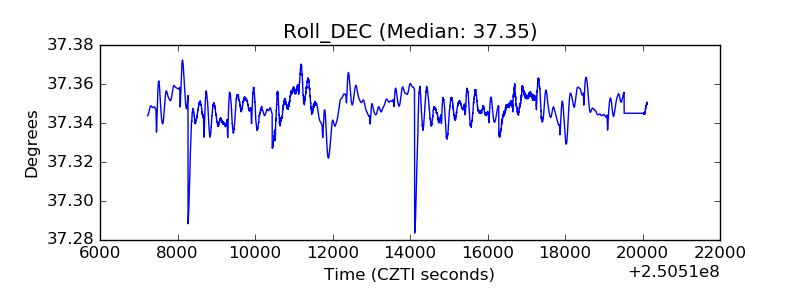 |
| _Roll_RA | 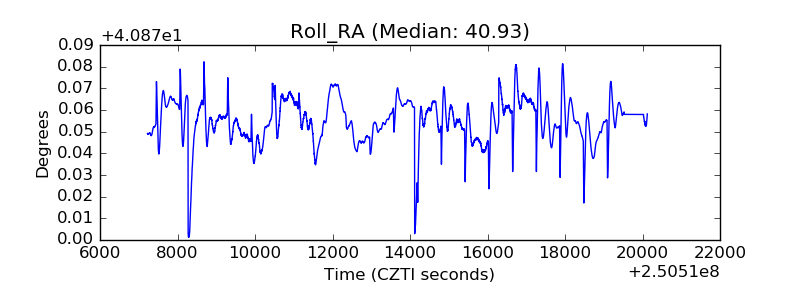 |
| Veto Counter | 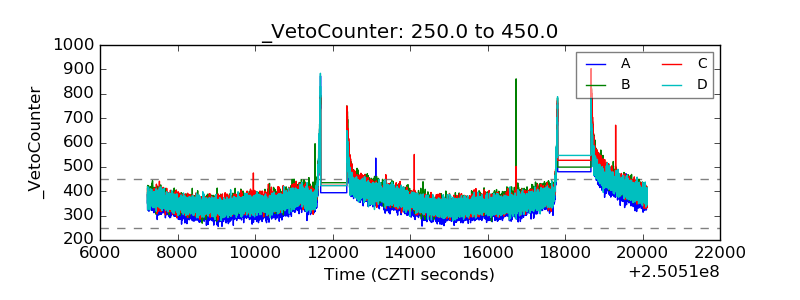 |