| Param | Original file | Final file |
|---|---|---|
| Filename | modeM0/AS1G08_083T04_9000001760_11895cztM0_level2.evt | modeM0/AS1G08_083T04_9000001760_11895cztM0_level2_quad_clean.evt |
| Size (bytes) | 142,966,080 | 30,646,080 |
| Size | 136.3 MB | 29.2 MB |
| Events in quadrant A | 966,057 | 207,096 |
| Events in quadrant B | 1,312,543 | 202,118 |
| Events in quadrant C | 800,676 | 206,791 |
| Events in quadrant D | 1,143,661 | 198,055 |
| Mode SS | |||
|---|---|---|---|
| Quadrant | BADHDUFLAG | Total packets | Discarded packets |
| A | 0 | 32 | 0 |
| B | 0 | 32 | 0 |
| C | 0 | 32 | 0 |
| D | 0 | 32 | 0 |
| Mode M0 | |||
|---|---|---|---|
| Quadrant | BADHDUFLAG | Total packets | Discarded packets |
| A | 0 | 3911 | 1 |
| B | 0 | 4999 | 1 |
| C | 0 | 3322 | 1 |
| D | 0 | 4573 | 1 |
| Mode M9 | |||
|---|---|---|---|
| Quadrant | BADHDUFLAG | Total packets | Discarded packets |
| A | 0 | 10 | 0 |
| B | 0 | 10 | 0 |
| C | 0 | 10 | 0 |
| D | 0 | 10 | 0 |
| Quadrant | Total seconds | Saturated seconds | Saturation percentage |
|---|---|---|---|
| A | 1539 | 78 | 5.068226% |
| B | 1539 | 155 | 10.071475% |
| C | 1539 | 54 | 3.508772% |
| D | 1539 | 101 | 6.562703% |
Noise dominated data is calculated using 1-second bins in cleaned event files. If a bin has >2000 counts, and if more than 50% of those come from <1% of pixels, then it is considered to be noise-dominated and hence unusable.
| Quadrant | # 1 sec bins | Bins with >0 counts | Bins with >2000 counts | High rate bins dominated by noise | Noise dominated (total time) | Noise dominated (detector-on time) | Marked lightcurve |
|---|---|---|---|---|---|---|---|
| A | 2535 | 1541 | 3 | 3 | 0.12% | 0.19% | 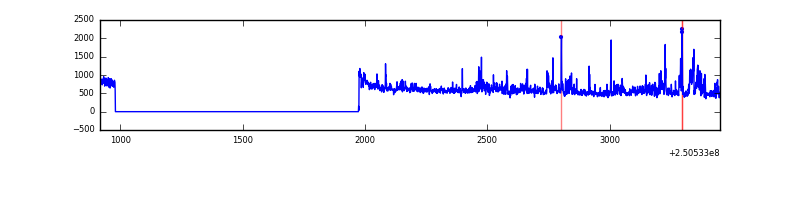 |
| B | 2535 | 1541 | 58 | 58 | 2.29% | 3.76% | 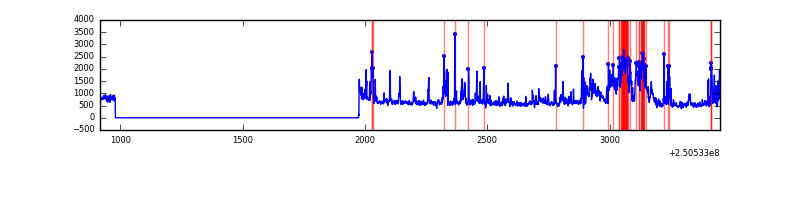 |
| C | 2535 | 1541 | 0 | 0 | 0.00% | 0.00% | 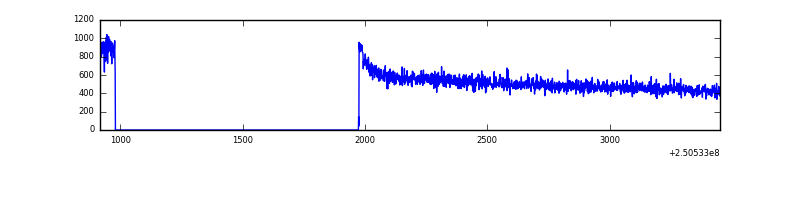 |
| D | 2535 | 1541 | 26 | 26 | 1.03% | 1.69% | 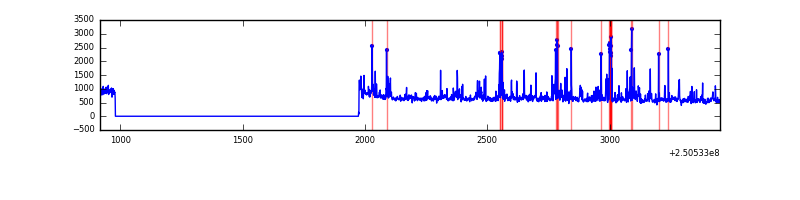 |
Top three noisy pixels from each quadrant. If the there are fewer than three noisy pixels in the level2.evt file, extra rows are filled as -1
| Pixel properties | Quadrant properties | ||||||
|---|---|---|---|---|---|---|---|
| Quadrant | DetID | PixID | Counts | Sigma | Mean | Median | Sigma |
| A | 7 | 144 | 54332 | 1214.34 | 211 | 206 | 44.6 |
| A | 1 | 162 | 36908 | 823.42 | 211 | 206 | 44.6 |
| A | 1 | 178 | 20772 | 461.41 | 211 | 206 | 44.6 |
| B | 3 | 64 | 247378 | 6038.06 | 204 | 199 | 40.9 |
| B | 4 | 239 | 202093 | 4931.85 | 204 | 199 | 40.9 |
| B | 15 | 204 | 45120 | 1097.33 | 204 | 199 | 40.9 |
| C | 13 | 61 | 1457 | 25.35 | 205 | 205 | 49.4 |
| C | 3 | 202 | 533 | 6.64 | 205 | 205 | 49.4 |
| C | 3 | 203 | 467 | 5.31 | 205 | 205 | 49.4 |
| D | 8 | 195 | 147297 | 2693.5 | 205 | 200 | 54.6 |
| D | 12 | 233 | 74885 | 1367.56 | 205 | 200 | 54.6 |
| D | 7 | 71 | 35104 | 639.13 | 205 | 200 | 54.6 |
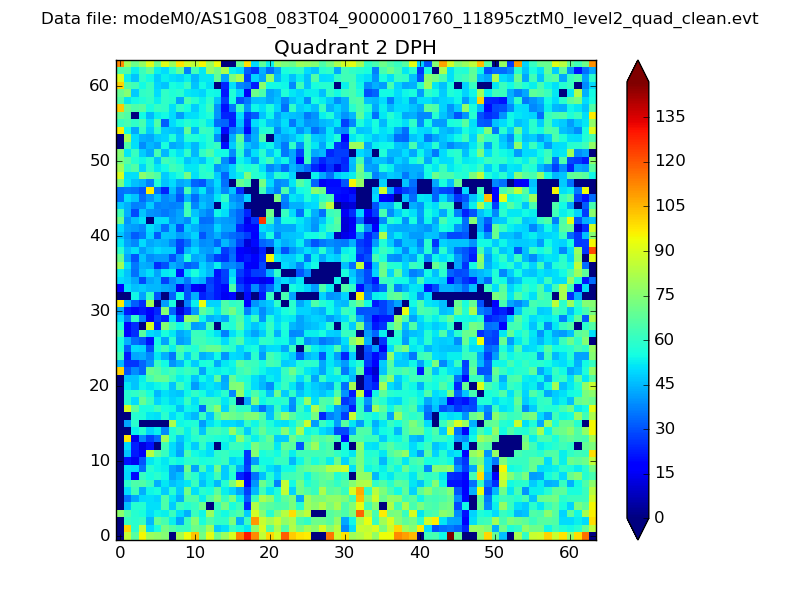
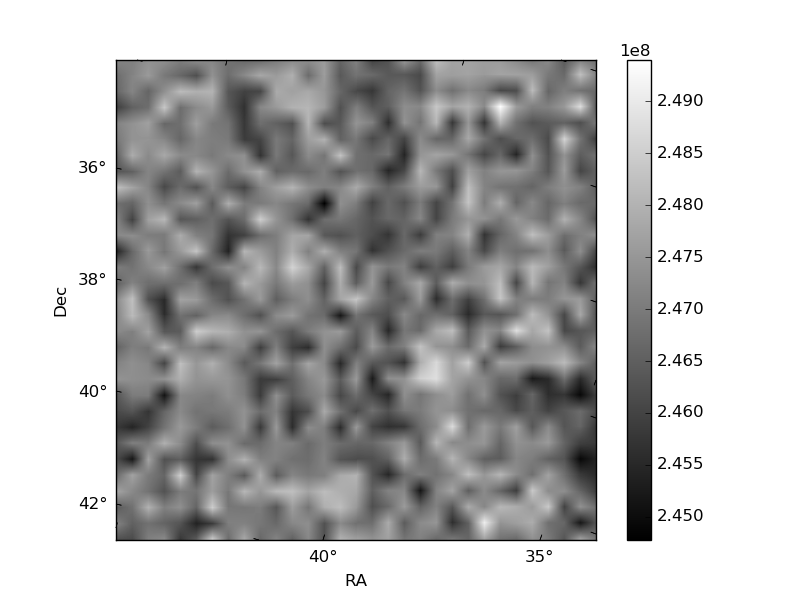
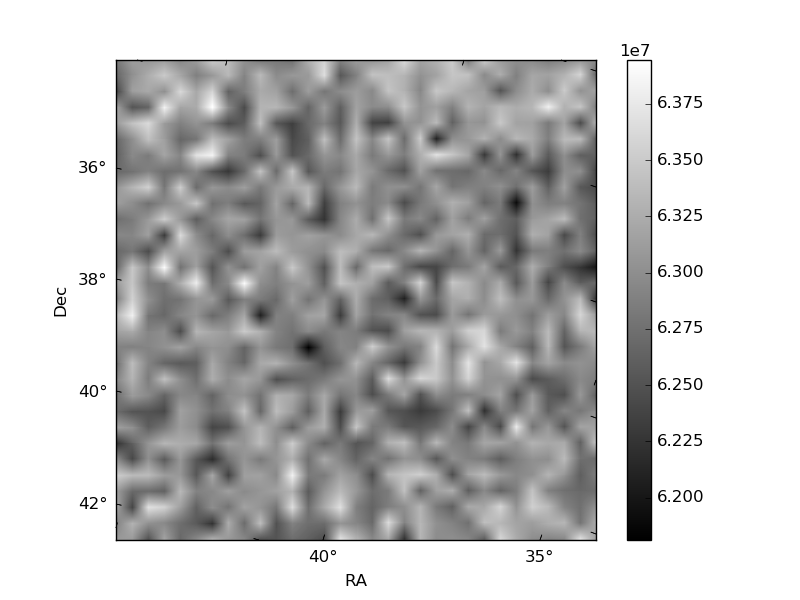
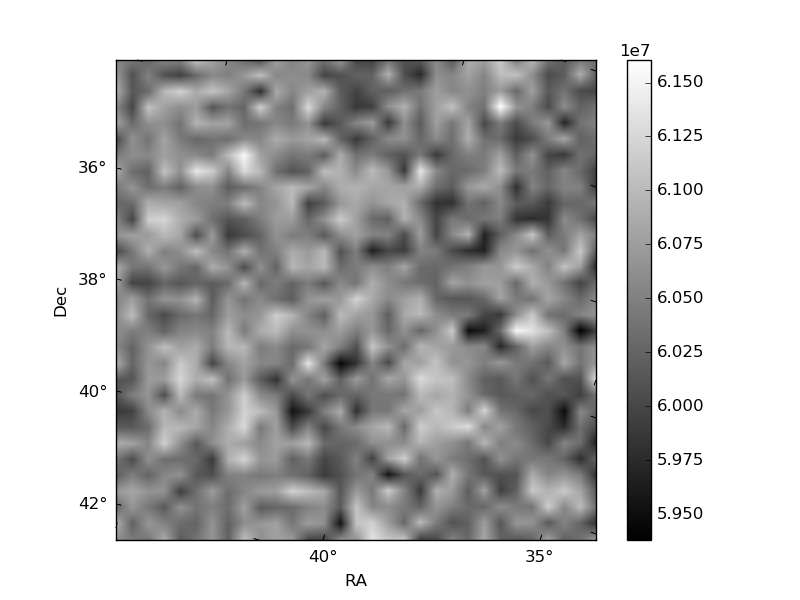
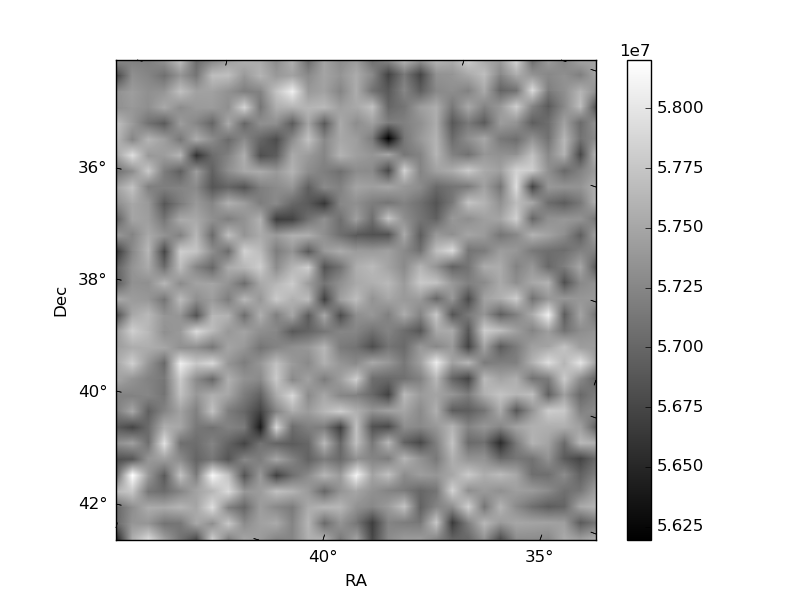
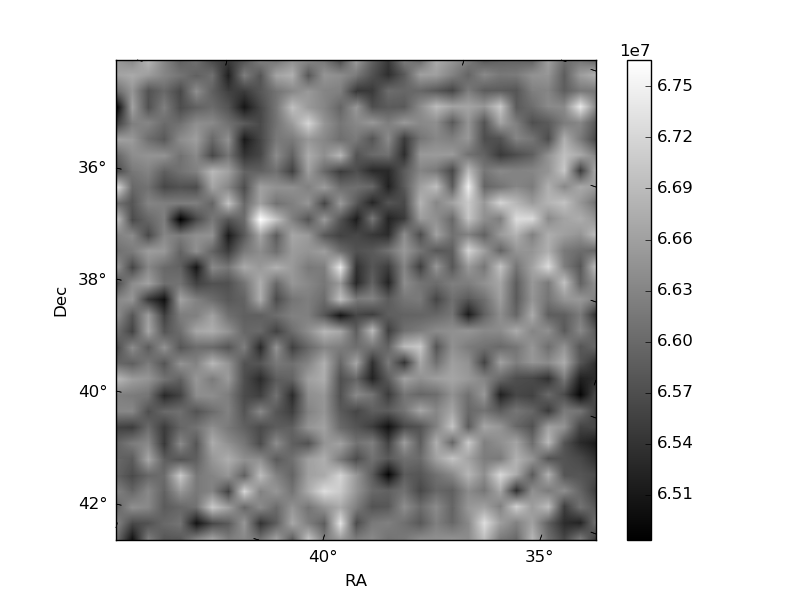
Histogram calculated using DETX and DETY for each event in the final _common_clean file
| Quadrant A | 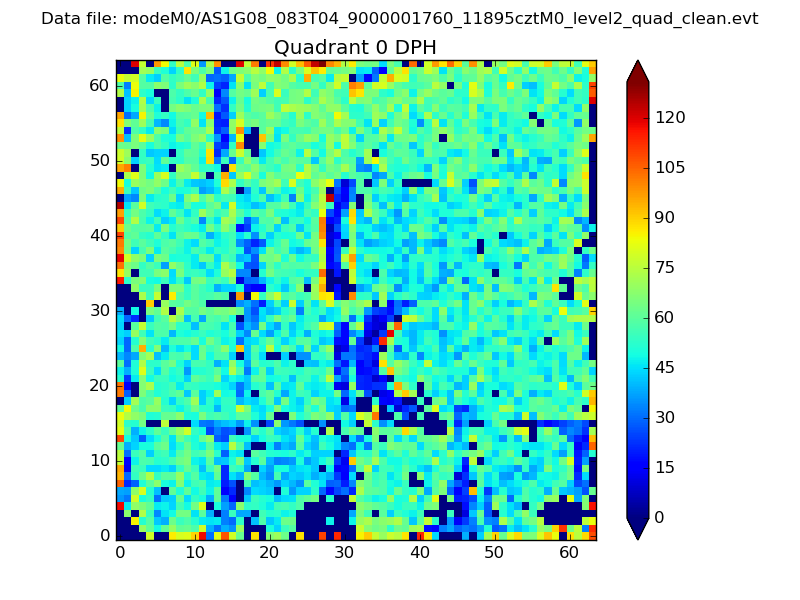 |
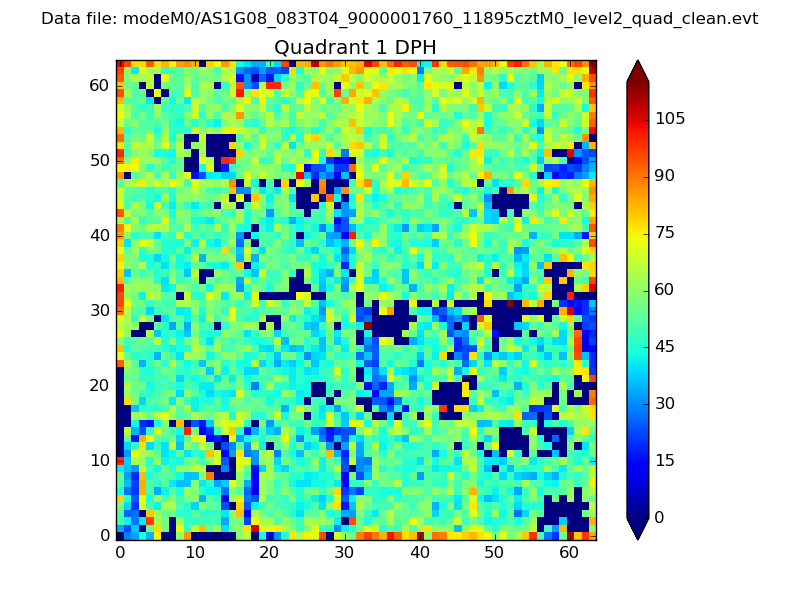 |
Quadrant B |
|---|---|---|---|
| Quadrant D | 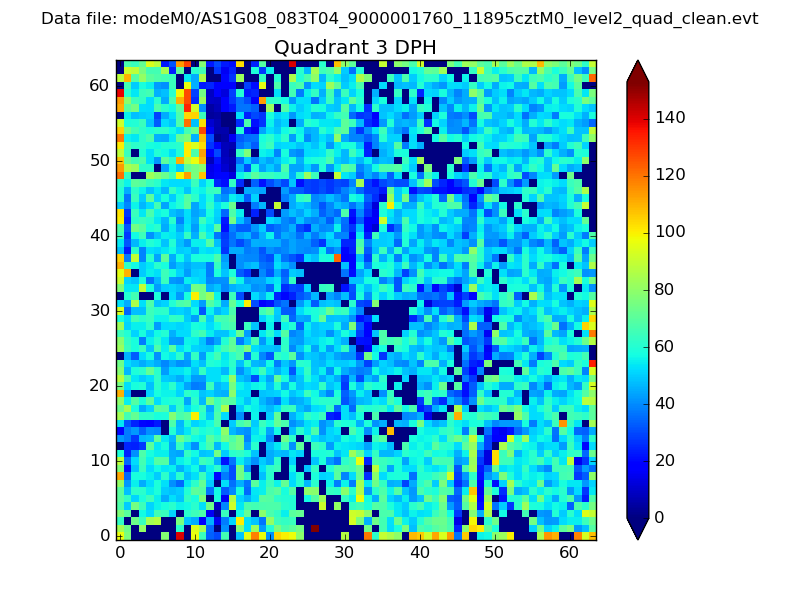 |
 |
Quadrant C |
| Plot type | Count rate plots | Images |
|---|---|---|
| Comparison with Poisson distribution Blue bars denote a histogram of data divided into 1 sec bins. Red curve is a Poisson curve with rate = median count rate of data. |
 |
 |
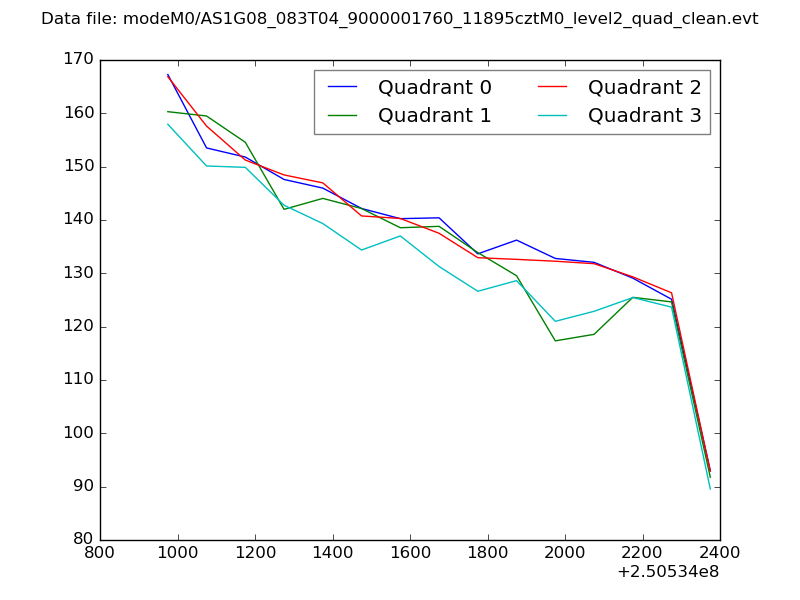
| Quadrant-wise count rates Data is divided into 100 sec bins |
 |
|
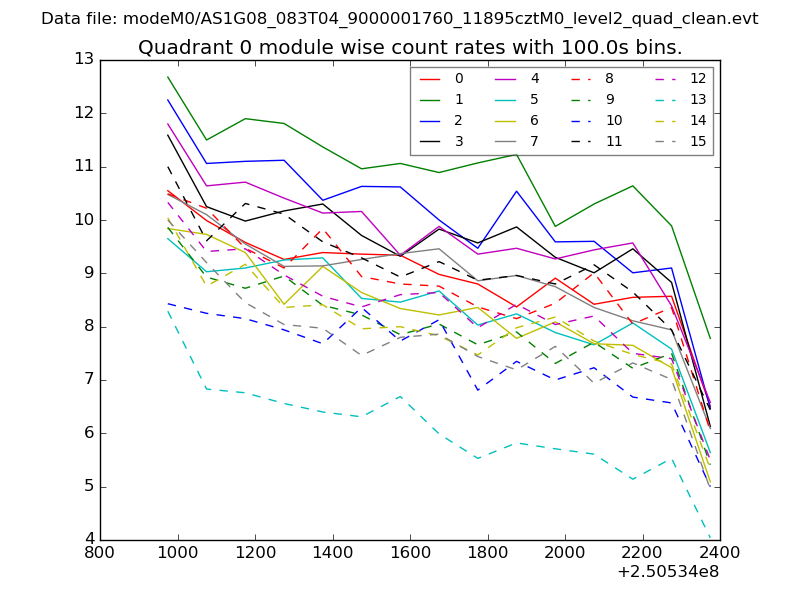
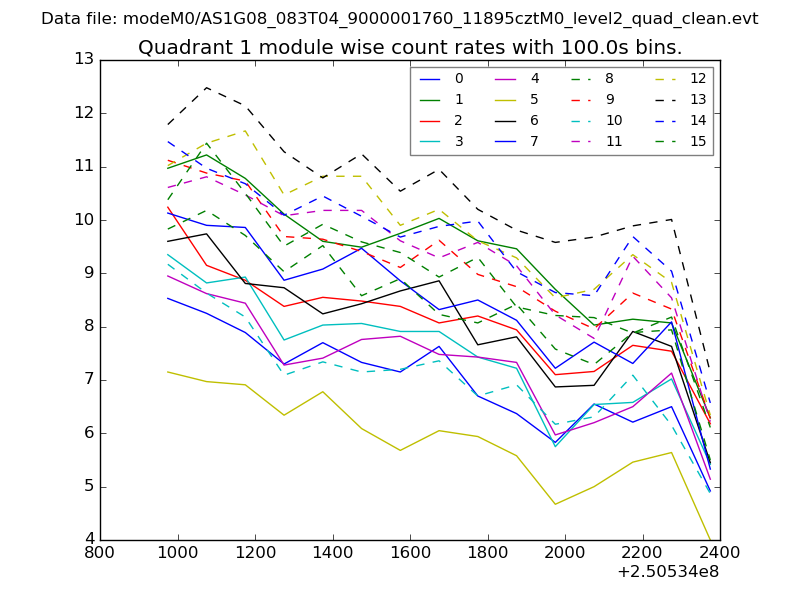
| Module-wise count rates for Quadrant A Data is divided into 100 sec bins |
 |
 |
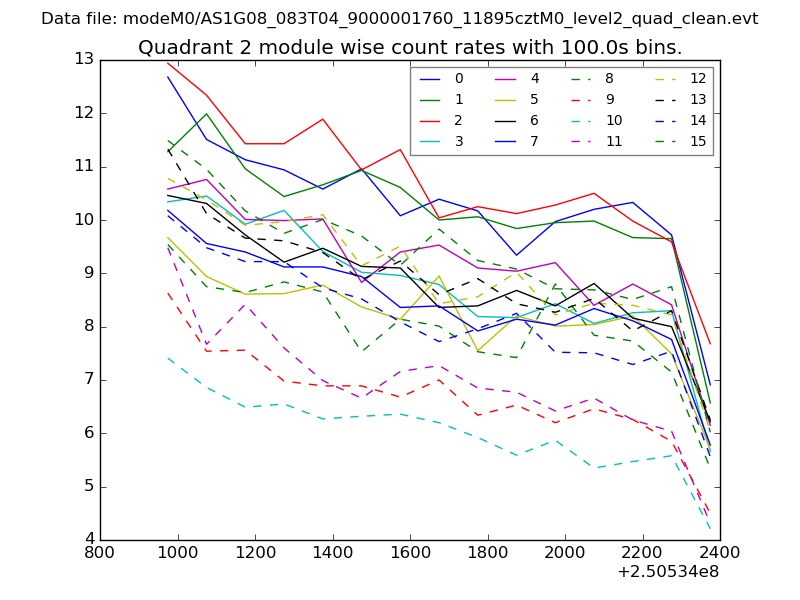
| Module-wise count rates for Quadrant B Data is divided into 100 sec bins |
 |
 |
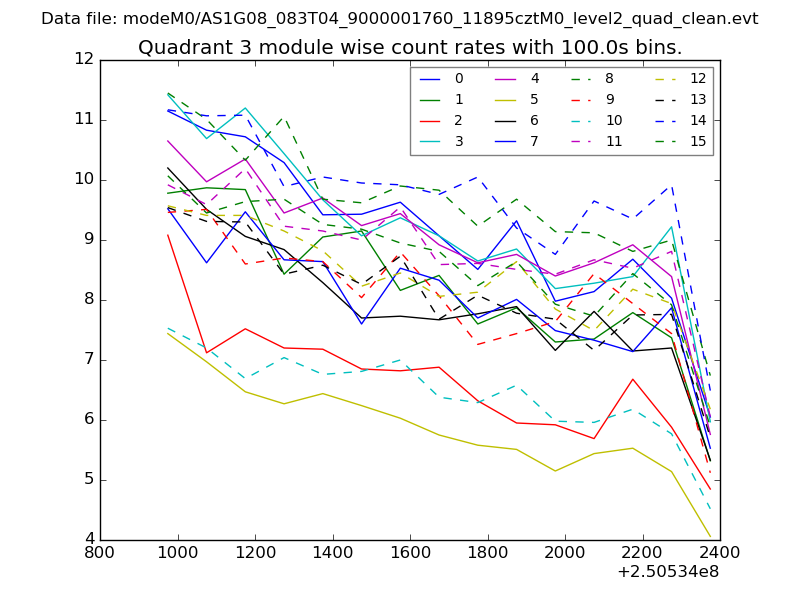
| Module-wise count rates for Quadrant C Data is divided into 100 sec bins |
 |
 |
| Module-wise count rates for Quadrant D Data is divided into 100 sec bins |
 |
 |
| Parameter | Plot |
|---|---|
| CZT HV Monitor | 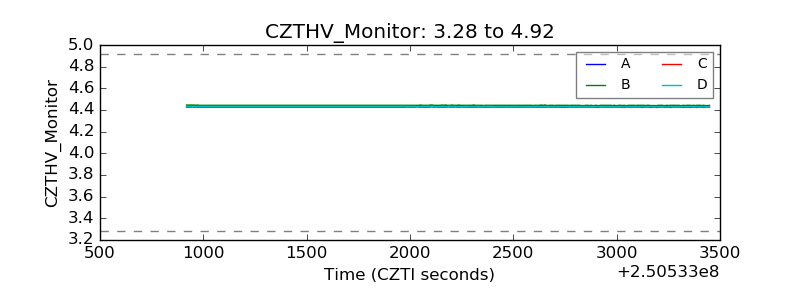 |
| D_VDD | 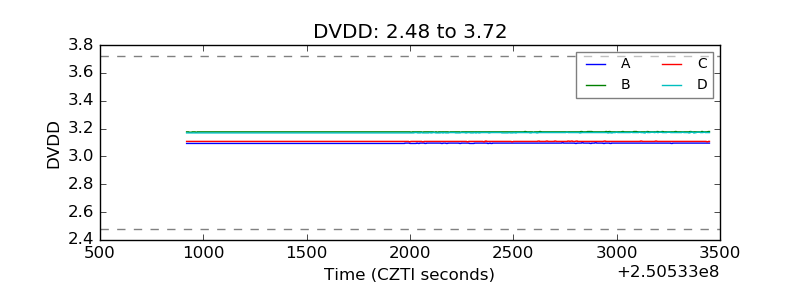 |
| Temperature 1 | 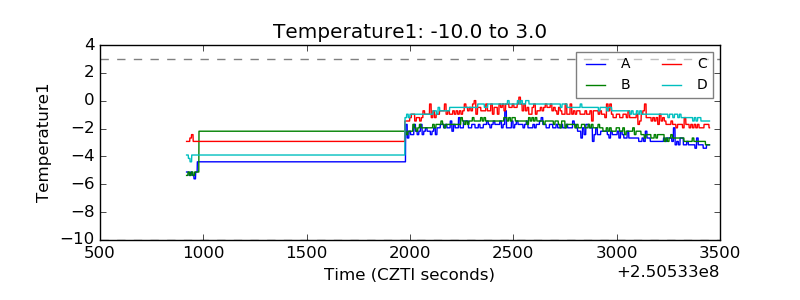 |
| Veto HV Monitor | 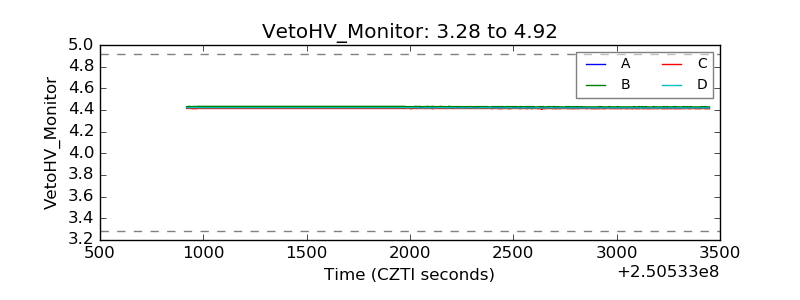 |
| Veto LLD | 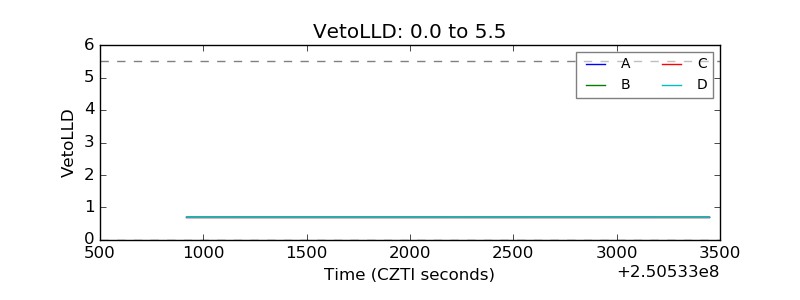 |
| Alpha Counter | 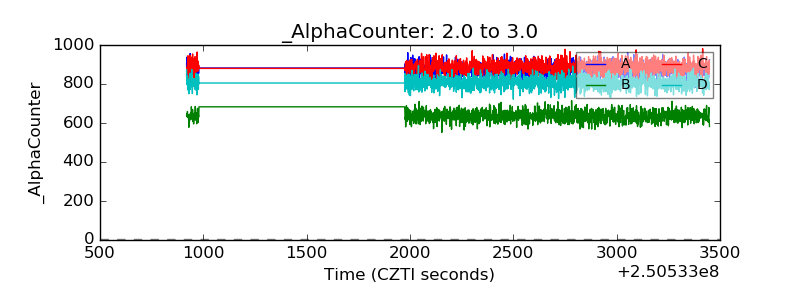 |
| _CPM_Rate | 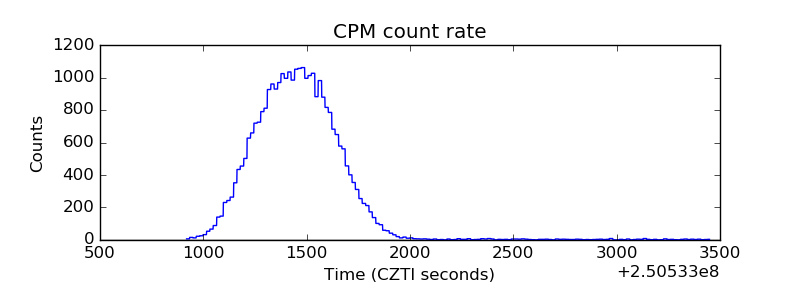 |
| CZT Counter | 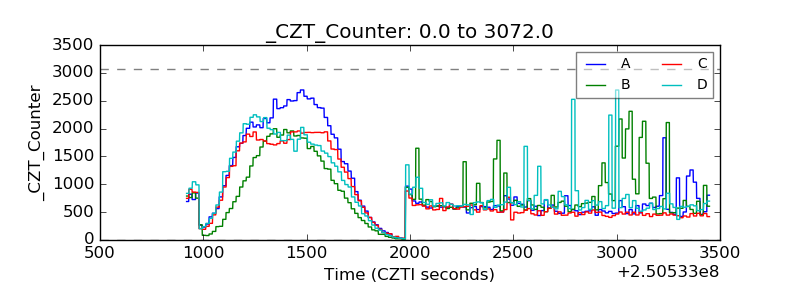 |
| +2.5 Volts monitor |  |
| +5 Volts monitor |  |
| _ROLL_ROT | 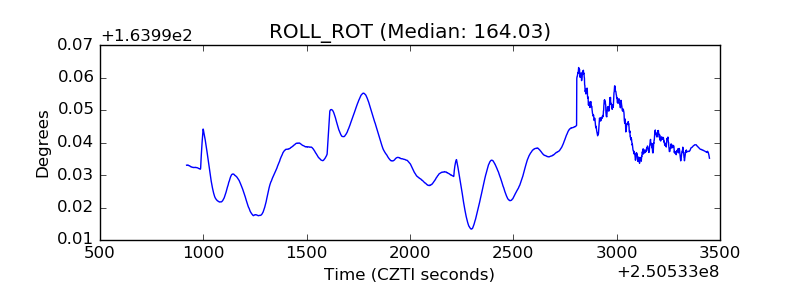 |
| _Roll_DEC | 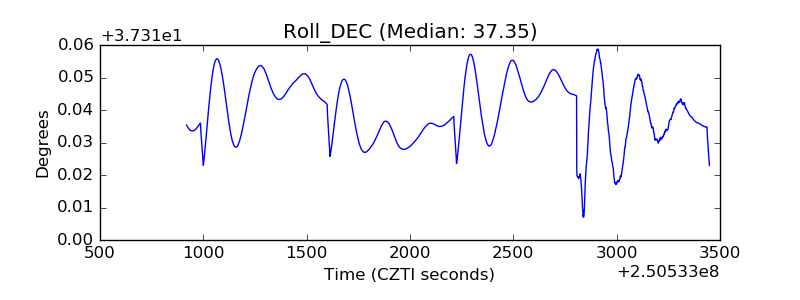 |
| _Roll_RA | 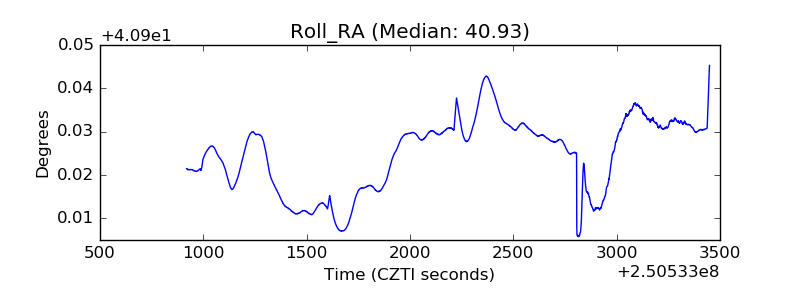 |
| Veto Counter | 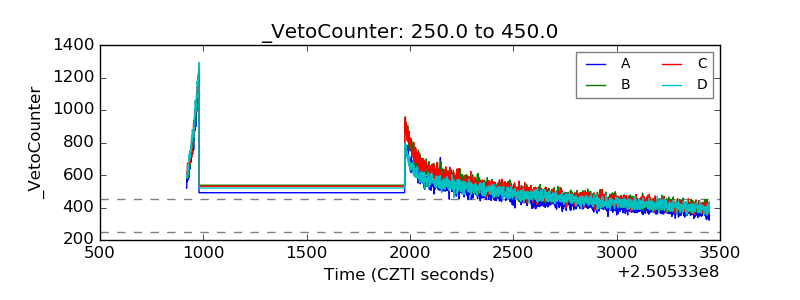 |