| Param | Original file | Final file |
|---|---|---|
| Filename | modeM0/AS1A04_088T05_9000001764cztM0_level2.fits | modeM0/AS1A04_088T05_9000001764cztM0_level2_quad_clean.evt |
| Size (bytes) | 1,114,905,600 | 1,033,030,080 |
| Size | 1.0 GB | 985.2 MB |
| Events in quadrant A | 6,729,640 | 6,002,121 |
| Events in quadrant B | 6,401,488 | 5,725,887 |
| Events in quadrant C | 6,718,180 | 5,950,857 |
| Events in quadrant D | 5,606,406 | 5,303,067 |
| Mode M9 | |||
|---|---|---|---|
| Quadrant | BADHDUFLAG | Total packets | Discarded packets |
| A | 0 | 185 | 0 |
| B | 0 | 185 | 0 |
| C | 0 | 185 | 0 |
| D | 0 | 185 | 0 |
| Mode M0 | |||
|---|---|---|---|
| Quadrant | BADHDUFLAG | Total packets | Discarded packets |
| A | 0 | 280305 | 0 |
| B | 0 | 308148 | 0 |
| C | 0 | 248565 | 0 |
| D | 0 | 326951 | 0 |
| Mode SS | |||
|---|---|---|---|
| Quadrant | BADHDUFLAG | Total packets | Discarded packets |
| A | 0 | 2468 | 0 |
| B | 0 | 2468 | 0 |
| C | 0 | 2468 | 0 |
| D | 0 | 2468 | 0 |
| Quadrant | Total seconds | Saturated seconds | Saturation percentage |
|---|---|---|---|
| A | 121156 | 3530 | 2.913599% |
| B | 121156 | 6495 | 5.360857% |
| C | 121156 | 1124 | 0.927730% |
| D | 121156 | 7732 | 6.381855% |
Noise dominated data is calculated using 1-second bins in cleaned event files. If a bin has >2000 counts, and if more than 50% of those come from <1% of pixels, then it is considered to be noise-dominated and hence unusable.
| Quadrant | # 1 sec bins | Bins with >0 counts | Bins with >2000 counts | High rate bins dominated by noise | Noise dominated (total time) | Noise dominated (detector-on time) | Marked lightcurve |
|---|---|---|---|---|---|---|---|
| A | 139803 | 121116 | 0 | 0 | 0.00% | 0.00% |  |
| B | 139803 | 121095 | 0 | 0 | 0.00% | 0.00% |  |
| C | 139803 | 121136 | 0 | 0 | 0.00% | 0.00% |  |
| D | 139804 | 120768 | 0 | 0 | 0.00% | 0.00% |  |
Top three noisy pixels from each quadrant. If the there are fewer than three noisy pixels in the level2.evt file, extra rows are filled as -1
| Pixel properties | Quadrant properties | ||||||
|---|---|---|---|---|---|---|---|
| Quadrant | DetID | PixID | Counts | Sigma | Mean | Median | Sigma |
| A | 0 | 29 | 6730 | 11.64 | 1752 | 1635 | 437.6 |
| A | 7 | 110 | 5638 | 9.15 | 1752 | 1635 | 437.6 |
| A | 0 | 30 | 5139 | 8.01 | 1752 | 1635 | 437.6 |
| B | 2 | 9 | 5633 | 12.22 | 1691 | 1609 | 329.2 |
| B | 3 | 17 | 4428 | 8.56 | 1691 | 1609 | 329.2 |
| B | 2 | 8 | 4339 | 8.29 | 1691 | 1609 | 329.2 |
| C | 12 | 241 | 4803 | 6.83 | 1773 | 1642 | 462.9 |
| C | 2 | 191 | 4540 | 6.26 | 1773 | 1642 | 462.9 |
| C | 3 | 158 | 4420 | 6.0 | 1773 | 1642 | 462.9 |
| D | 6 | 231 | 4198 | 6.37 | 1600 | 1450 | 431.7 |
| D | 3 | 14 | 4114 | 6.17 | 1600 | 1450 | 431.7 |
| D | 7 | 5 | 3931 | 5.75 | 1600 | 1450 | 431.7 |
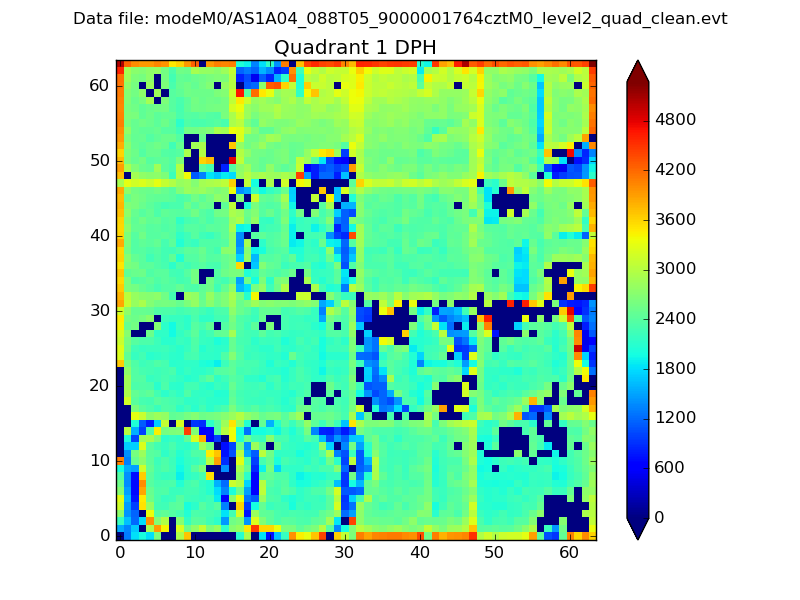
Histogram calculated using DETX and DETY for each event in the final _common_clean file
| Quadrant A |  |
 |
Quadrant B |
|---|---|---|---|
| Quadrant D |  |
 |
Quadrant C |
| Plot type | Count rate plots | Images |
|---|---|---|
| Comparison with Poisson distribution Blue bars denote a histogram of data divided into 1 sec bins. Red curve is a Poisson curve with rate = median count rate of data. |
 |
 |
| Quadrant-wise count rates Data is divided into 100 sec bins |
 |
|
| Module-wise count rates for Quadrant A Data is divided into 100 sec bins |
 |
 |
| Module-wise count rates for Quadrant B Data is divided into 100 sec bins |
 |
 |
| Module-wise count rates for Quadrant C Data is divided into 100 sec bins |
 |
 |
| Module-wise count rates for Quadrant D Data is divided into 100 sec bins |
 |
 |
| Parameter | Plot |
|---|---|
| CZT HV Monitor |  |
| D_VDD | 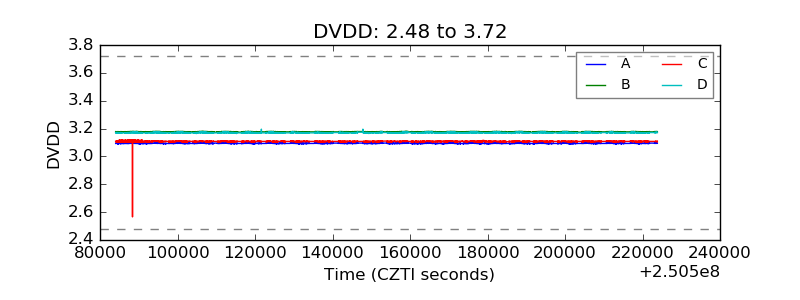 |
| Temperature 1 |  |
| Veto HV Monitor |  |
| Veto LLD |  |
| Alpha Counter |  |
| _CPM_Rate | 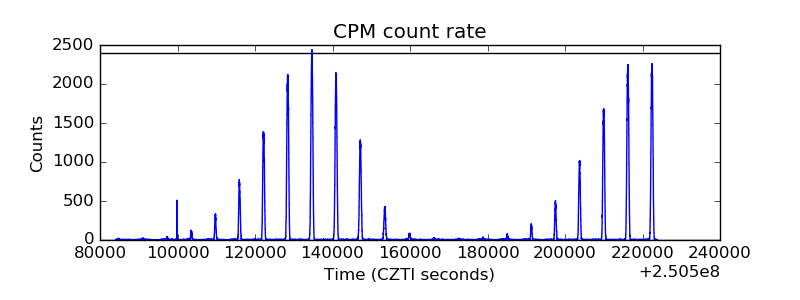 |
| CZT Counter |  |
| +2.5 Volts monitor |  |
| +5 Volts monitor |  |
| _ROLL_ROT |  |
| _Roll_DEC |  |
| _Roll_RA |  |
| Veto Counter |  |