| Param | Original file | Final file |
|---|---|---|
| Filename | modeM0/AS1A04_088T05_9000001764_11902cztM0_level2.evt | modeM0/AS1A04_088T05_9000001764_11902cztM0_level2_quad_clean.evt |
| Size (bytes) | 194,454,720 | 17,671,680 |
| Size | 185.4 MB | 16.9 MB |
| Events in quadrant A | 1,428,800 | 88,779 |
| Events in quadrant B | 1,484,484 | 86,723 |
| Events in quadrant C | 1,284,129 | 93,944 |
| Events in quadrant D | 1,523,665 | 89,572 |
| Mode M0 | |||
|---|---|---|---|
| Quadrant | BADHDUFLAG | Total packets | Discarded packets |
| A | 0 | 5737 | 2 |
| B | 0 | 6004 | 1 |
| C | 0 | 5474 | 1 |
| D | 0 | 6119 | 1 |
| Mode SS | |||
|---|---|---|---|
| Quadrant | BADHDUFLAG | Total packets | Discarded packets |
| A | 0 | 50 | 0 |
| B | 0 | 50 | 0 |
| C | 0 | 50 | 0 |
| D | 0 | 50 | 0 |
| Quadrant | Total seconds | Saturated seconds | Saturation percentage |
|---|---|---|---|
| A | 2431 | 312 | 12.834225% |
| B | 2431 | 367 | 15.096668% |
| C | 2431 | 232 | 9.543398% |
| D | 2431 | 246 | 10.119292% |
Noise dominated data is calculated using 1-second bins in cleaned event files. If a bin has >2000 counts, and if more than 50% of those come from <1% of pixels, then it is considered to be noise-dominated and hence unusable.
| Quadrant | # 1 sec bins | Bins with >0 counts | Bins with >2000 counts | High rate bins dominated by noise | Noise dominated (total time) | Noise dominated (detector-on time) | Marked lightcurve |
|---|---|---|---|---|---|---|---|
| A | 2467 | 2433 | 4 | 4 | 0.16% | 0.16% | 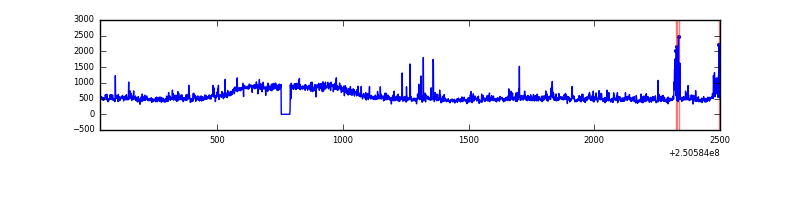 |
| B | 2467 | 2433 | 15 | 15 | 0.61% | 0.62% | 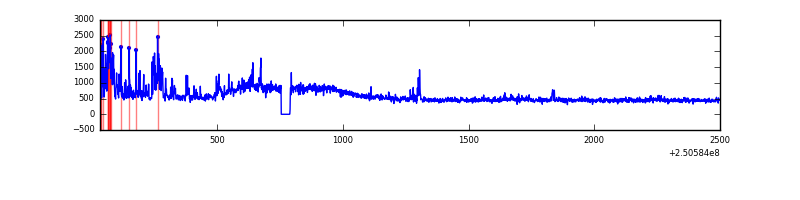 |
| C | 2467 | 2433 | 0 | 0 | 0.00% | 0.00% | 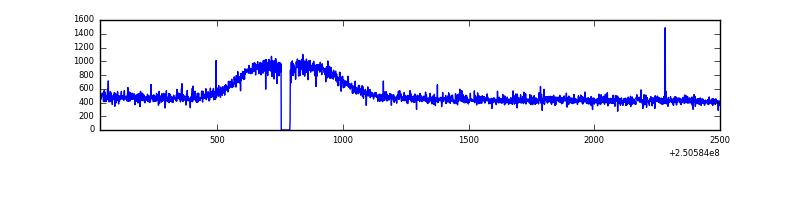 |
| D | 2467 | 2433 | 21 | 21 | 0.85% | 0.86% | 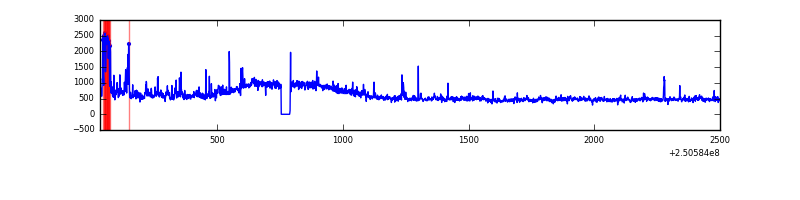 |
Top three noisy pixels from each quadrant. If the there are fewer than three noisy pixels in the level2.evt file, extra rows are filled as -1
| Pixel properties | Quadrant properties | ||||||
|---|---|---|---|---|---|---|---|
| Quadrant | DetID | PixID | Counts | Sigma | Mean | Median | Sigma |
| A | 8 | 15 | 45135 | 643.33 | 323 | 313 | 69.7 |
| A | 1 | 162 | 39795 | 566.68 | 323 | 313 | 69.7 |
| A | 14 | 63 | 30169 | 428.52 | 323 | 313 | 69.7 |
| B | 4 | 239 | 180519 | 2685.39 | 324 | 314 | 67.1 |
| B | 0 | 218 | 9459 | 136.28 | 324 | 314 | 67.1 |
| B | 0 | 214 | 8944 | 128.6 | 324 | 314 | 67.1 |
| C | 8 | 128 | 3154 | 35.84 | 327 | 327 | 78.9 |
| C | 13 | 61 | 2379 | 26.01 | 327 | 327 | 78.9 |
| C | 8 | 112 | 1886 | 19.76 | 327 | 327 | 78.9 |
| D | 8 | 195 | 149607 | 1832.85 | 323 | 311 | 81.5 |
| D | 1 | 52 | 112899 | 1382.2 | 323 | 311 | 81.5 |
| D | 13 | 104 | 16946 | 204.22 | 323 | 311 | 81.5 |
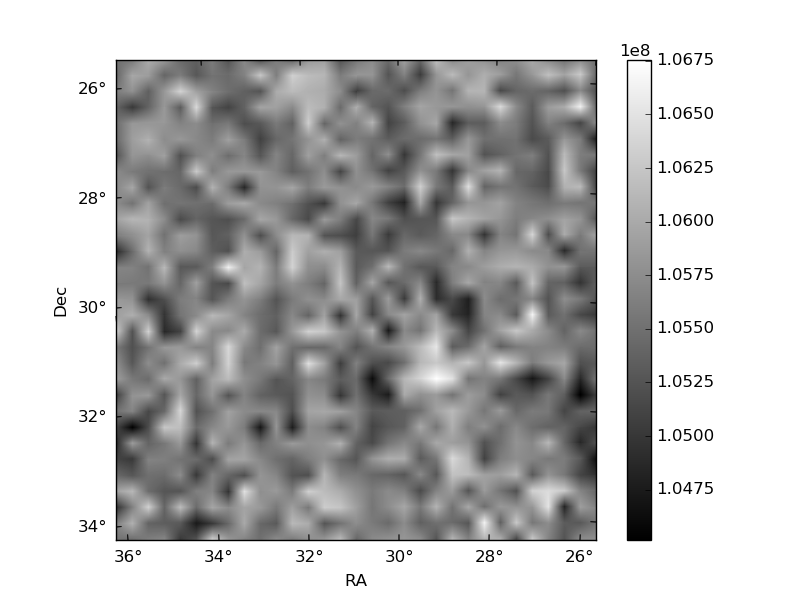
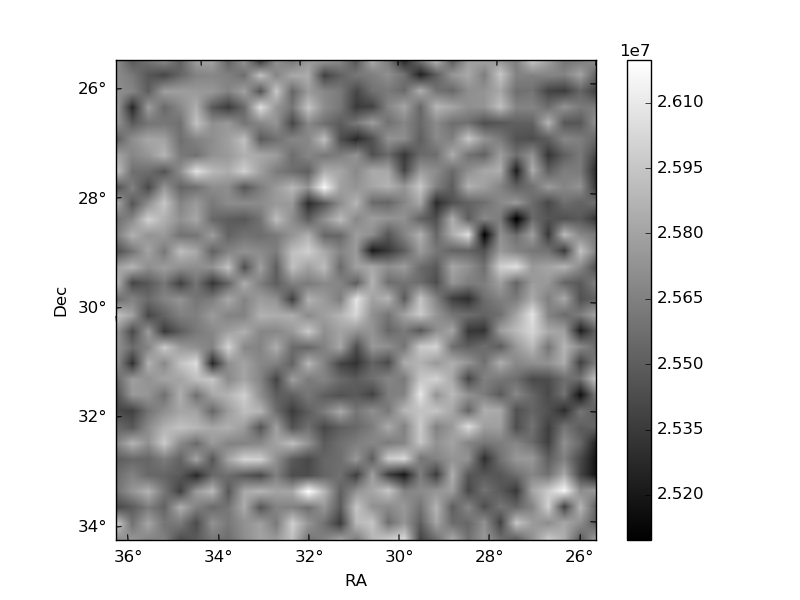
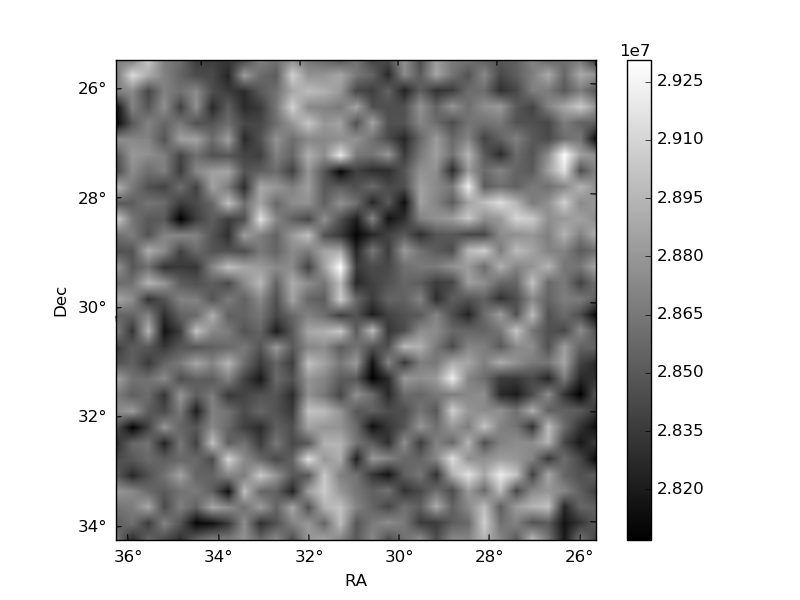
Histogram calculated using DETX and DETY for each event in the final _common_clean file
| Quadrant A | 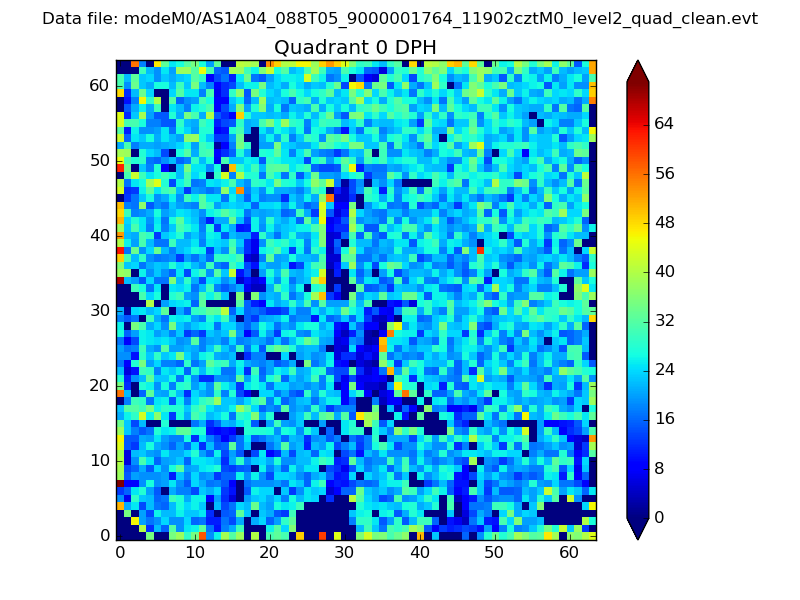 |
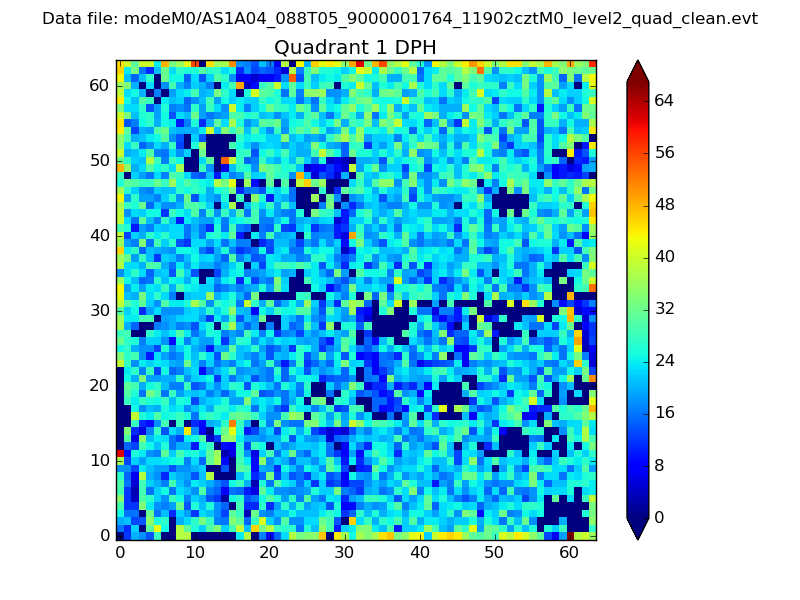 |
Quadrant B |
|---|---|---|---|
| Quadrant D | 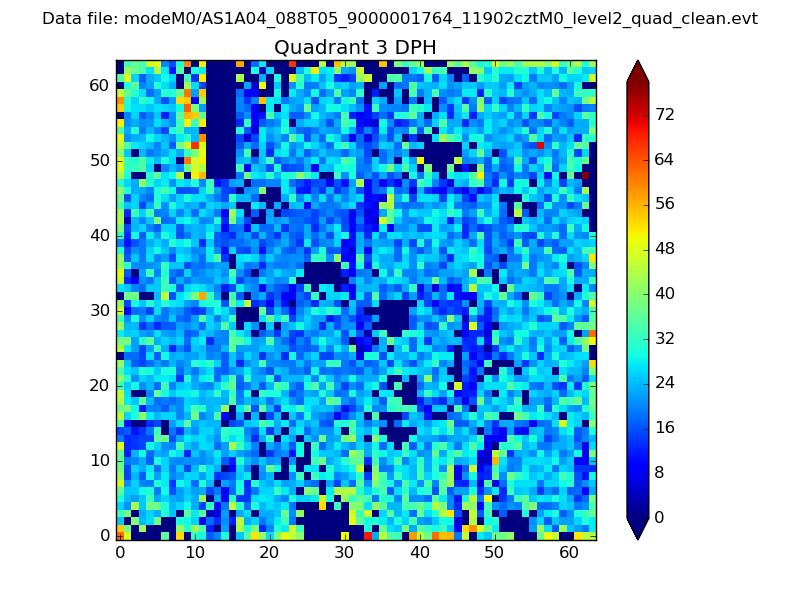 |
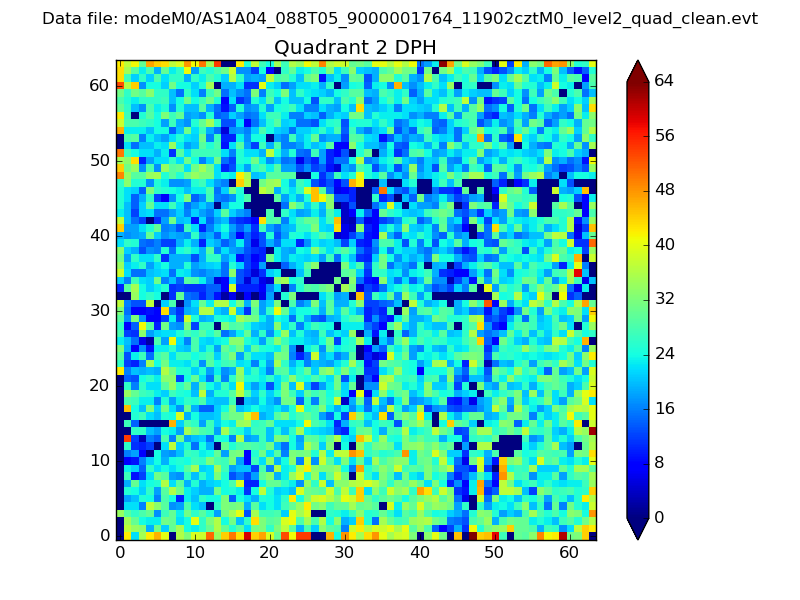 |
Quadrant C |
| Plot type | Count rate plots | Images |
|---|---|---|
| Comparison with Poisson distribution Blue bars denote a histogram of data divided into 1 sec bins. Red curve is a Poisson curve with rate = median count rate of data. |
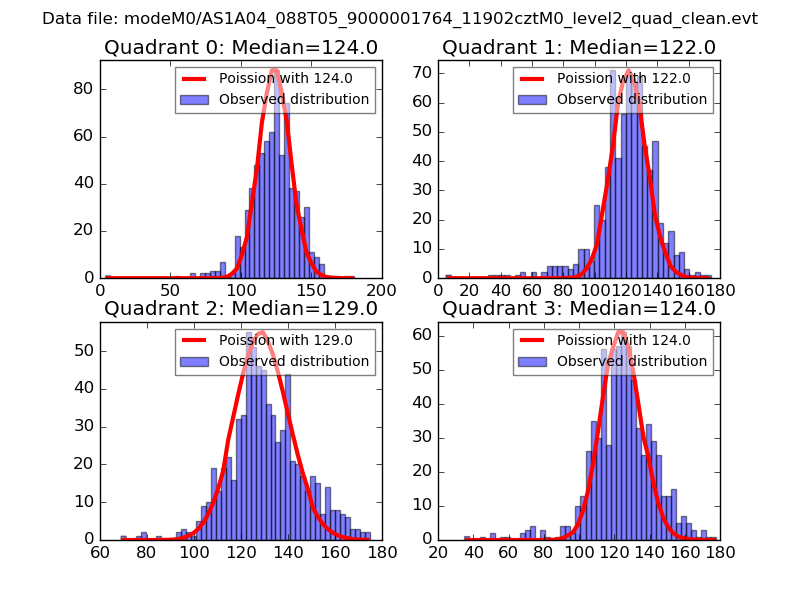 |
 |
| Quadrant-wise count rates Data is divided into 100 sec bins |
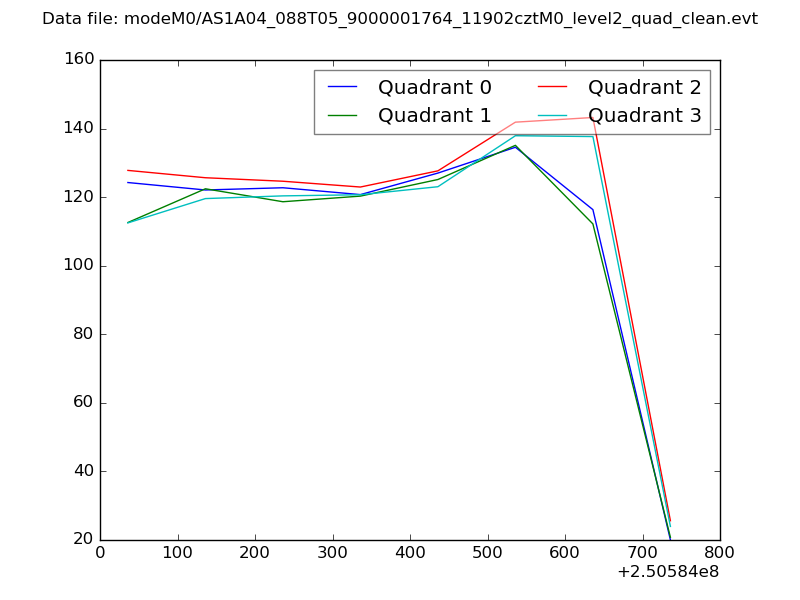 |
|
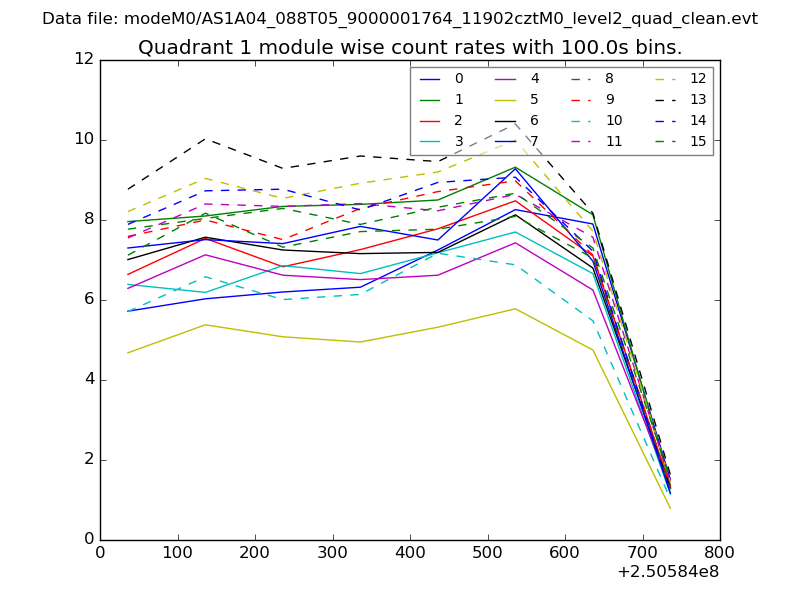
| Module-wise count rates for Quadrant A Data is divided into 100 sec bins |
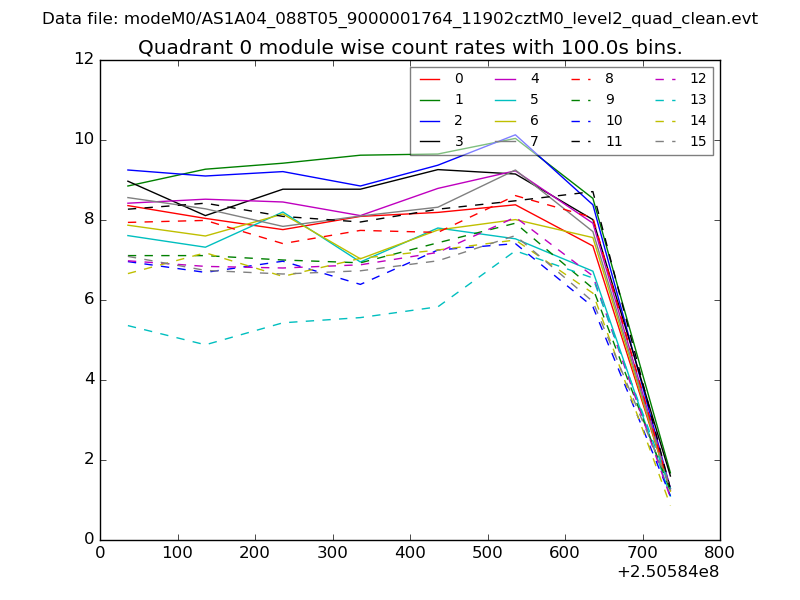 |
 |
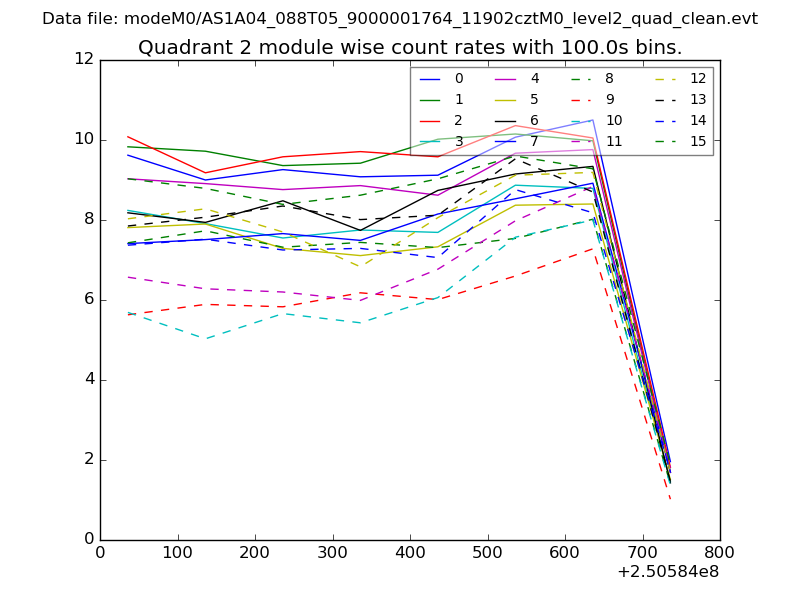
| Module-wise count rates for Quadrant B Data is divided into 100 sec bins |
 |
 |
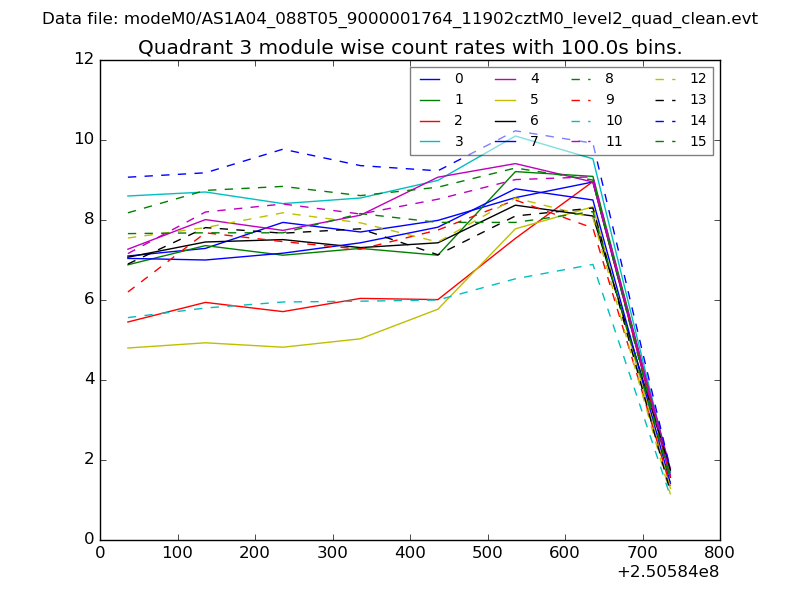
| Module-wise count rates for Quadrant C Data is divided into 100 sec bins |
 |
 |
| Module-wise count rates for Quadrant D Data is divided into 100 sec bins |
 |
 |
| Parameter | Plot |
|---|---|
| CZT HV Monitor | 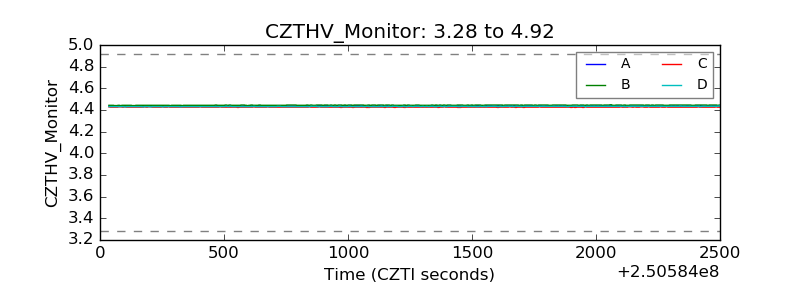 |
| D_VDD | 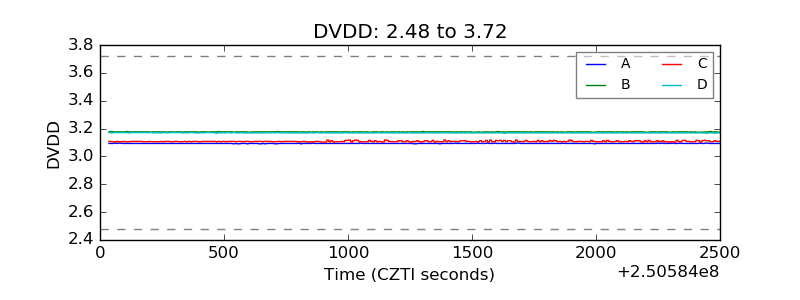 |
| Temperature 1 | 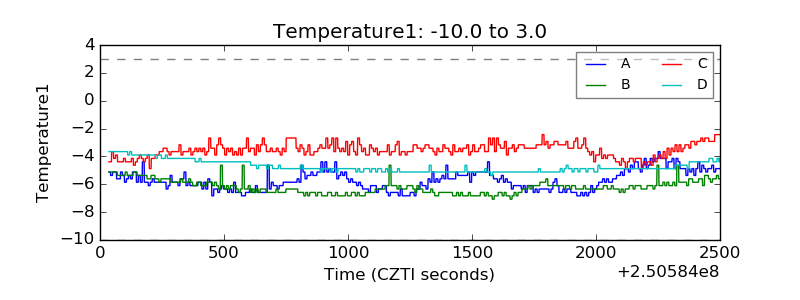 |
| Veto HV Monitor | 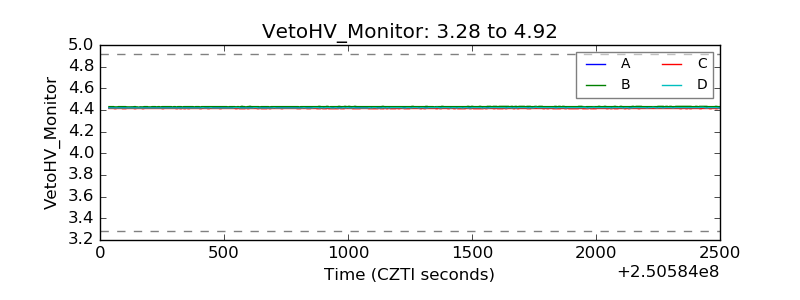 |
| Veto LLD | 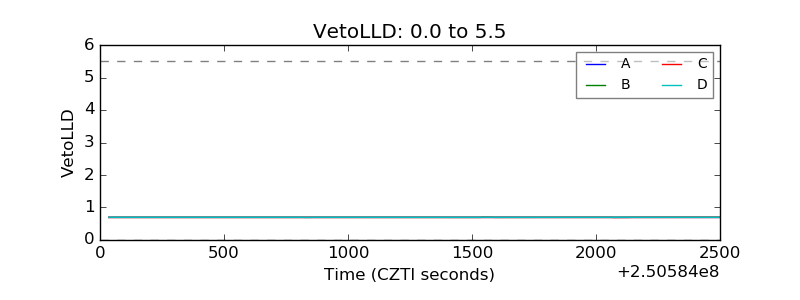 |
| Alpha Counter | 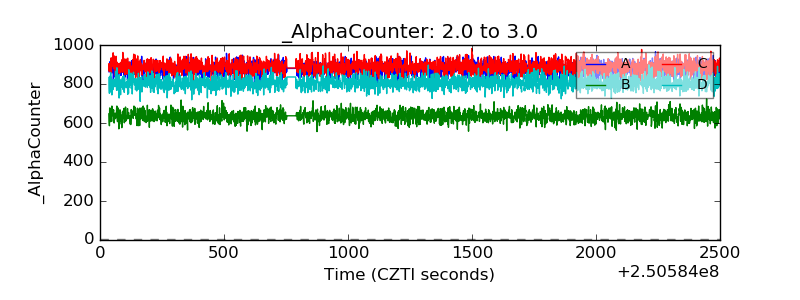 |
| _CPM_Rate | 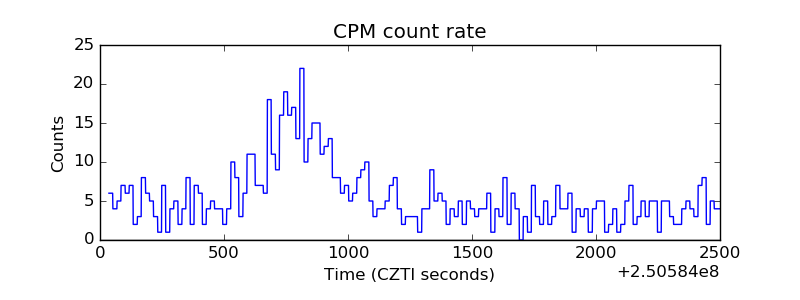 |
| CZT Counter | 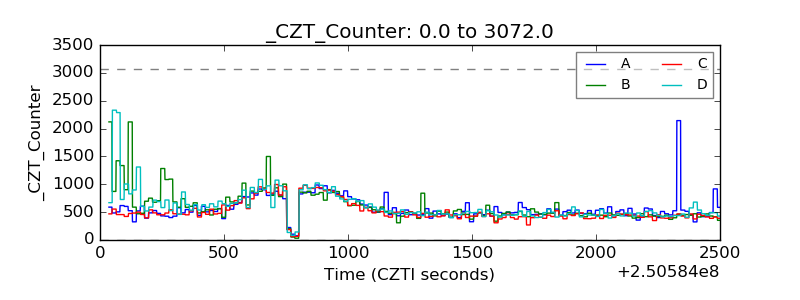 |
| +2.5 Volts monitor |  |
| +5 Volts monitor |  |
| _ROLL_ROT | 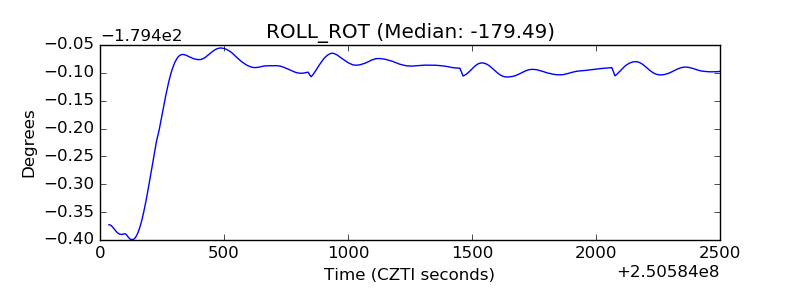 |
| _Roll_DEC | 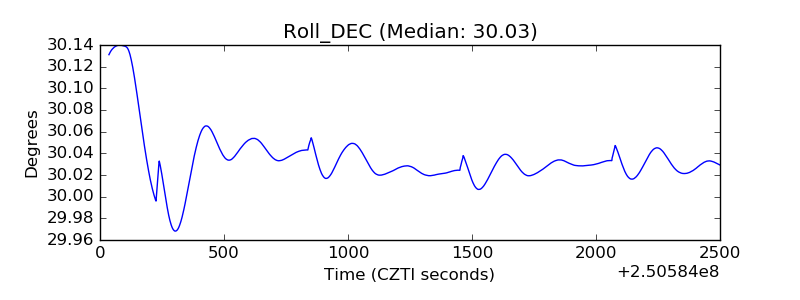 |
| _Roll_RA | 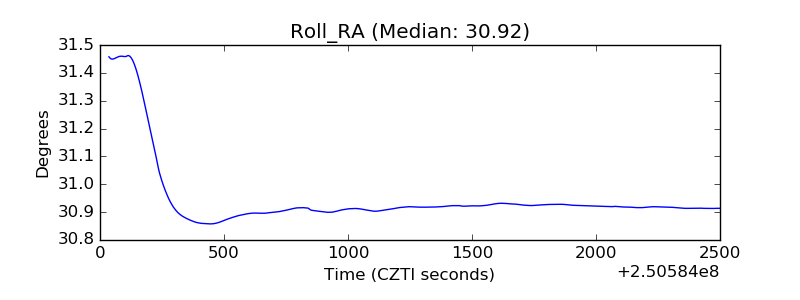 |
| Veto Counter | 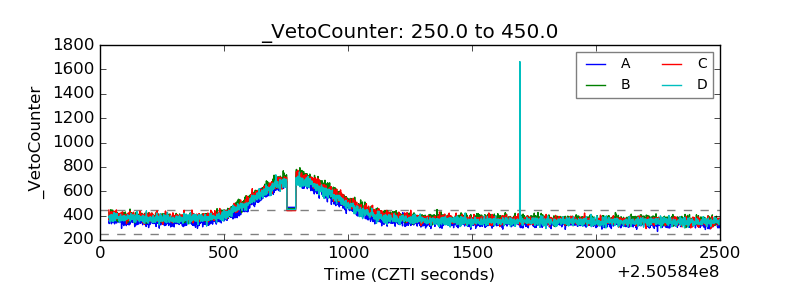 |