| Param | Original file | Final file |
|---|---|---|
| Filename | modeM0/AS1A04_088T05_9000001764_11903cztM0_level2.evt | modeM0/AS1A04_088T05_9000001764_11903cztM0_level2_quad_clean.evt |
| Size (bytes) | 641,949,120 | 76,824,000 |
| Size | 612.2 MB | 73.3 MB |
| Events in quadrant A | 6,305,978 | 400,161 |
| Events in quadrant B | 4,286,059 | 457,343 |
| Events in quadrant C | 3,673,607 | 468,266 |
| Events in quadrant D | 4,641,712 | 452,450 |
| Mode M9 | |||
|---|---|---|---|
| Quadrant | BADHDUFLAG | Total packets | Discarded packets |
| A | 0 | 3 | 0 |
| B | 0 | 3 | 0 |
| C | 0 | 3 | 0 |
| D | 0 | 3 | 0 |
| Mode M0 | |||
|---|---|---|---|
| Quadrant | BADHDUFLAG | Total packets | Discarded packets |
| A | 0 | 23753 | 3 |
| B | 0 | 17735 | 2 |
| C | 0 | 16445 | 2 |
| D | 0 | 18899 | 2 |
| Mode SS | |||
|---|---|---|---|
| Quadrant | BADHDUFLAG | Total packets | Discarded packets |
| A | 0 | 158 | 0 |
| B | 0 | 158 | 0 |
| C | 0 | 158 | 0 |
| D | 0 | 158 | 0 |
| Quadrant | Total seconds | Saturated seconds | Saturation percentage |
|---|---|---|---|
| A | 7878 | 1251 | 15.879665% |
| B | 7878 | 423 | 5.369383% |
| C | 7878 | 259 | 3.287636% |
| D | 7878 | 308 | 3.909622% |
Noise dominated data is calculated using 1-second bins in cleaned event files. If a bin has >2000 counts, and if more than 50% of those come from <1% of pixels, then it is considered to be noise-dominated and hence unusable.
| Quadrant | # 1 sec bins | Bins with >0 counts | Bins with >2000 counts | High rate bins dominated by noise | Noise dominated (total time) | Noise dominated (detector-on time) | Marked lightcurve |
|---|---|---|---|---|---|---|---|
| A | 8184 | 7880 | 843 | 843 | 10.30% | 10.70% | 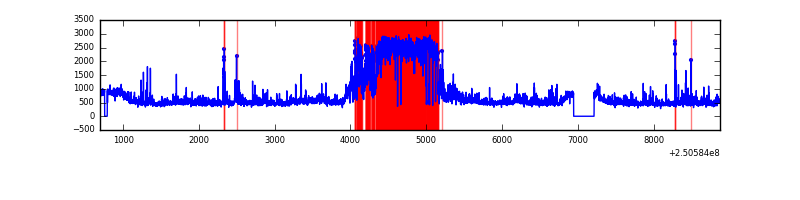 |
| B | 8184 | 7880 | 39 | 39 | 0.48% | 0.49% | 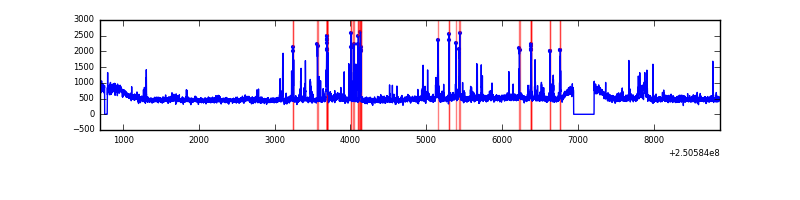 |
| C | 8184 | 7880 | 2 | 2 | 0.02% | 0.03% | 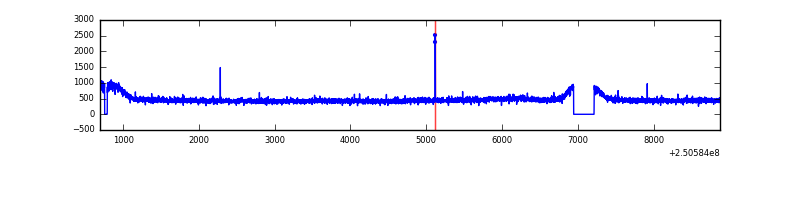 |
| D | 8184 | 7881 | 57 | 57 | 0.70% | 0.72% | 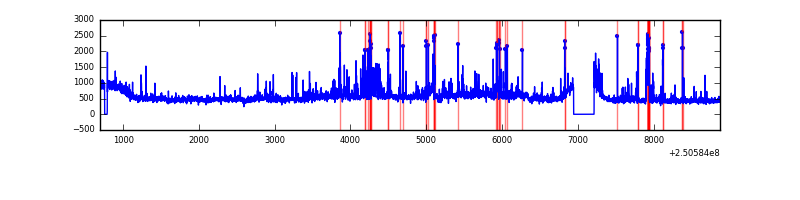 |
Top three noisy pixels from each quadrant. If the there are fewer than three noisy pixels in the level2.evt file, extra rows are filled as -1
| Pixel properties | Quadrant properties | ||||||
|---|---|---|---|---|---|---|---|
| Quadrant | DetID | PixID | Counts | Sigma | Mean | Median | Sigma |
| A | 14 | 63 | 2246912 | 11985.86 | 902 | 879 | 187.4 |
| A | 8 | 15 | 200650 | 1066.07 | 902 | 879 | 187.4 |
| A | 1 | 162 | 141599 | 750.95 | 902 | 879 | 187.4 |
| B | 4 | 239 | 328307 | 1772.98 | 949 | 923 | 184.7 |
| B | 15 | 204 | 77590 | 415.2 | 949 | 923 | 184.7 |
| B | 0 | 85 | 41462 | 219.54 | 949 | 923 | 184.7 |
| C | 8 | 128 | 9796 | 40.59 | 936 | 940 | 218.2 |
| C | 14 | 234 | 7993 | 32.33 | 936 | 940 | 218.2 |
| C | 13 | 61 | 6920 | 27.41 | 936 | 940 | 218.2 |
| D | 8 | 195 | 516577 | 2299.6 | 928 | 900 | 224.2 |
| D | 1 | 52 | 338195 | 1504.13 | 928 | 900 | 224.2 |
| D | 13 | 249 | 104758 | 463.14 | 928 | 900 | 224.2 |
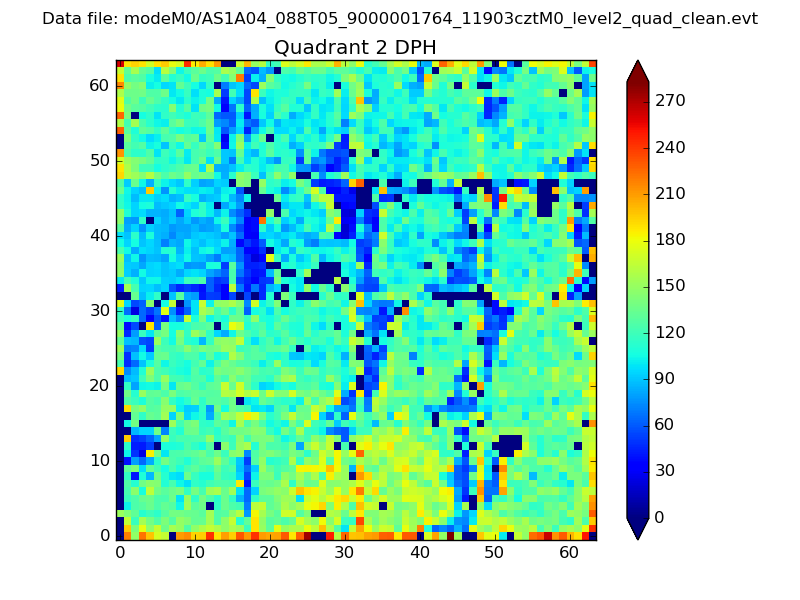
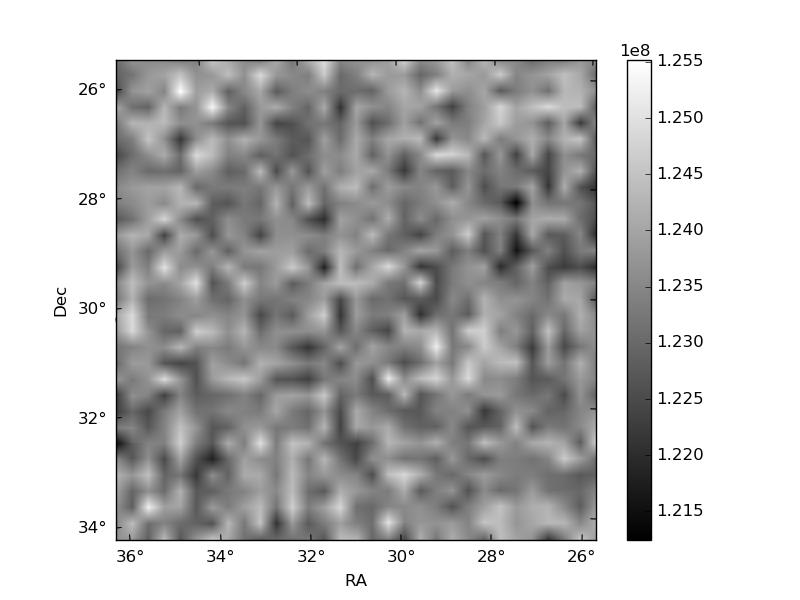
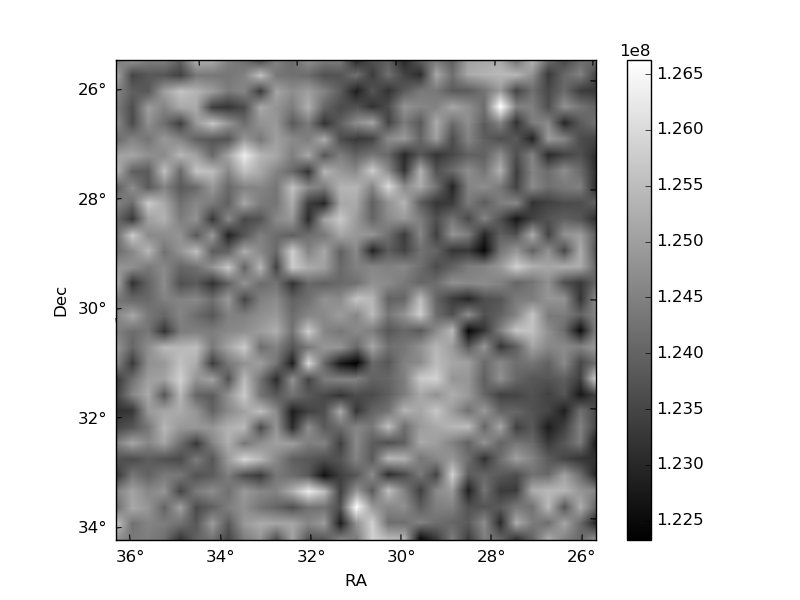
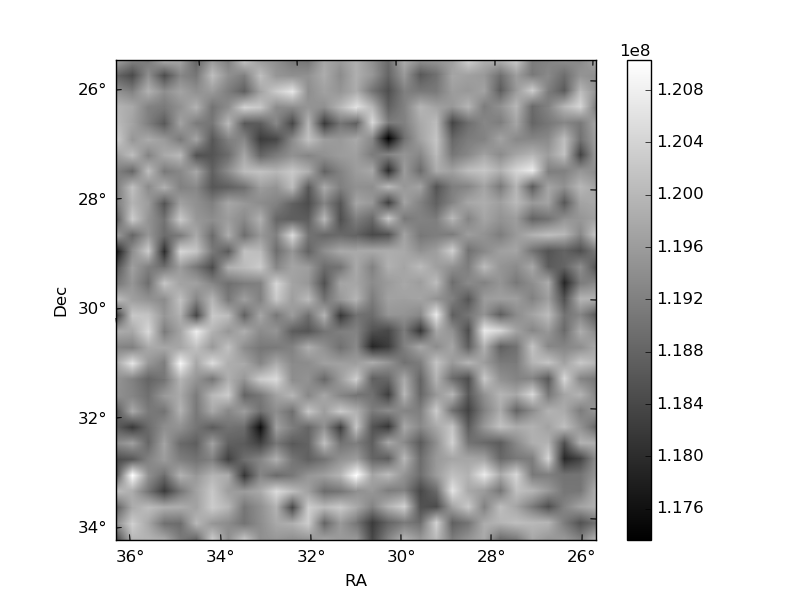
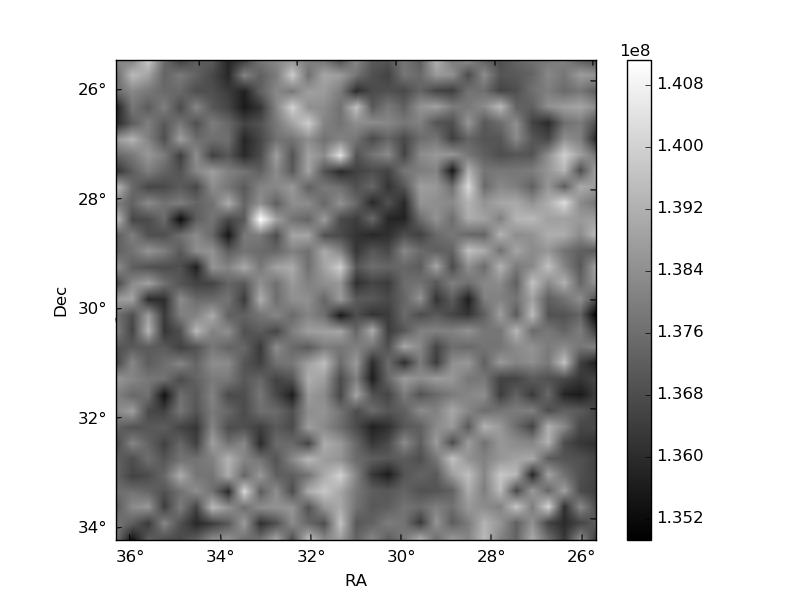
Histogram calculated using DETX and DETY for each event in the final _common_clean file
| Quadrant A | 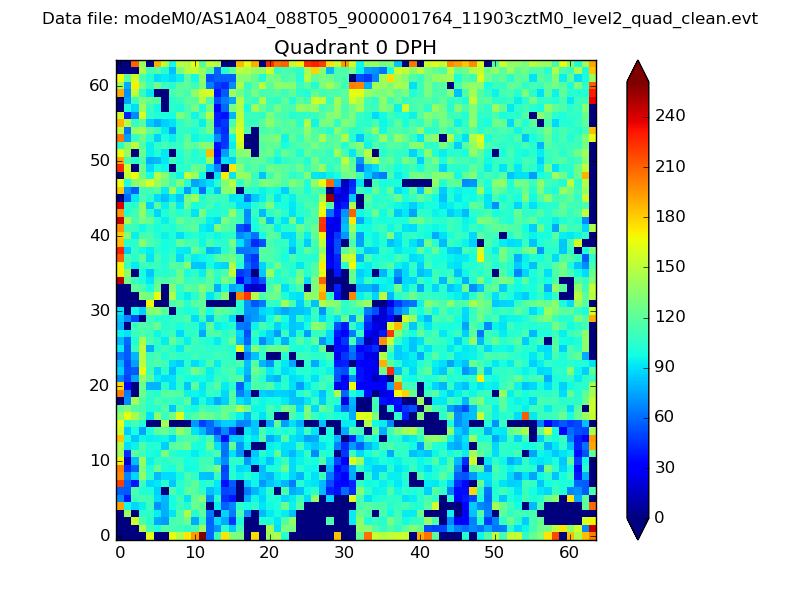 |
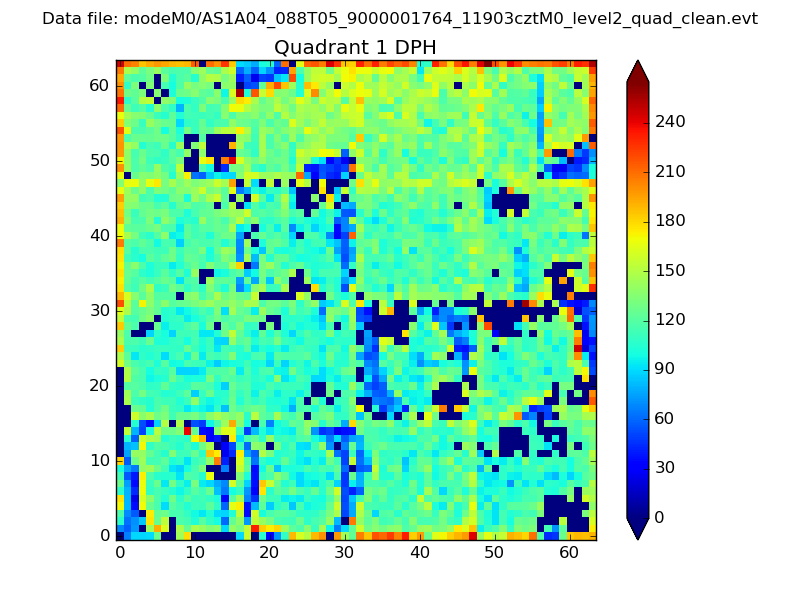 |
Quadrant B |
|---|---|---|---|
| Quadrant D | 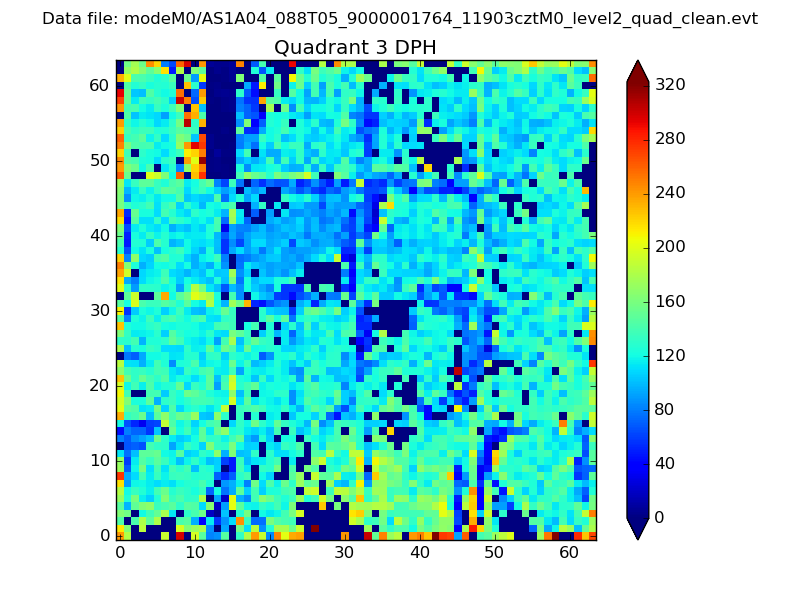 |
 |
Quadrant C |
| Plot type | Count rate plots | Images |
|---|---|---|
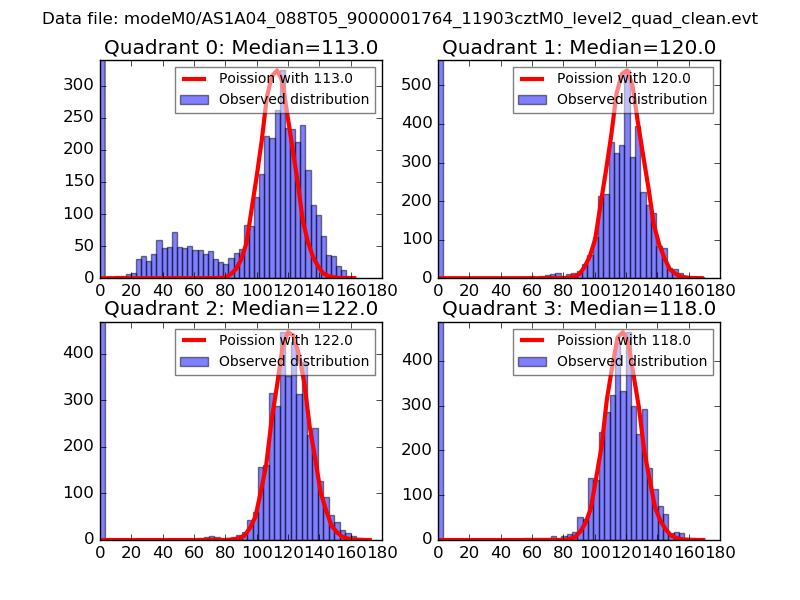
| Comparison with Poisson distribution Blue bars denote a histogram of data divided into 1 sec bins. Red curve is a Poisson curve with rate = median count rate of data. |
 |
 |
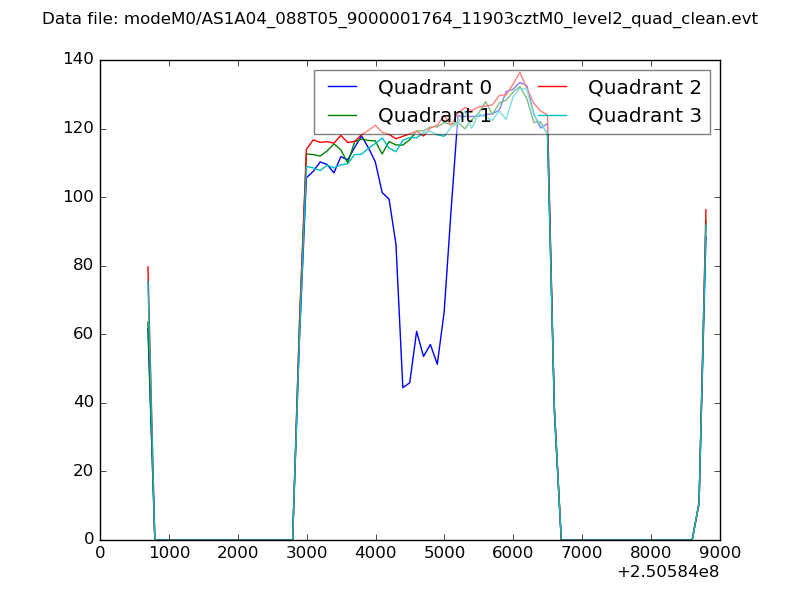
| Quadrant-wise count rates Data is divided into 100 sec bins |
 |
|
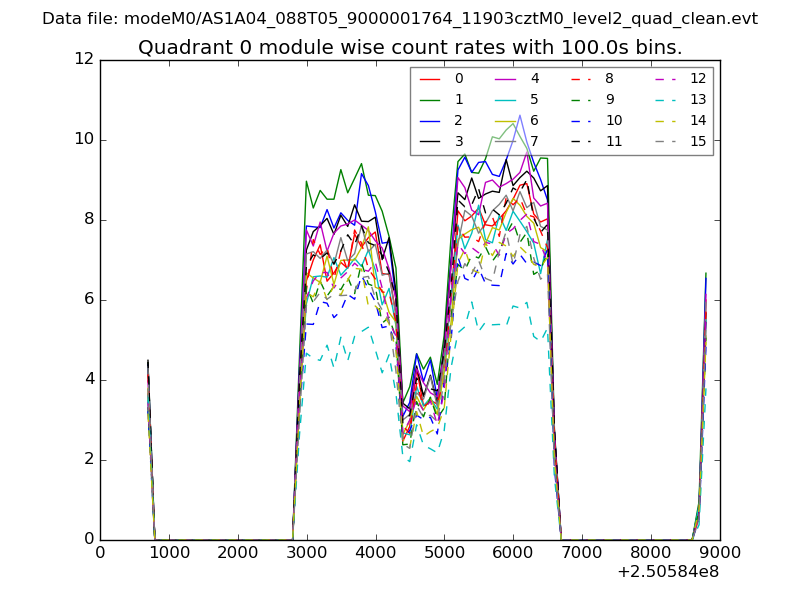
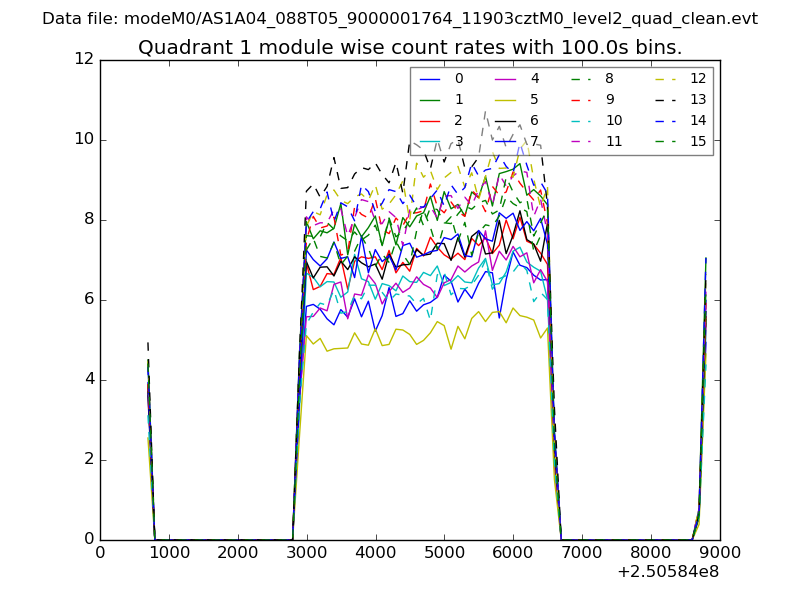
| Module-wise count rates for Quadrant A Data is divided into 100 sec bins |
 |
 |
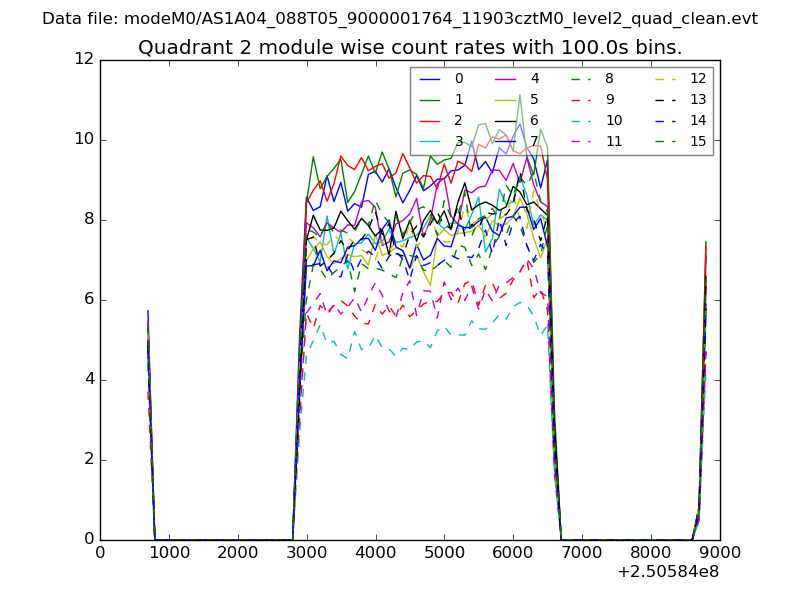
| Module-wise count rates for Quadrant B Data is divided into 100 sec bins |
 |
 |
| Module-wise count rates for Quadrant C Data is divided into 100 sec bins |
 |
 |
| Module-wise count rates for Quadrant D Data is divided into 100 sec bins |
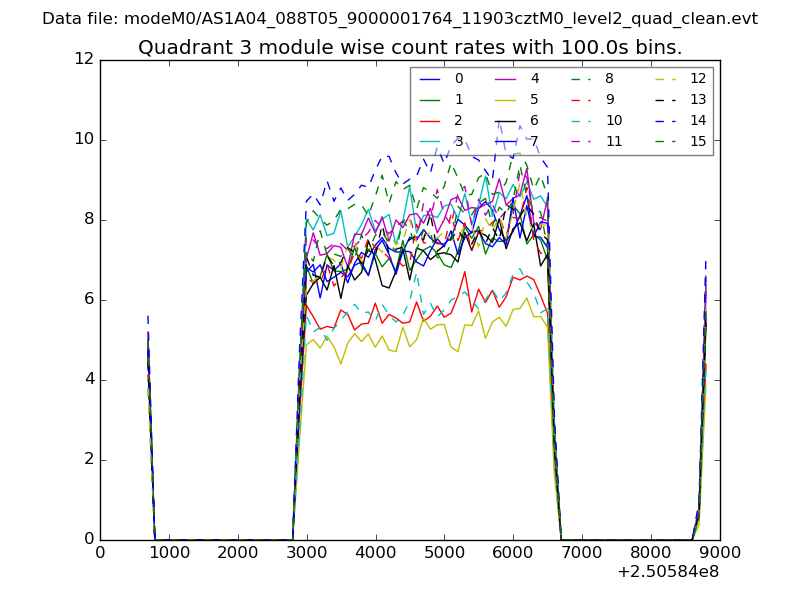 |
 |
| Parameter | Plot |
|---|---|
| CZT HV Monitor | 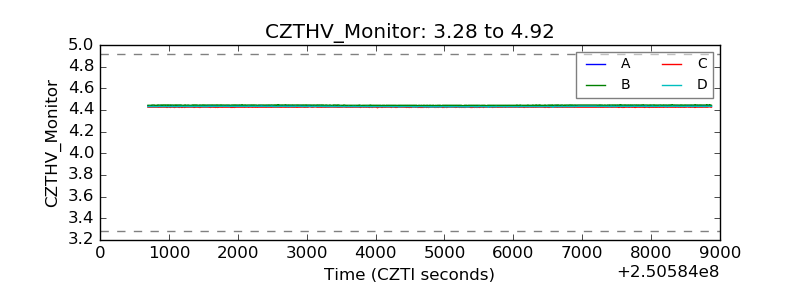 |
| D_VDD | 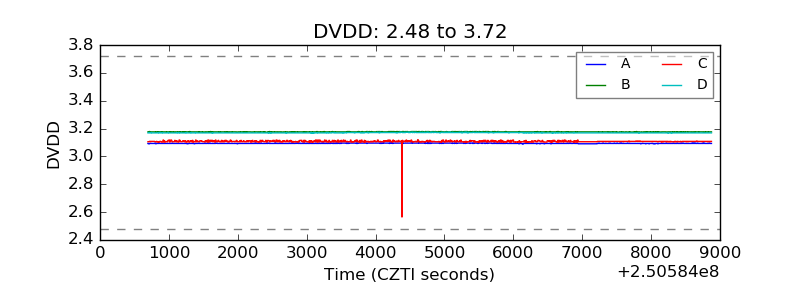 |
| Temperature 1 | 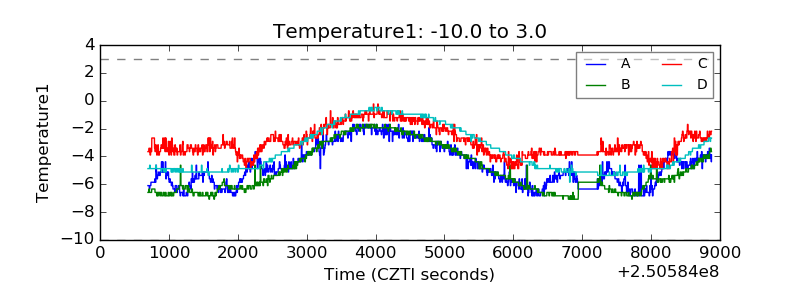 |
| Veto HV Monitor | 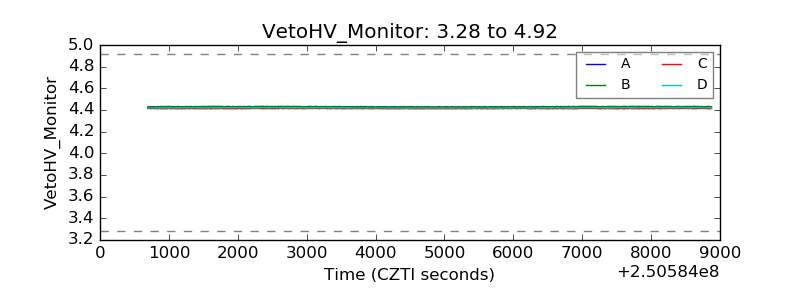 |
| Veto LLD | 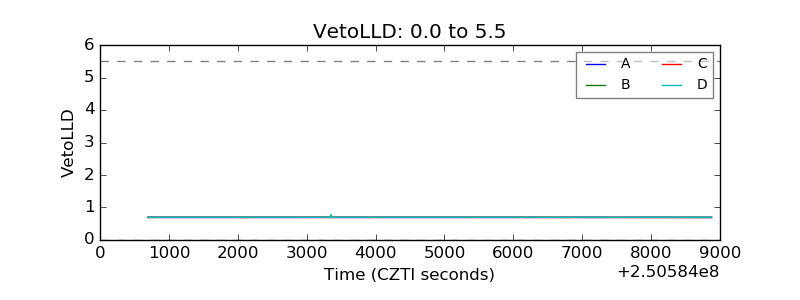 |
| Alpha Counter | 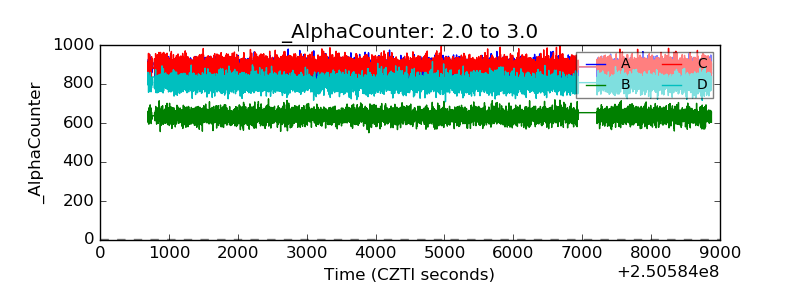 |
| _CPM_Rate | 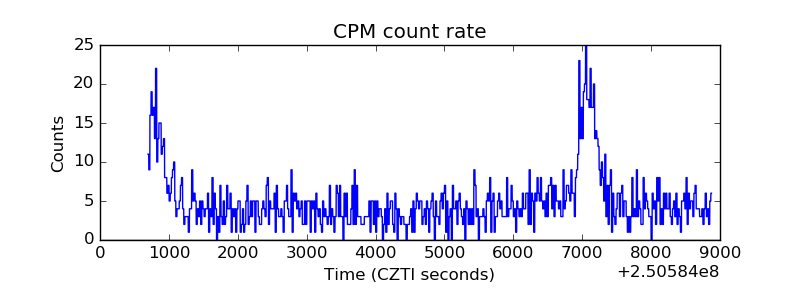 |
| CZT Counter | 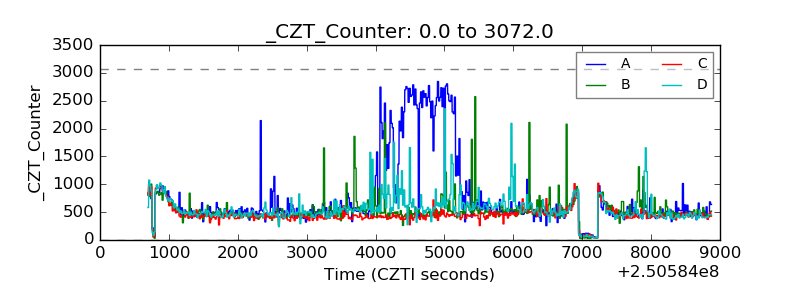 |
| +2.5 Volts monitor | 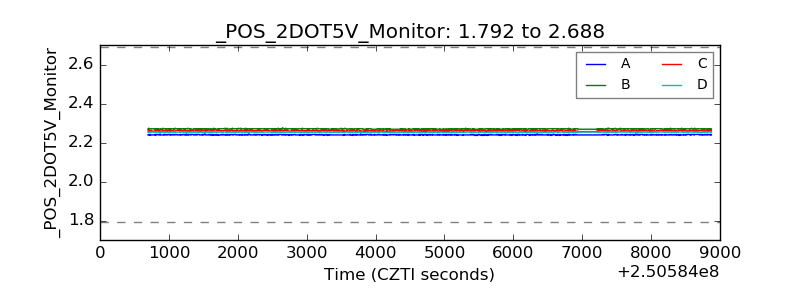 |
| +5 Volts monitor | 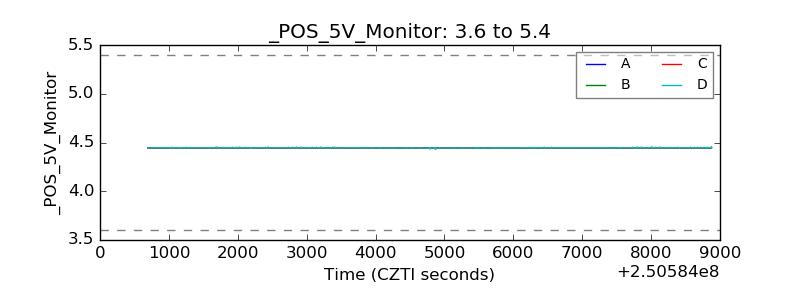 |
| _ROLL_ROT | 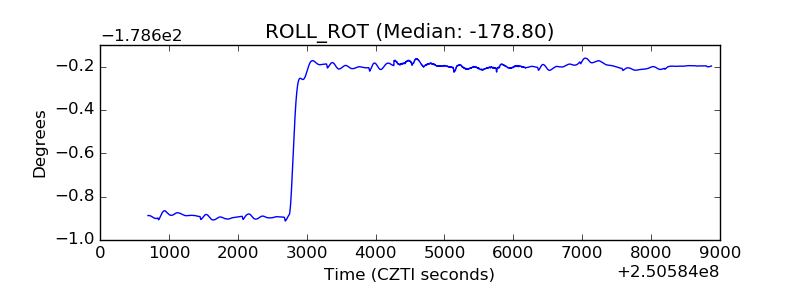 |
| _Roll_DEC | 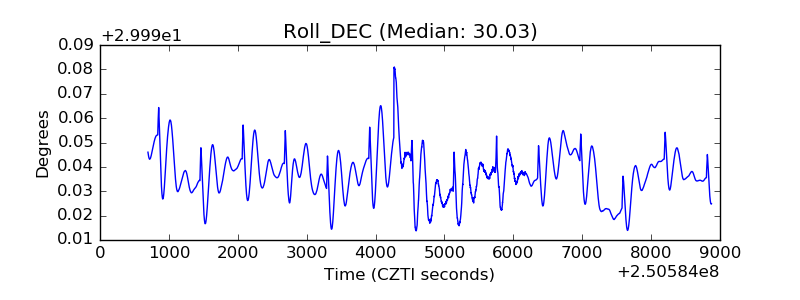 |
| _Roll_RA | 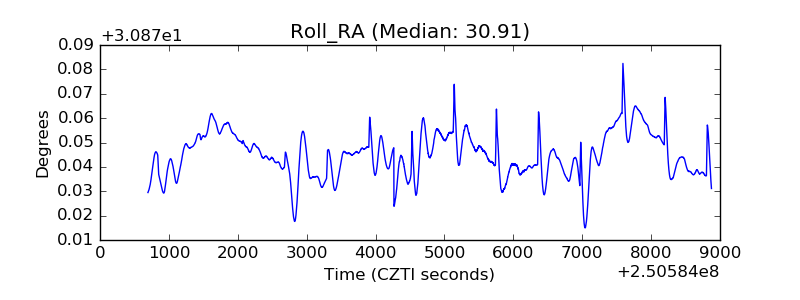 |
| Veto Counter | 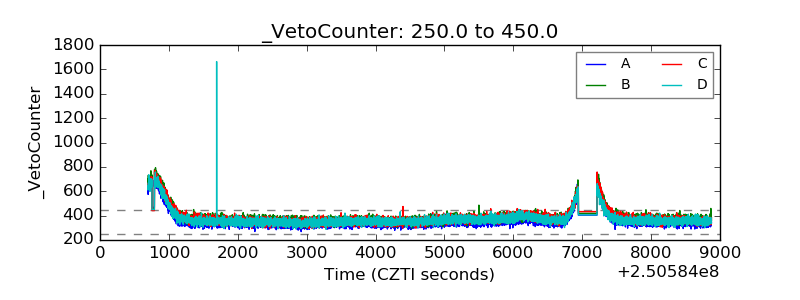 |