| Param | Original file | Final file |
|---|---|---|
| Filename | modeM0/AS1A04_088T05_9000001764_11906cztM0_level2.evt | modeM0/AS1A04_088T05_9000001764_11906cztM0_level2_quad_clean.evt |
| Size (bytes) | 457,303,680 | 70,755,840 |
| Size | 436.1 MB | 67.5 MB |
| Events in quadrant A | 3,224,951 | 435,889 |
| Events in quadrant B | 4,032,617 | 420,449 |
| Events in quadrant C | 2,645,140 | 445,298 |
| Events in quadrant D | 3,544,715 | 427,353 |
| Mode M9 | |||
|---|---|---|---|
| Quadrant | BADHDUFLAG | Total packets | Discarded packets |
| A | 0 | 5 | 0 |
| B | 0 | 4 | 0 |
| C | 0 | 4 | 0 |
| D | 0 | 4 | 0 |
| Mode M0 | |||
|---|---|---|---|
| Quadrant | BADHDUFLAG | Total packets | Discarded packets |
| A | 0 | 13359 | 1 |
| B | 0 | 15747 | 1 |
| C | 0 | 12073 | 1 |
| D | 0 | 14580 | 1 |
| Mode SS | |||
|---|---|---|---|
| Quadrant | BADHDUFLAG | Total packets | Discarded packets |
| A | 0 | 122 | 0 |
| B | 0 | 122 | 0 |
| C | 0 | 122 | 0 |
| D | 0 | 122 | 0 |
| Quadrant | Total seconds | Saturated seconds | Saturation percentage |
|---|---|---|---|
| A | 5917 | 180 | 3.042082% |
| B | 5917 | 414 | 6.996789% |
| C | 5917 | 94 | 1.588643% |
| D | 5917 | 216 | 3.650499% |
Noise dominated data is calculated using 1-second bins in cleaned event files. If a bin has >2000 counts, and if more than 50% of those come from <1% of pixels, then it is considered to be noise-dominated and hence unusable.
| Quadrant | # 1 sec bins | Bins with >0 counts | Bins with >2000 counts | High rate bins dominated by noise | Noise dominated (total time) | Noise dominated (detector-on time) | Marked lightcurve |
|---|---|---|---|---|---|---|---|
| A | 6188 | 5918 | 8 | 8 | 0.13% | 0.14% | 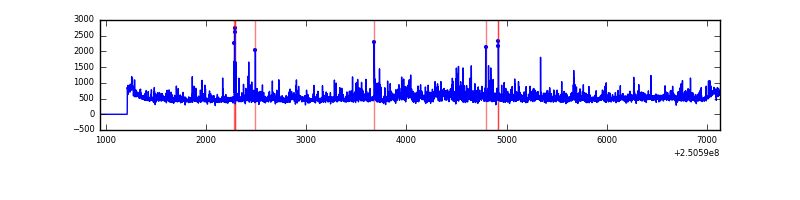 |
| B | 6188 | 5918 | 219 | 219 | 3.54% | 3.70% | 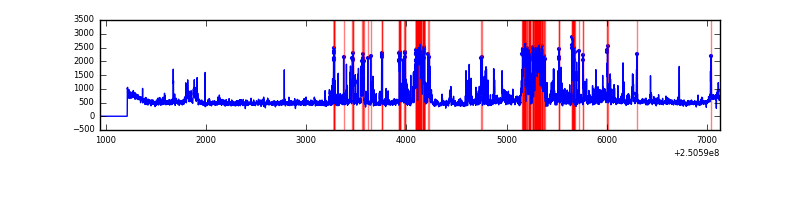 |
| C | 6188 | 5918 | 0 | 0 | 0.00% | 0.00% |  |
| D | 6188 | 5919 | 128 | 128 | 2.07% | 2.16% | 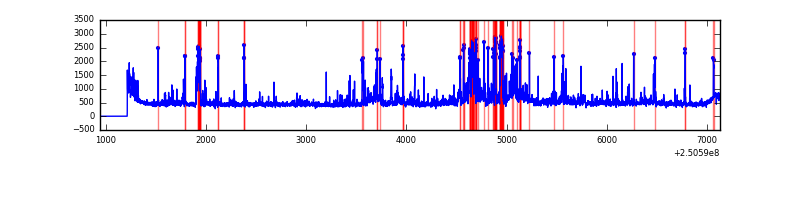 |
Top three noisy pixels from each quadrant. If the there are fewer than three noisy pixels in the level2.evt file, extra rows are filled as -1
| Pixel properties | Quadrant properties | ||||||
|---|---|---|---|---|---|---|---|
| Quadrant | DetID | PixID | Counts | Sigma | Mean | Median | Sigma |
| A | 8 | 15 | 149041 | 1048.21 | 687 | 669 | 141.5 |
| A | 1 | 162 | 148302 | 1042.99 | 687 | 669 | 141.5 |
| A | 1 | 178 | 80397 | 563.26 | 687 | 669 | 141.5 |
| B | 4 | 239 | 992796 | 7479.17 | 678 | 660 | 132.7 |
| B | 10 | 252 | 152940 | 1147.95 | 678 | 660 | 132.7 |
| B | 15 | 204 | 73447 | 548.7 | 678 | 660 | 132.7 |
| C | 13 | 61 | 5061 | 27.71 | 678 | 681 | 158.0 |
| C | 3 | 202 | 1693 | 6.4 | 678 | 681 | 158.0 |
| C | -1 | -1 | -1 | -1.0 | 678 | 681 | 158.0 |
| D | 1 | 52 | 455949 | 2860.98 | 668 | 650 | 159.1 |
| D | 13 | 249 | 244703 | 1533.57 | 668 | 650 | 159.1 |
| D | 13 | 104 | 115144 | 719.45 | 668 | 650 | 159.1 |
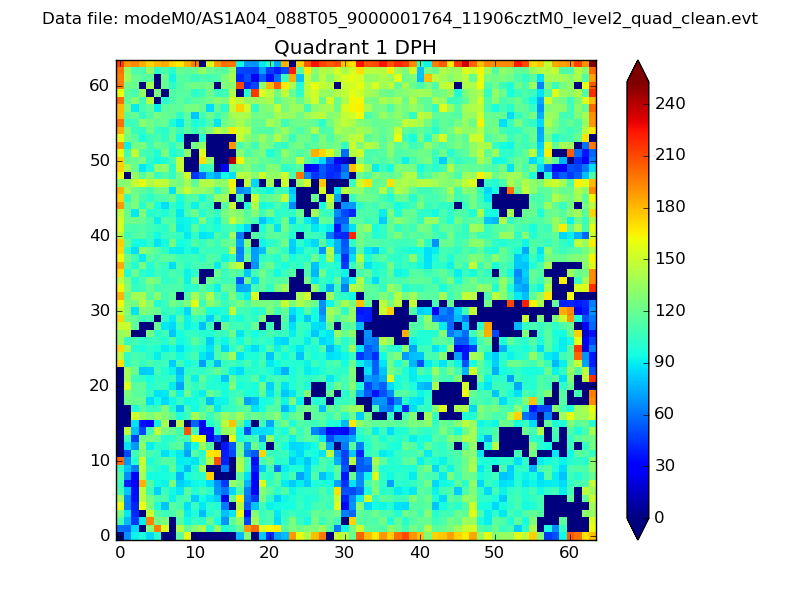
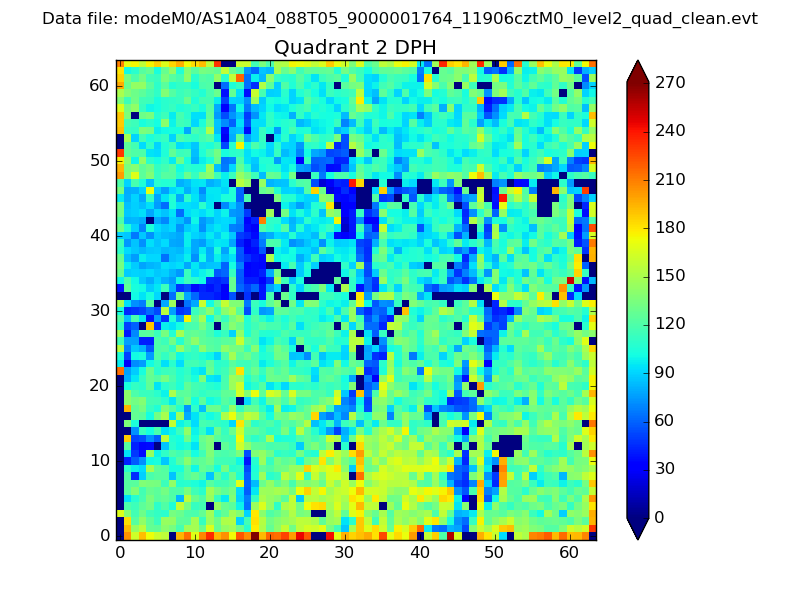
Histogram calculated using DETX and DETY for each event in the final _common_clean file
| Quadrant A | 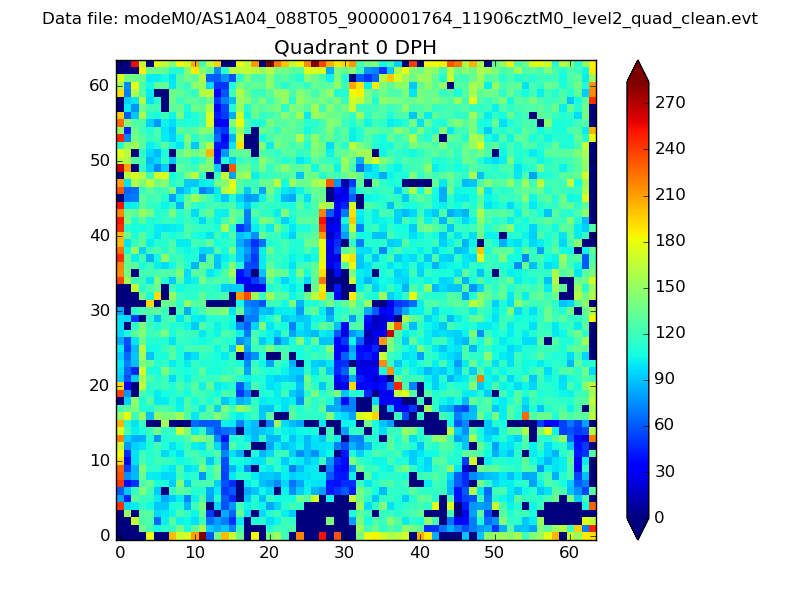 |
 |
Quadrant B |
|---|---|---|---|
| Quadrant D | 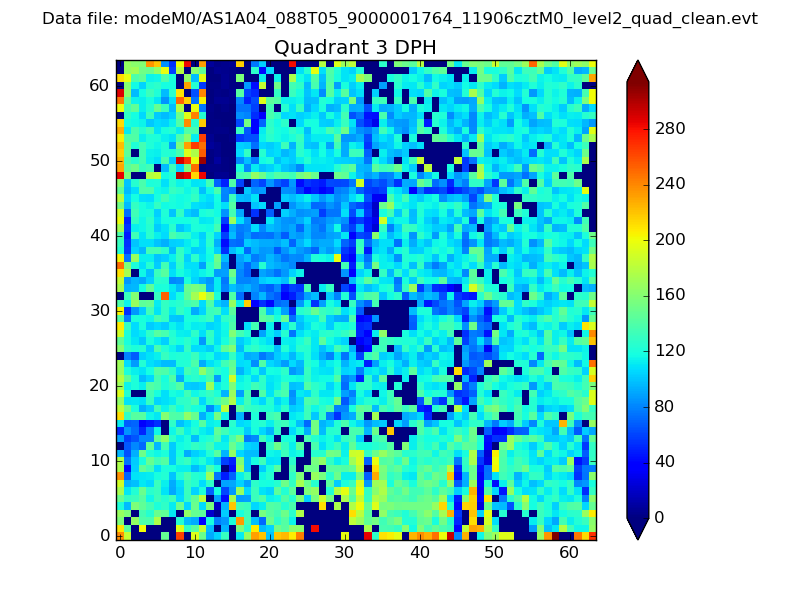 |
 |
Quadrant C |
| Plot type | Count rate plots | Images |
|---|---|---|
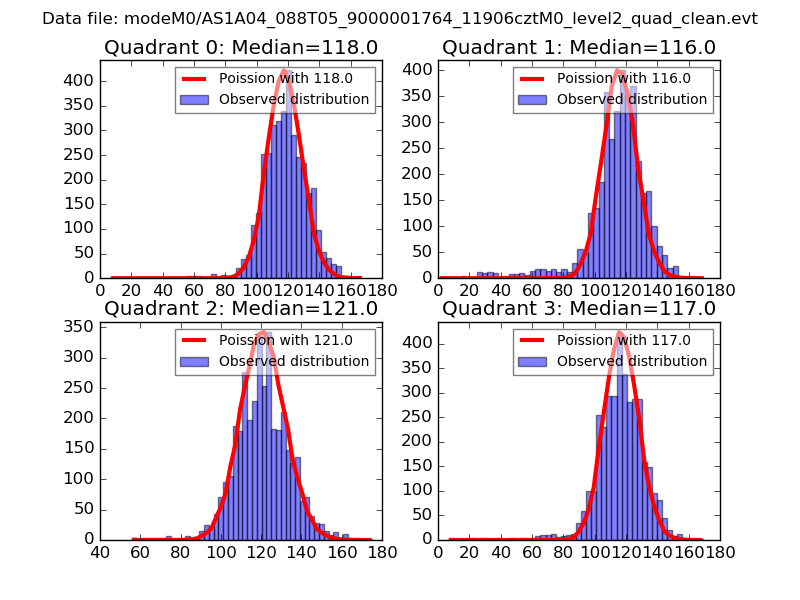
| Comparison with Poisson distribution Blue bars denote a histogram of data divided into 1 sec bins. Red curve is a Poisson curve with rate = median count rate of data. |
 |
 |
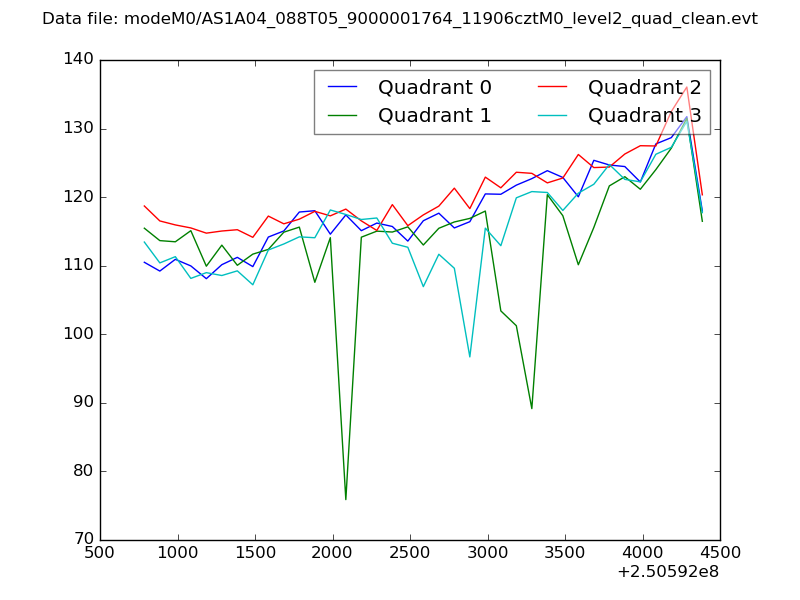
| Quadrant-wise count rates Data is divided into 100 sec bins |
 |
|
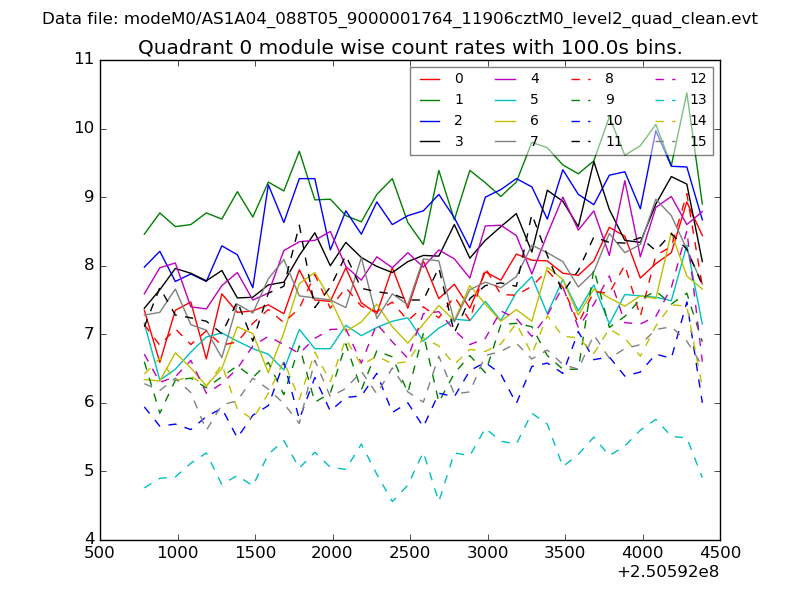
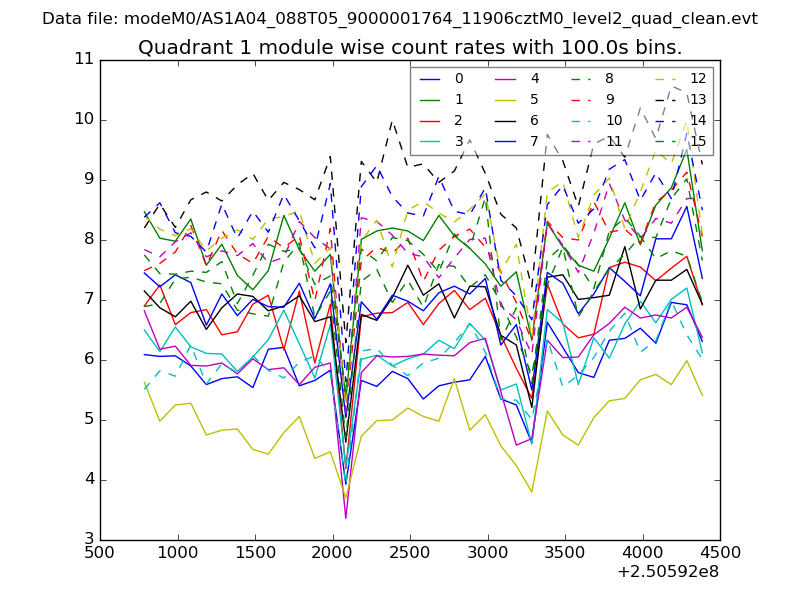
| Module-wise count rates for Quadrant A Data is divided into 100 sec bins |
 |
 |
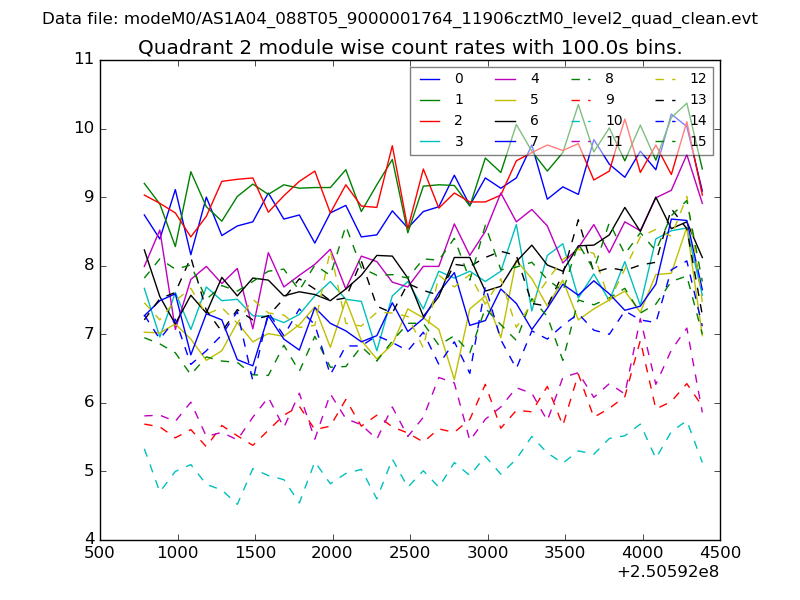
| Module-wise count rates for Quadrant B Data is divided into 100 sec bins |
 |
 |
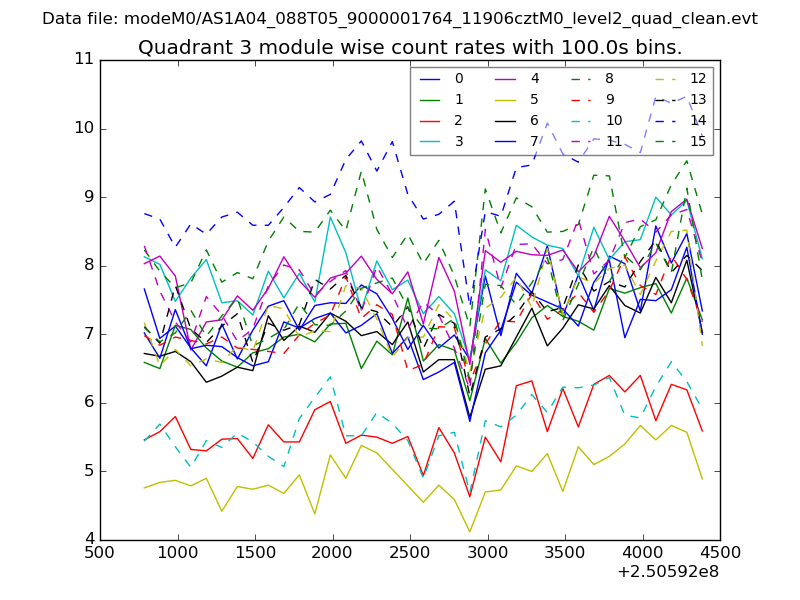
| Module-wise count rates for Quadrant C Data is divided into 100 sec bins |
 |
 |
| Module-wise count rates for Quadrant D Data is divided into 100 sec bins |
 |
 |
| Parameter | Plot |
|---|---|
| CZT HV Monitor | 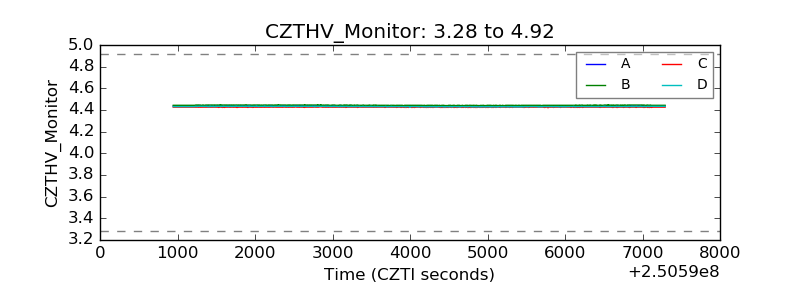 |
| D_VDD | 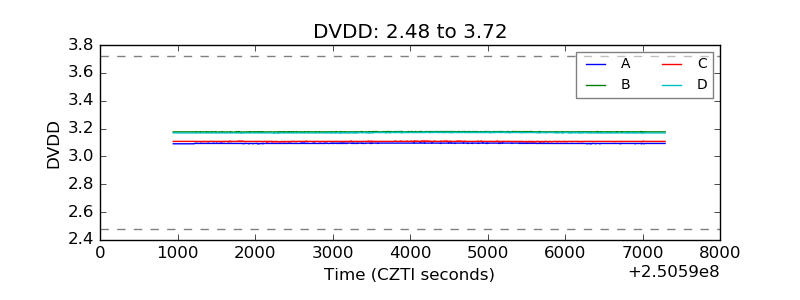 |
| Temperature 1 | 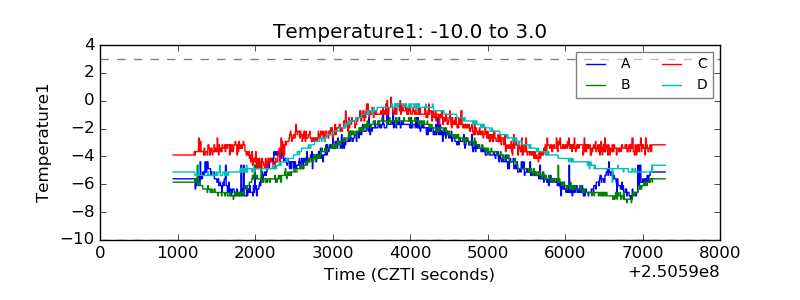 |
| Veto HV Monitor | 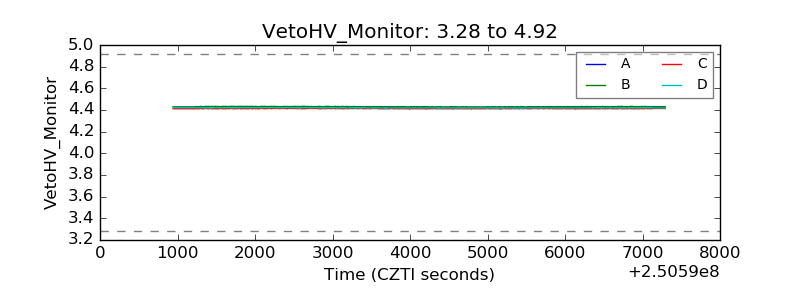 |
| Veto LLD | 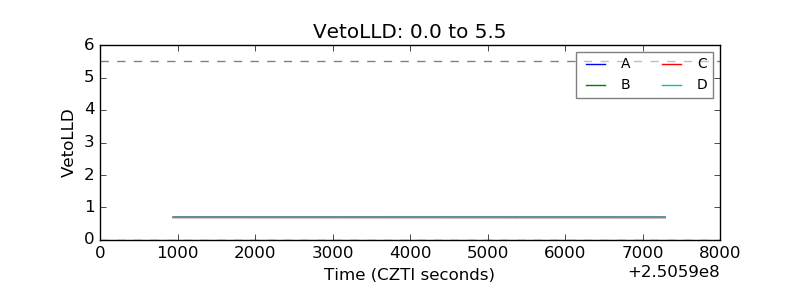 |
| Alpha Counter | 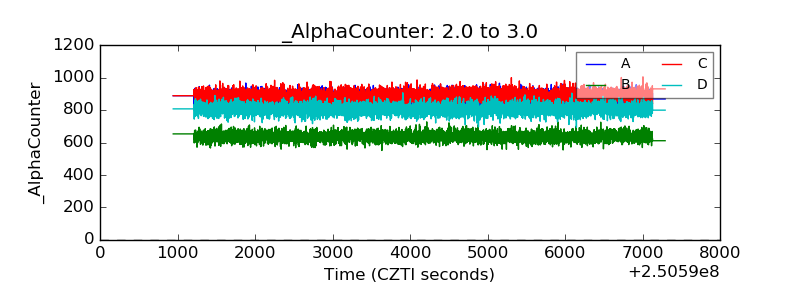 |
| _CPM_Rate | 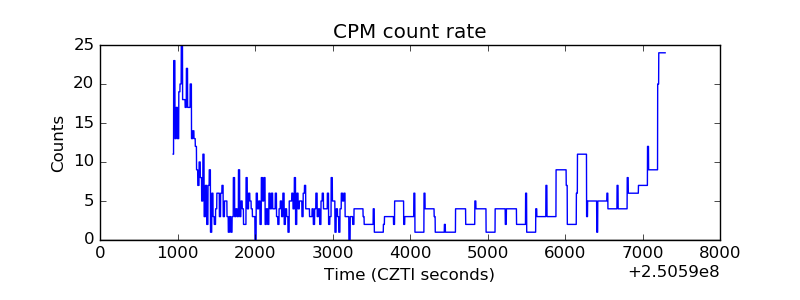 |
| CZT Counter | 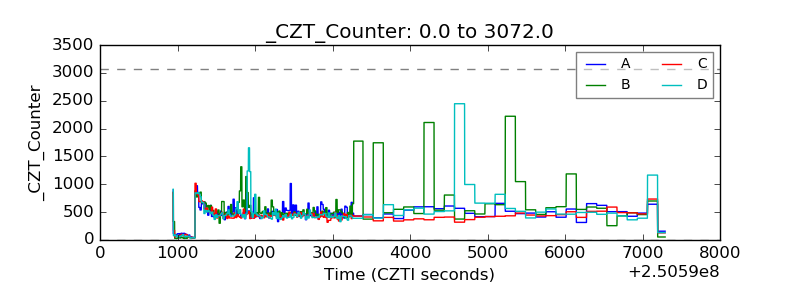 |
| +2.5 Volts monitor |  |
| +5 Volts monitor |  |
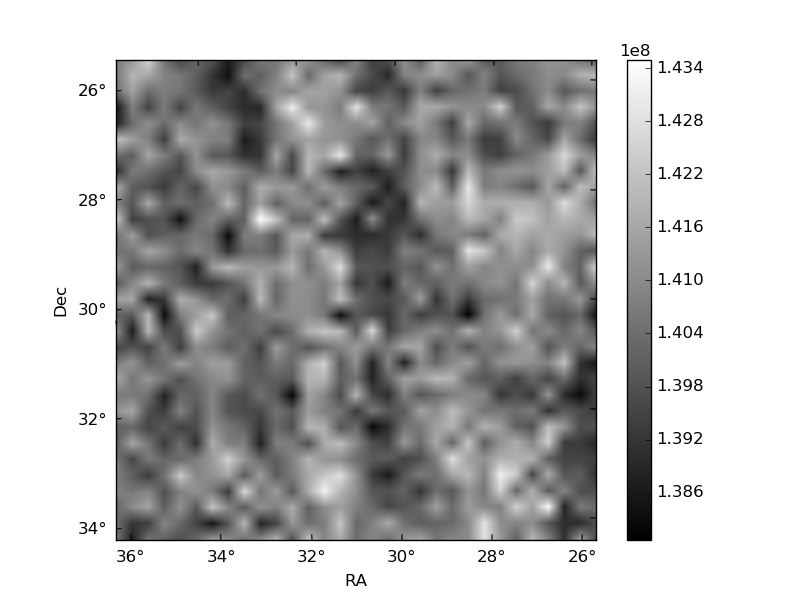
| _ROLL_ROT | 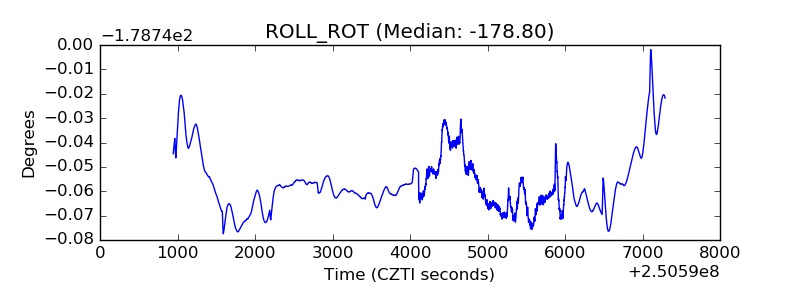 |
| _Roll_DEC | 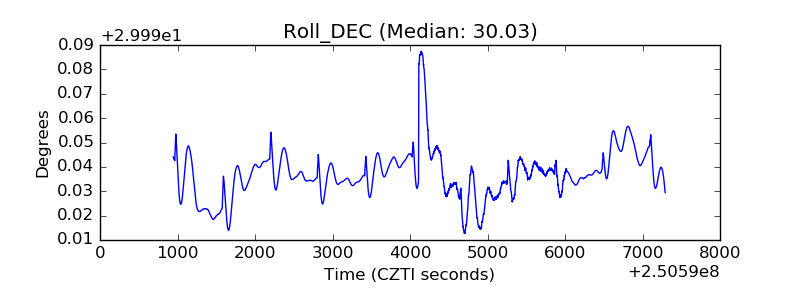 |
| _Roll_RA | 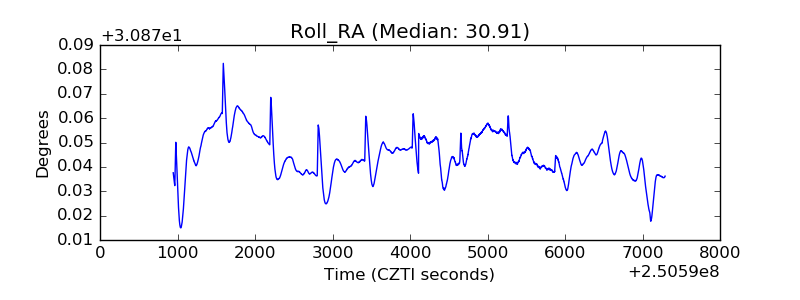 |
| Veto Counter | 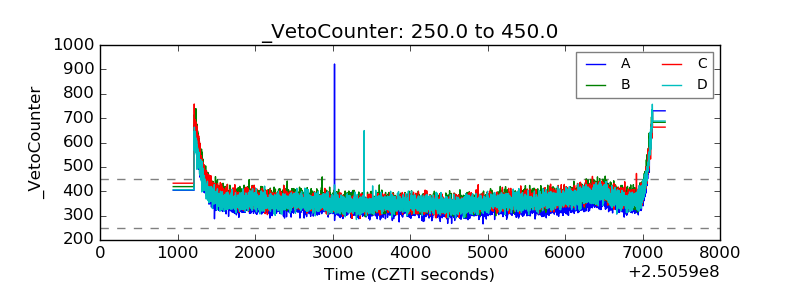 |