| Param | Original file | Final file |
|---|---|---|
| Filename | modeM0/AS1A04_088T05_9000001764_11907cztM0_level2.evt | modeM0/AS1A04_088T05_9000001764_11907cztM0_level2_quad_clean.evt |
| Size (bytes) | 1,460,217,600 | 244,791,360 |
| Size | 1.4 GB | 233.5 MB |
| Events in quadrant A | 10,864,477 | 1,535,968 |
| Events in quadrant B | 12,099,726 | 1,507,305 |
| Events in quadrant C | 8,555,736 | 1,572,522 |
| Events in quadrant D | 11,416,456 | 1,485,730 |
| Mode M9 | |||
|---|---|---|---|
| Quadrant | BADHDUFLAG | Total packets | Discarded packets |
| A | 0 | 27 | 0 |
| B | 0 | 27 | 0 |
| C | 0 | 27 | 0 |
| D | 0 | 27 | 0 |
| Mode M0 | |||
|---|---|---|---|
| Quadrant | BADHDUFLAG | Total packets | Discarded packets |
| A | 0 | 44451 | 5 |
| B | 0 | 48079 | 4 |
| C | 0 | 38723 | 4 |
| D | 0 | 46819 | 4 |
| Mode SS | |||
|---|---|---|---|
| Quadrant | BADHDUFLAG | Total packets | Discarded packets |
| A | 0 | 392 | 0 |
| B | 0 | 392 | 0 |
| C | 0 | 392 | 0 |
| D | 0 | 392 | 0 |
| Quadrant | Total seconds | Saturated seconds | Saturation percentage |
|---|---|---|---|
| A | 19036 | 603 | 3.167682% |
| B | 19036 | 987 | 5.184913% |
| C | 19036 | 133 | 0.698676% |
| D | 19036 | 785 | 4.123765% |
Noise dominated data is calculated using 1-second bins in cleaned event files. If a bin has >2000 counts, and if more than 50% of those come from <1% of pixels, then it is considered to be noise-dominated and hence unusable.
| Quadrant | # 1 sec bins | Bins with >0 counts | Bins with >2000 counts | High rate bins dominated by noise | Noise dominated (total time) | Noise dominated (detector-on time) | Marked lightcurve |
|---|---|---|---|---|---|---|---|
| A | 21843 | 19037 | 180 | 180 | 0.82% | 0.95% | 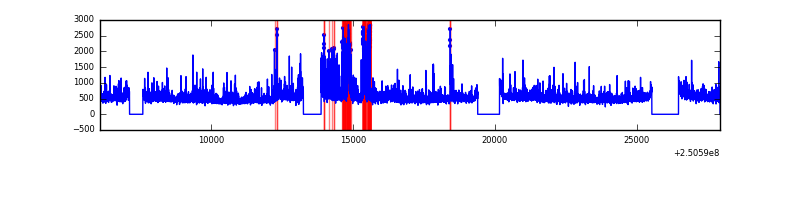 |
| B | 21844 | 19038 | 544 | 544 | 2.49% | 2.86% | 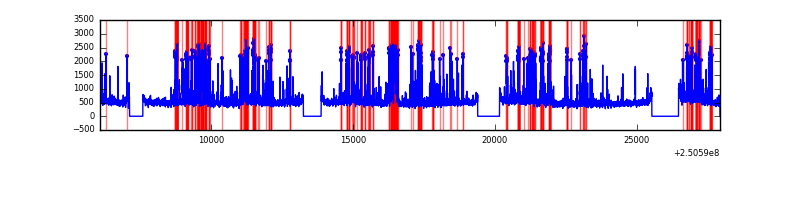 |
| C | 21844 | 19038 | 0 | 0 | 0.00% | 0.00% | 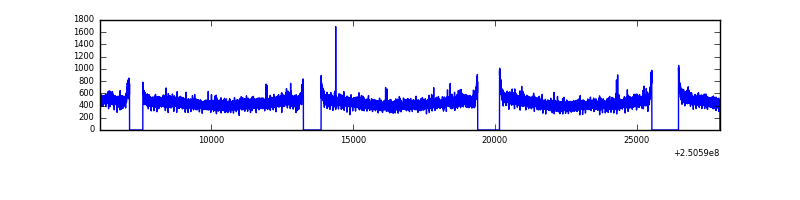 |
| D | 21843 | 19037 | 464 | 464 | 2.12% | 2.44% | 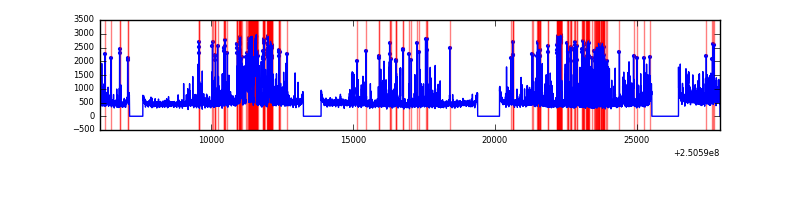 |
Top three noisy pixels from each quadrant. If the there are fewer than three noisy pixels in the level2.evt file, extra rows are filled as -1
| Pixel properties | Quadrant properties | ||||||
|---|---|---|---|---|---|---|---|
| Quadrant | DetID | PixID | Counts | Sigma | Mean | Median | Sigma |
| A | 14 | 63 | 999754 | 2212.51 | 2228 | 2175 | 450.9 |
| A | 8 | 15 | 426085 | 940.18 | 2228 | 2175 | 450.9 |
| A | 1 | 162 | 337737 | 744.23 | 2228 | 2175 | 450.9 |
| B | 4 | 239 | 2659846 | 6333.81 | 2211 | 2157 | 419.6 |
| B | 15 | 204 | 202593 | 477.68 | 2211 | 2157 | 419.6 |
| B | 5 | 8 | 116882 | 273.41 | 2211 | 2157 | 419.6 |
| C | 13 | 61 | 15806 | 26.76 | 2195 | 2205 | 508.3 |
| C | 3 | 202 | 5536 | 6.55 | 2195 | 2205 | 508.3 |
| C | -1 | -1 | -1 | -1.0 | 2195 | 2205 | 508.3 |
| D | 1 | 52 | 1854433 | 3537.77 | 2166 | 2102 | 523.6 |
| D | 8 | 195 | 303912 | 576.43 | 2166 | 2102 | 523.6 |
| D | 13 | 249 | 208635 | 394.46 | 2166 | 2102 | 523.6 |
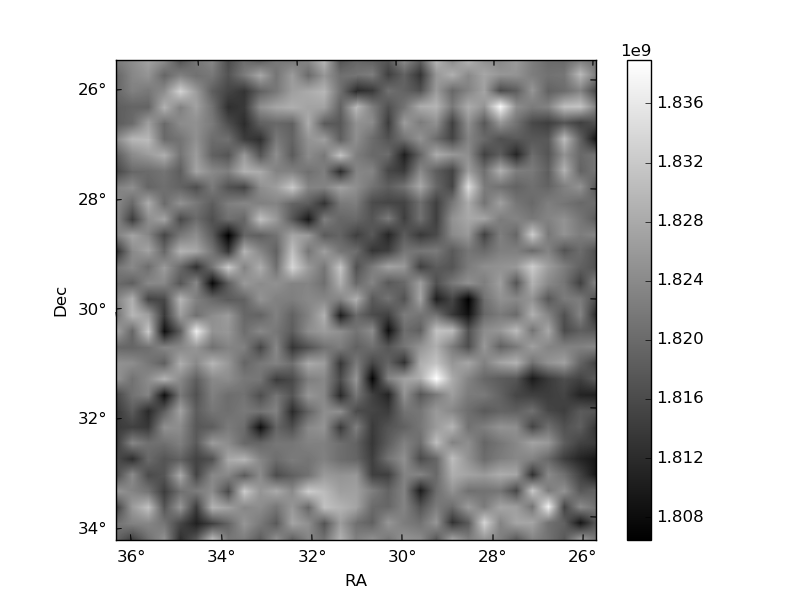
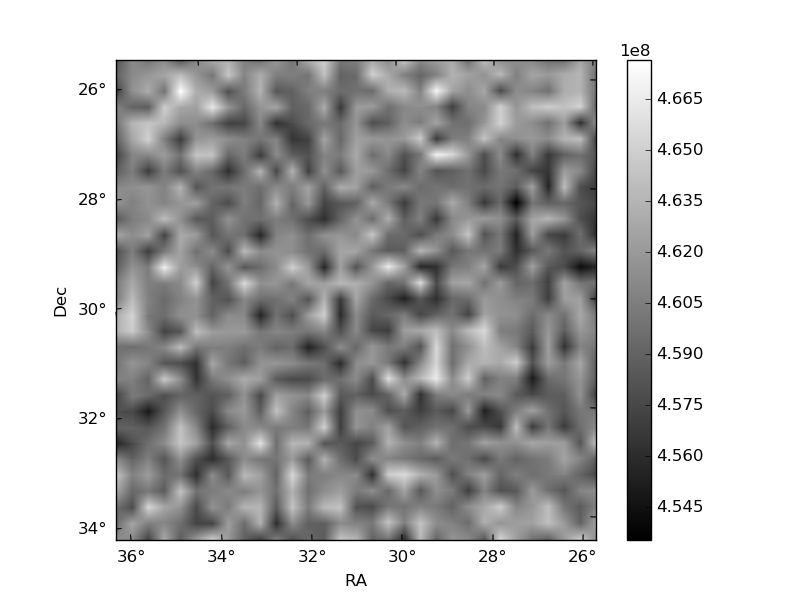
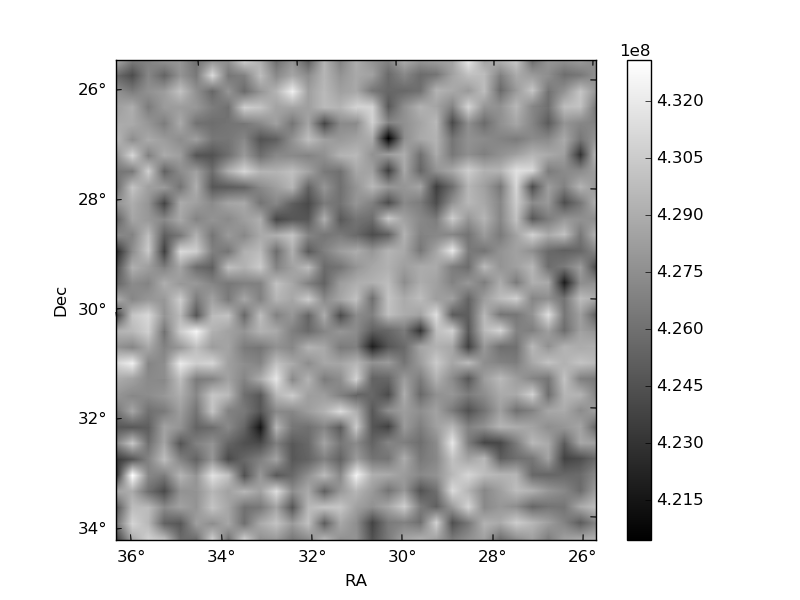
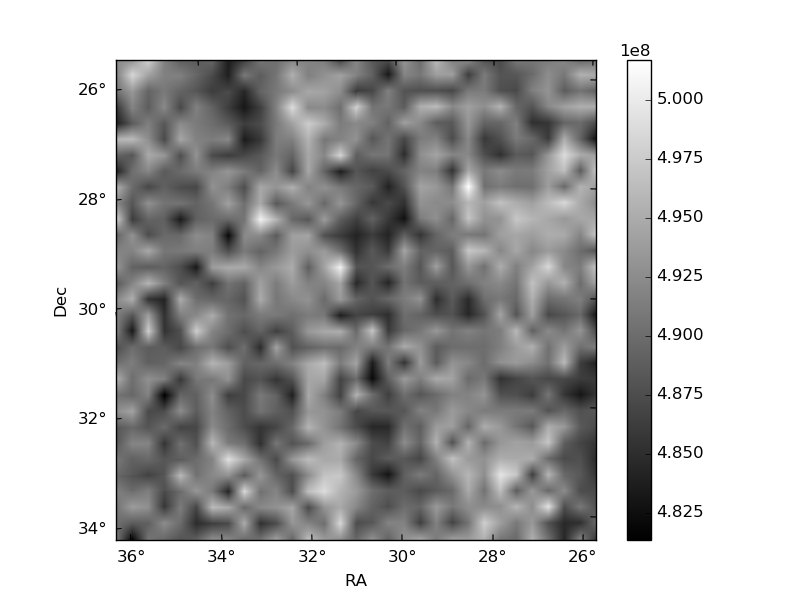
Histogram calculated using DETX and DETY for each event in the final _common_clean file
| Quadrant A | 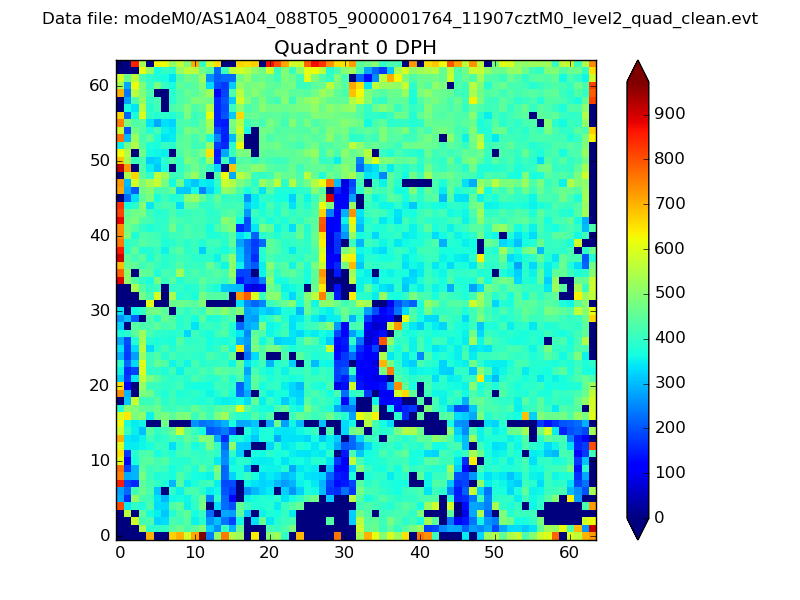 |
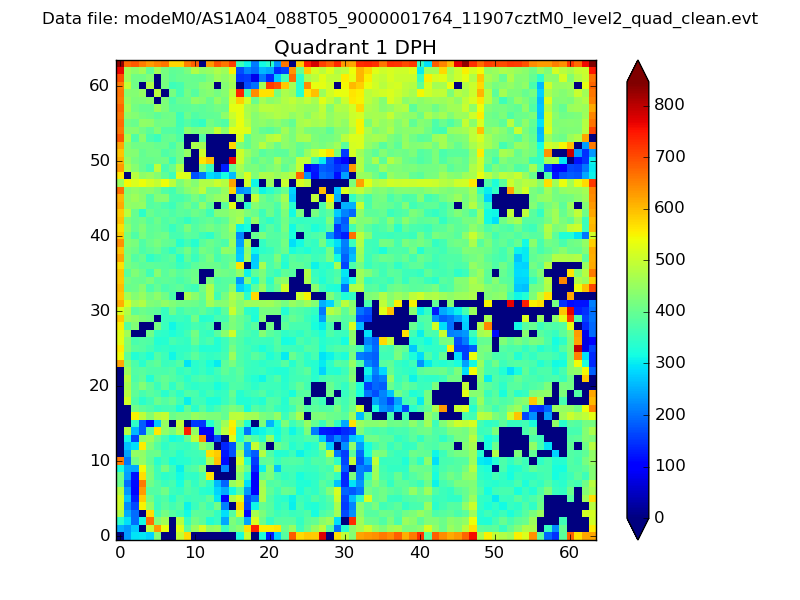 |
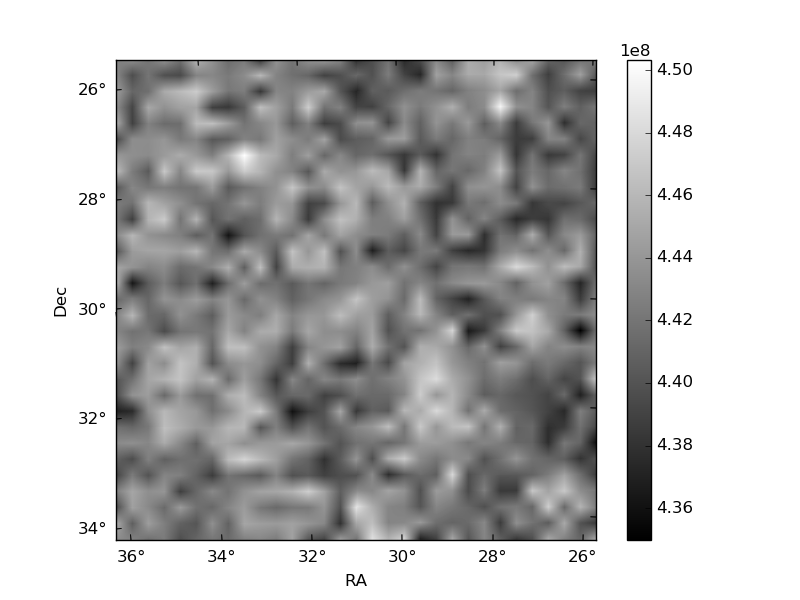
Quadrant B |
|---|---|---|---|
| Quadrant D | 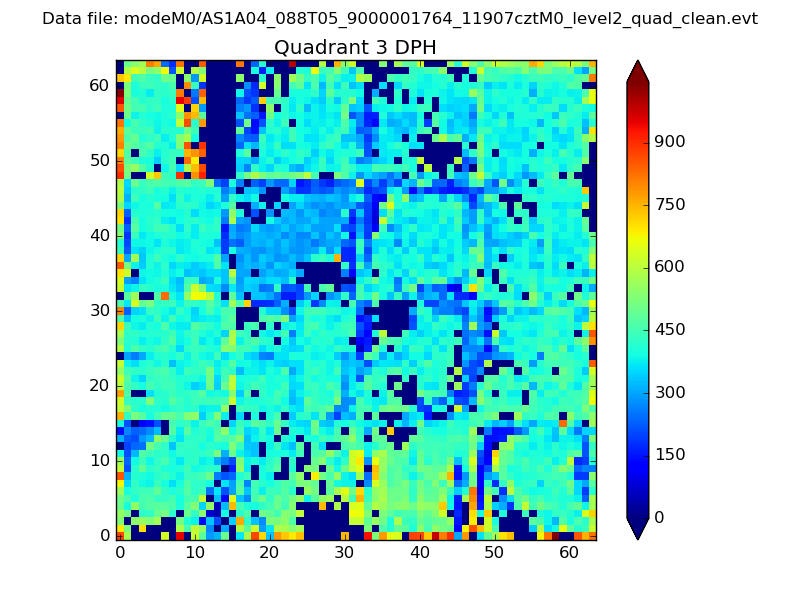 |
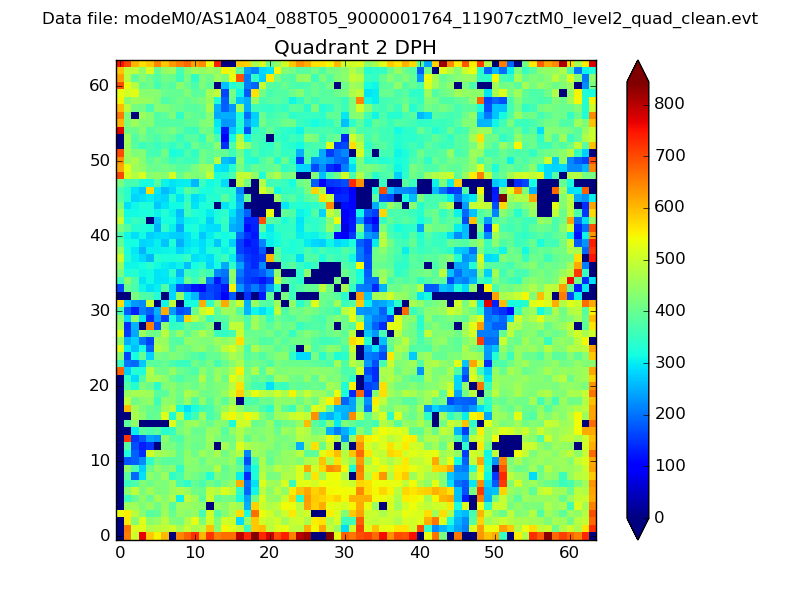 |
Quadrant C |
| Plot type | Count rate plots | Images |
|---|---|---|
| Comparison with Poisson distribution Blue bars denote a histogram of data divided into 1 sec bins. Red curve is a Poisson curve with rate = median count rate of data. |
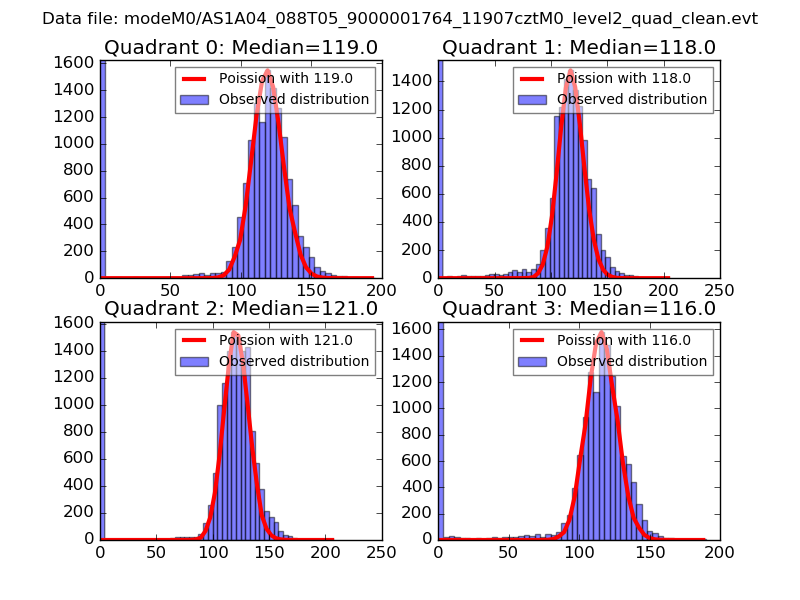 |
 |
| Quadrant-wise count rates Data is divided into 100 sec bins |
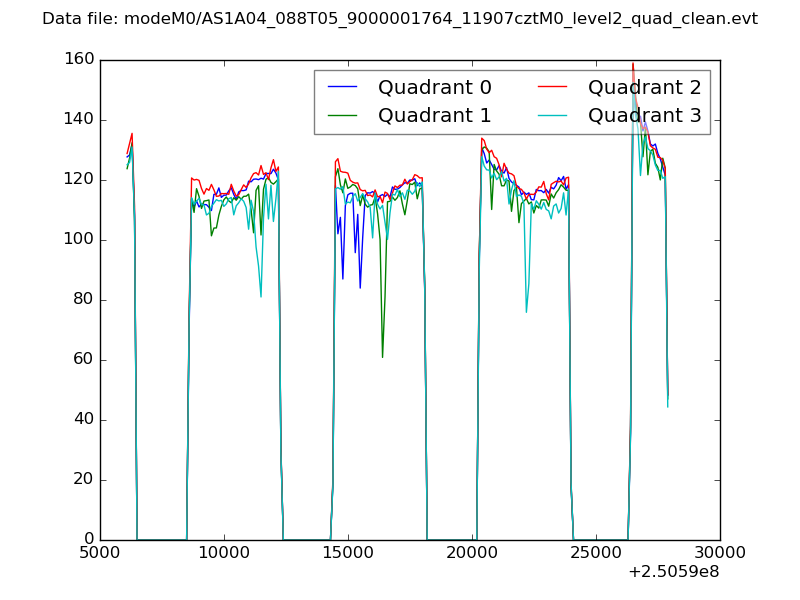 |
|
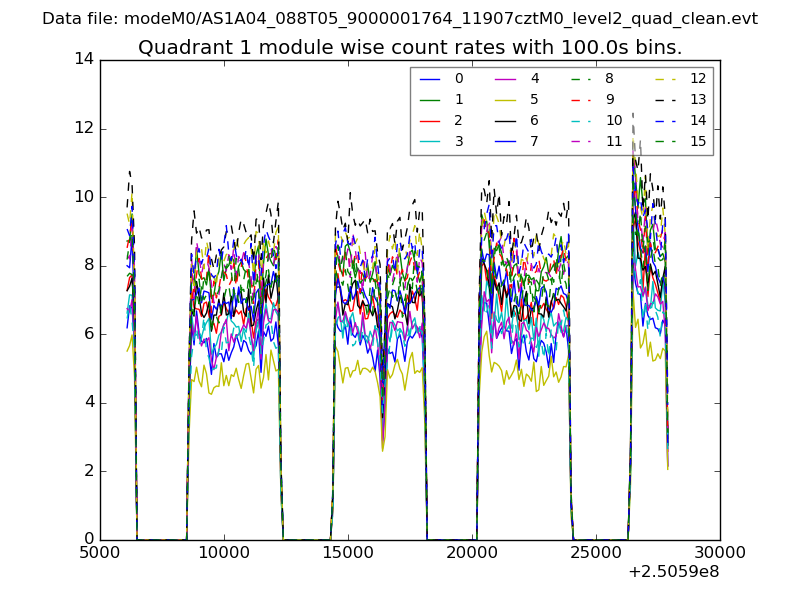
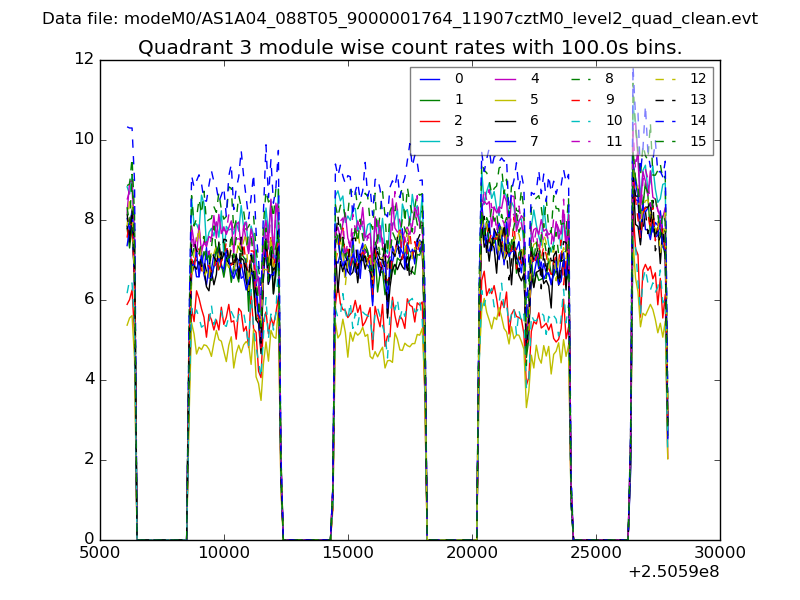
| Module-wise count rates for Quadrant A Data is divided into 100 sec bins |
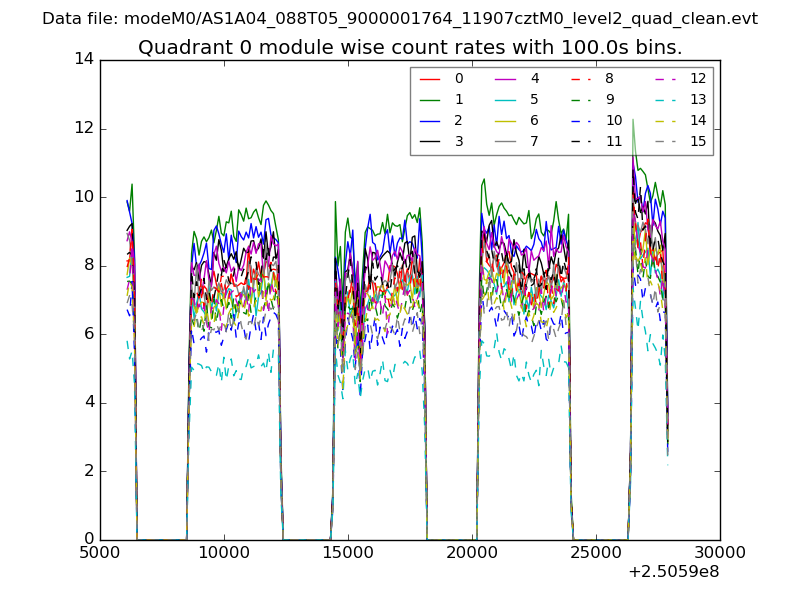 |
 |
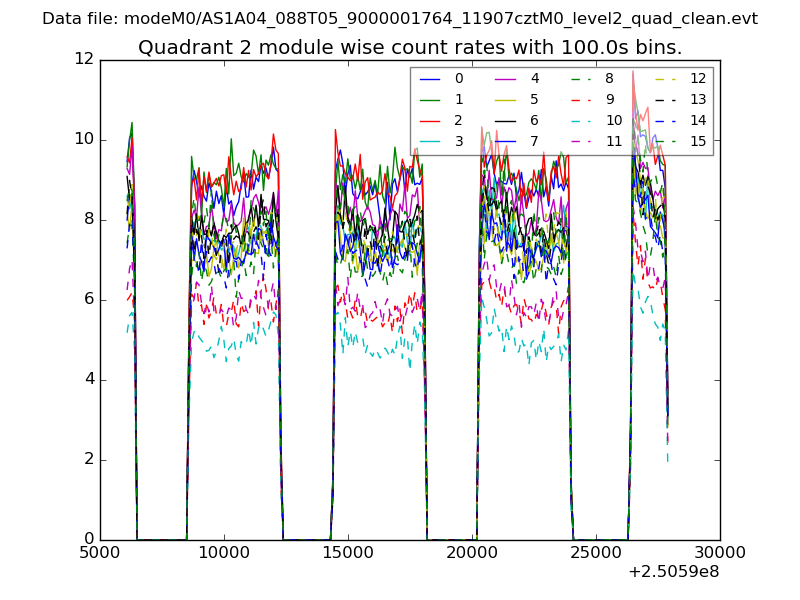
| Module-wise count rates for Quadrant B Data is divided into 100 sec bins |
 |
 |
| Module-wise count rates for Quadrant C Data is divided into 100 sec bins |
 |
 |
| Module-wise count rates for Quadrant D Data is divided into 100 sec bins |
 |
 |
| Parameter | Plot |
|---|---|
| CZT HV Monitor | 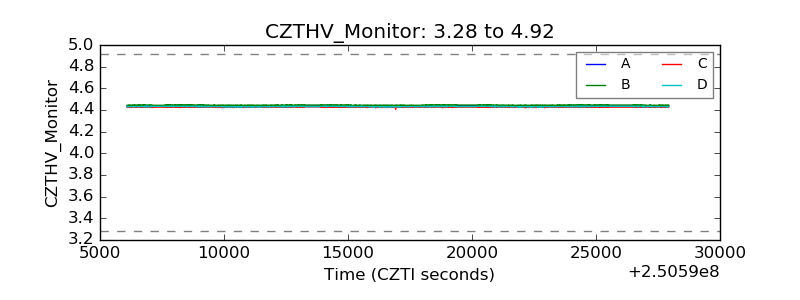 |
| D_VDD | 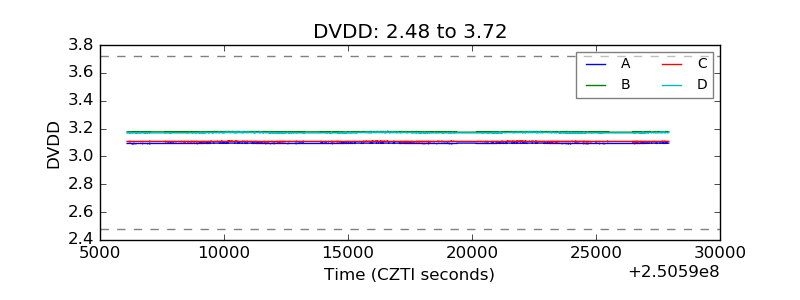 |
| Temperature 1 | 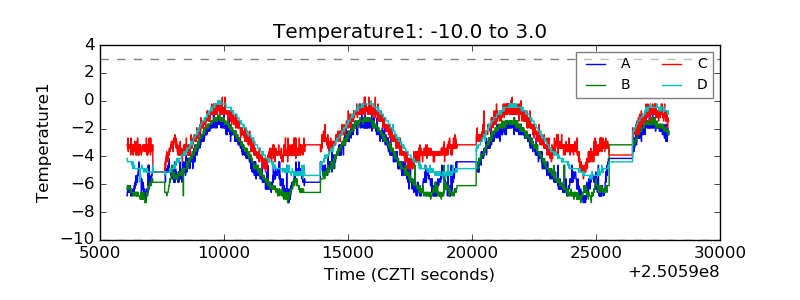 |
| Veto HV Monitor | 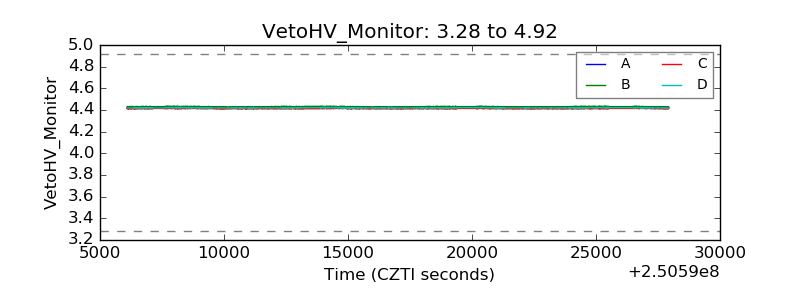 |
| Veto LLD | 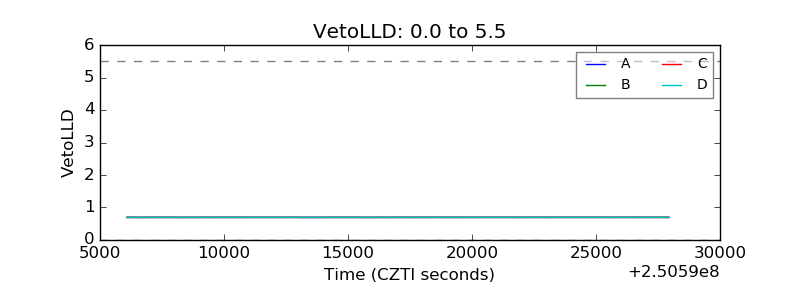 |
| Alpha Counter | 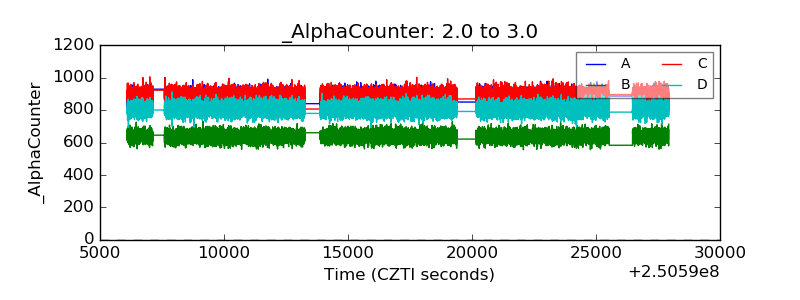 |
| _CPM_Rate | 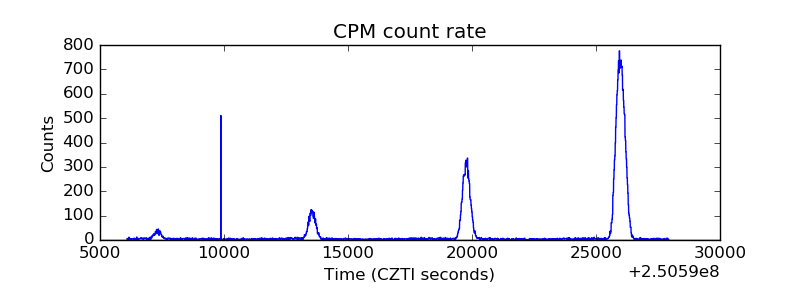 |
| CZT Counter |  |
| +2.5 Volts monitor |  |
| +5 Volts monitor |  |
| _ROLL_ROT | 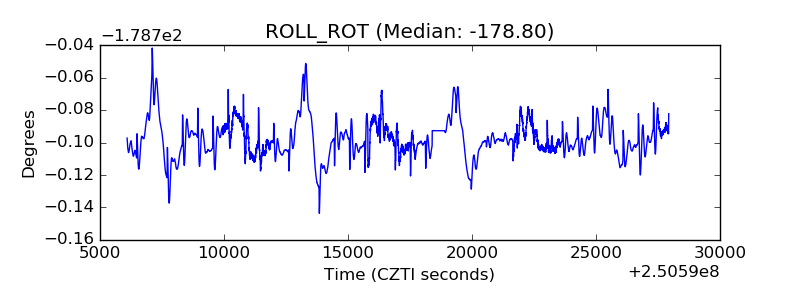 |
| _Roll_DEC | 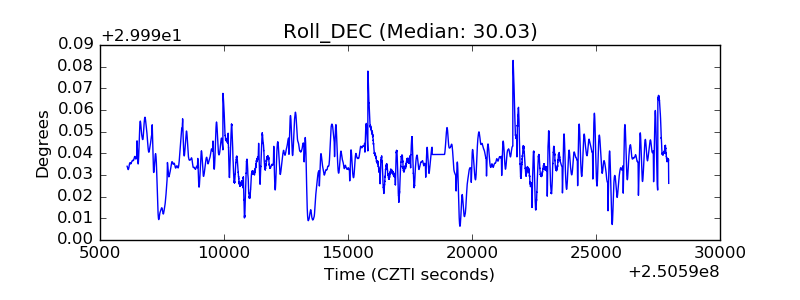 |
| _Roll_RA | 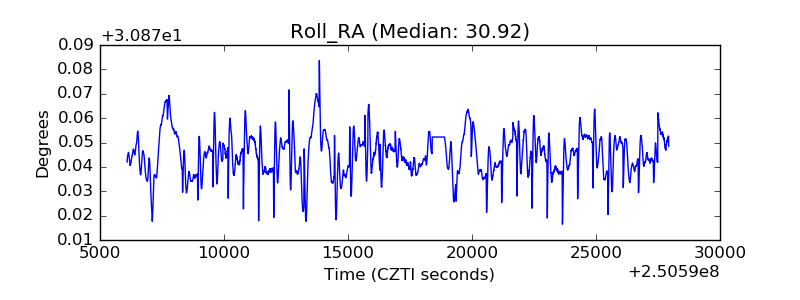 |
| Veto Counter | 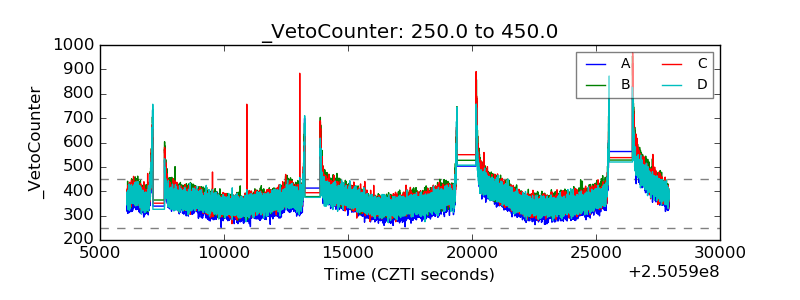 |