| Param | Original file | Final file |
|---|---|---|
| Filename | modeM0/AS1A04_088T05_9000001764_11909cztM0_level2.evt | modeM0/AS1A04_088T05_9000001764_11909cztM0_level2_quad_clean.evt |
| Size (bytes) | 500,768,640 | 93,265,920 |
| Size | 477.6 MB | 88.9 MB |
| Events in quadrant A | 3,443,285 | 605,016 |
| Events in quadrant B | 4,333,868 | 584,030 |
| Events in quadrant C | 2,943,434 | 605,130 |
| Events in quadrant D | 4,007,725 | 580,537 |
| Mode M9 | |||
|---|---|---|---|
| Quadrant | BADHDUFLAG | Total packets | Discarded packets |
| A | 0 | 11 | 0 |
| B | 0 | 11 | 0 |
| C | 0 | 11 | 0 |
| D | 0 | 11 | 0 |
| Mode M0 | |||
|---|---|---|---|
| Quadrant | BADHDUFLAG | Total packets | Discarded packets |
| A | 0 | 14405 | 2 |
| B | 0 | 17276 | 1 |
| C | 0 | 13180 | 1 |
| D | 0 | 16269 | 1 |
| Mode SS | |||
|---|---|---|---|
| Quadrant | BADHDUFLAG | Total packets | Discarded packets |
| A | 0 | 130 | 0 |
| B | 0 | 130 | 0 |
| C | 0 | 130 | 0 |
| D | 0 | 130 | 0 |
| Quadrant | Total seconds | Saturated seconds | Saturation percentage |
|---|---|---|---|
| A | 6449 | 65 | 1.007908% |
| B | 6449 | 327 | 5.070554% |
| C | 6449 | 27 | 0.418670% |
| D | 6449 | 176 | 2.729105% |
Noise dominated data is calculated using 1-second bins in cleaned event files. If a bin has >2000 counts, and if more than 50% of those come from <1% of pixels, then it is considered to be noise-dominated and hence unusable.
| Quadrant | # 1 sec bins | Bins with >0 counts | Bins with >2000 counts | High rate bins dominated by noise | Noise dominated (total time) | Noise dominated (detector-on time) | Marked lightcurve |
|---|---|---|---|---|---|---|---|
| A | 7535 | 6450 | 2 | 2 | 0.03% | 0.03% | 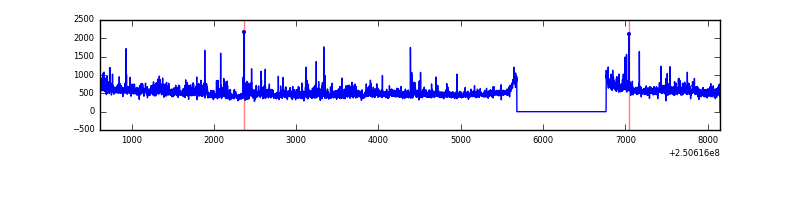 |
| B | 7535 | 6450 | 200 | 200 | 2.65% | 3.10% | 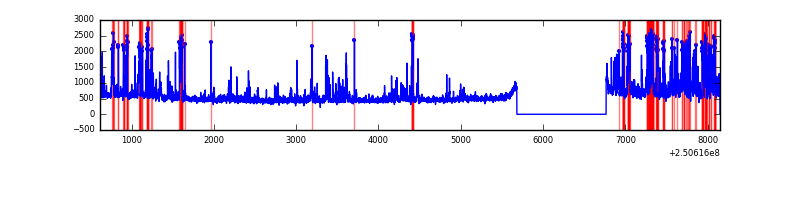 |
| C | 7535 | 6450 | 0 | 0 | 0.00% | 0.00% | 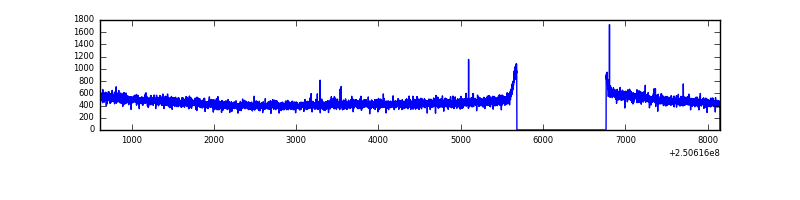 |
| D | 7535 | 6450 | 117 | 117 | 1.55% | 1.81% | 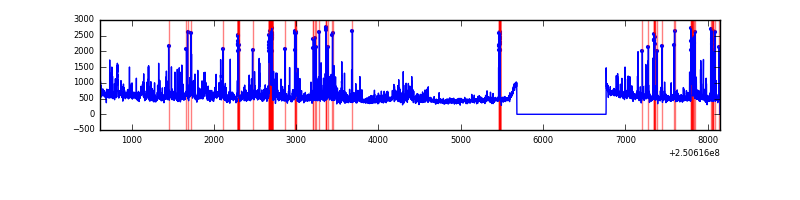 |
Top three noisy pixels from each quadrant. If the there are fewer than three noisy pixels in the level2.evt file, extra rows are filled as -1
| Pixel properties | Quadrant properties | ||||||
|---|---|---|---|---|---|---|---|
| Quadrant | DetID | PixID | Counts | Sigma | Mean | Median | Sigma |
| A | 8 | 15 | 157965 | 991.38 | 778 | 761 | 158.6 |
| A | 1 | 162 | 113724 | 712.38 | 778 | 761 | 158.6 |
| A | 1 | 178 | 57073 | 355.12 | 778 | 761 | 158.6 |
| B | 4 | 239 | 876241 | 6050.12 | 760 | 739 | 144.7 |
| B | 15 | 204 | 150436 | 1034.48 | 760 | 739 | 144.7 |
| B | 5 | 8 | 91085 | 624.33 | 760 | 739 | 144.7 |
| C | 13 | 61 | 5474 | 27.22 | 754 | 759 | 173.2 |
| C | 12 | 4 | 3759 | 17.32 | 754 | 759 | 173.2 |
| C | 14 | 234 | 2445 | 9.73 | 754 | 759 | 173.2 |
| D | 1 | 52 | 423304 | 2357.01 | 753 | 734 | 179.3 |
| D | 8 | 195 | 183572 | 1019.83 | 753 | 734 | 179.3 |
| D | 13 | 249 | 143074 | 793.94 | 753 | 734 | 179.3 |
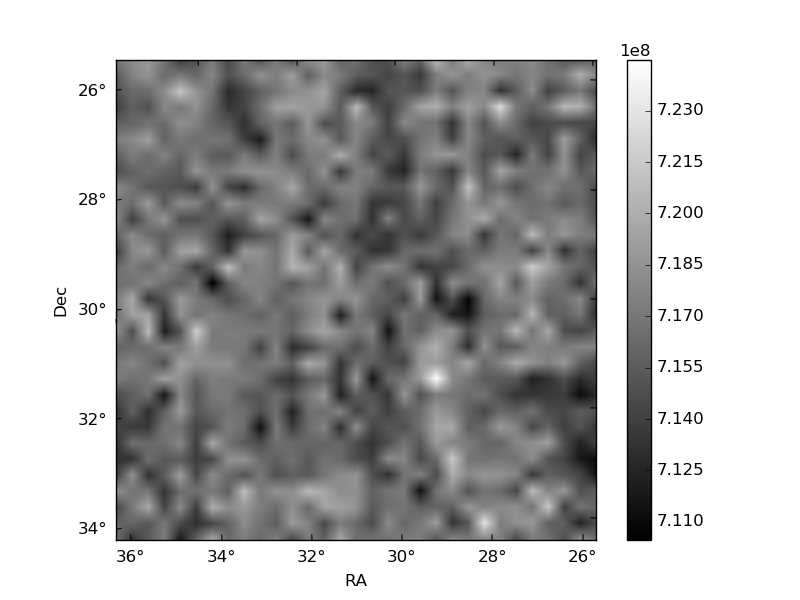
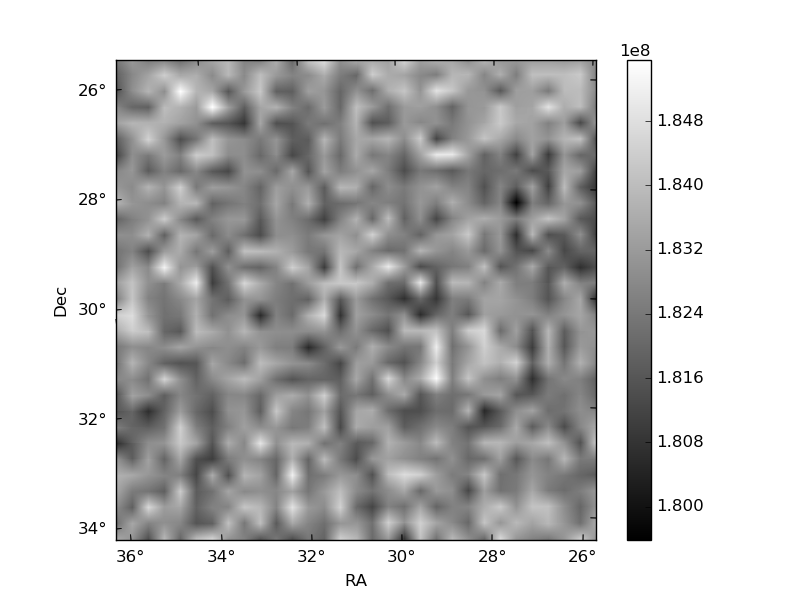
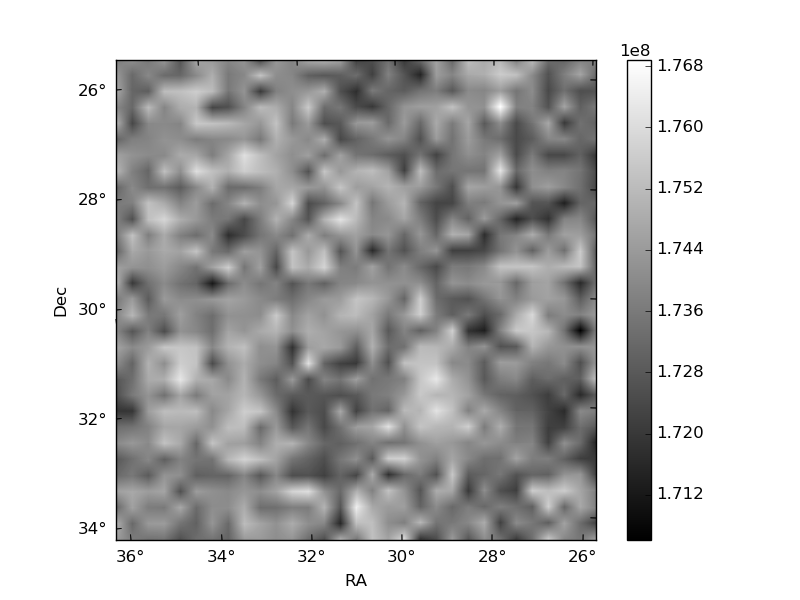
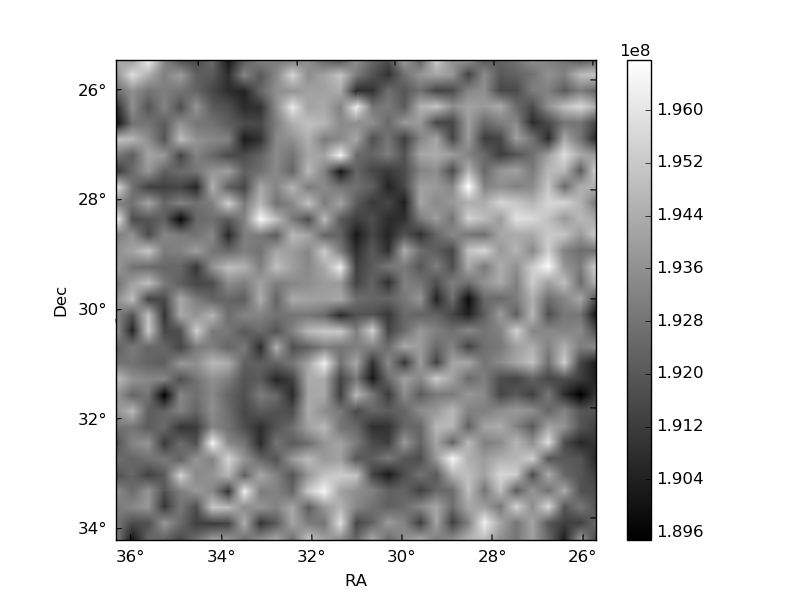
Histogram calculated using DETX and DETY for each event in the final _common_clean file
| Quadrant A | 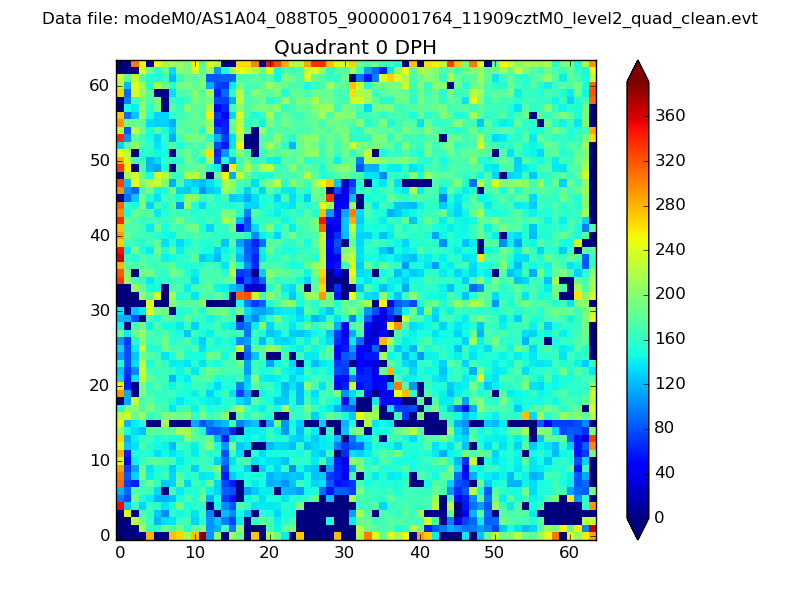 |
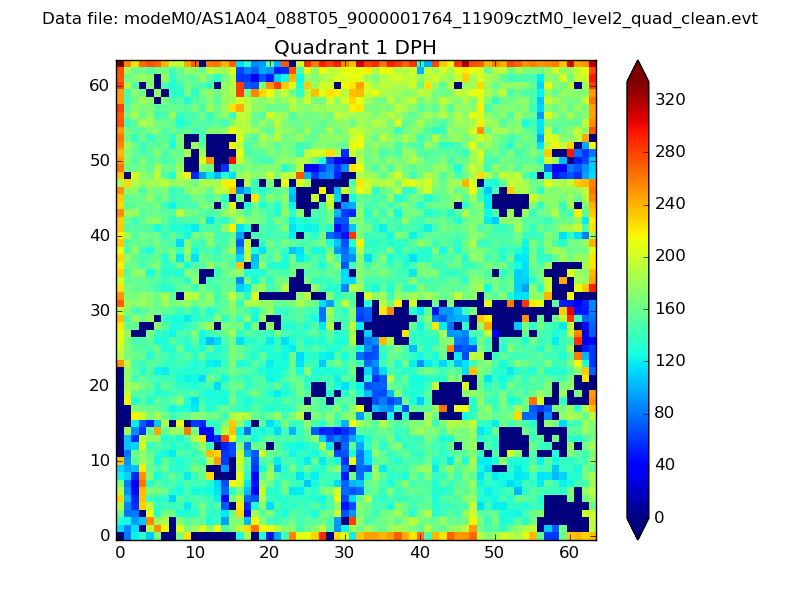 |
Quadrant B |
|---|---|---|---|
| Quadrant D | 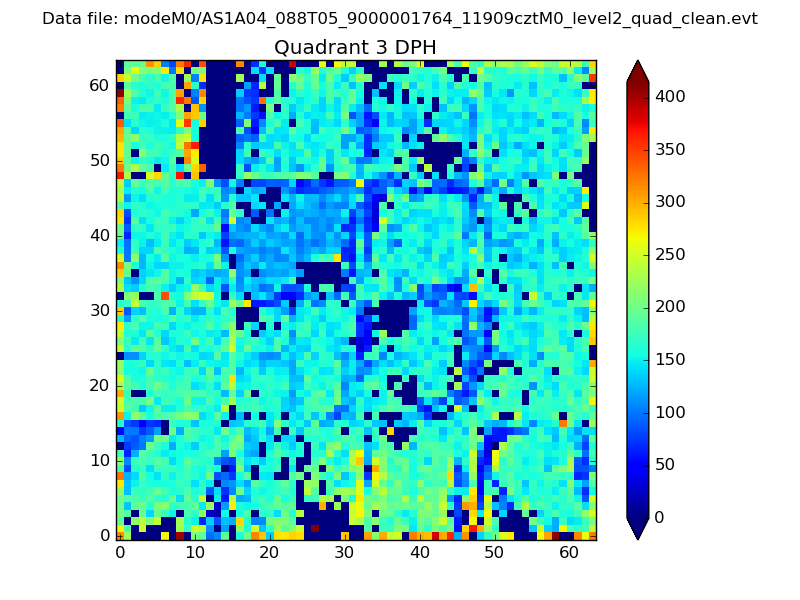 |
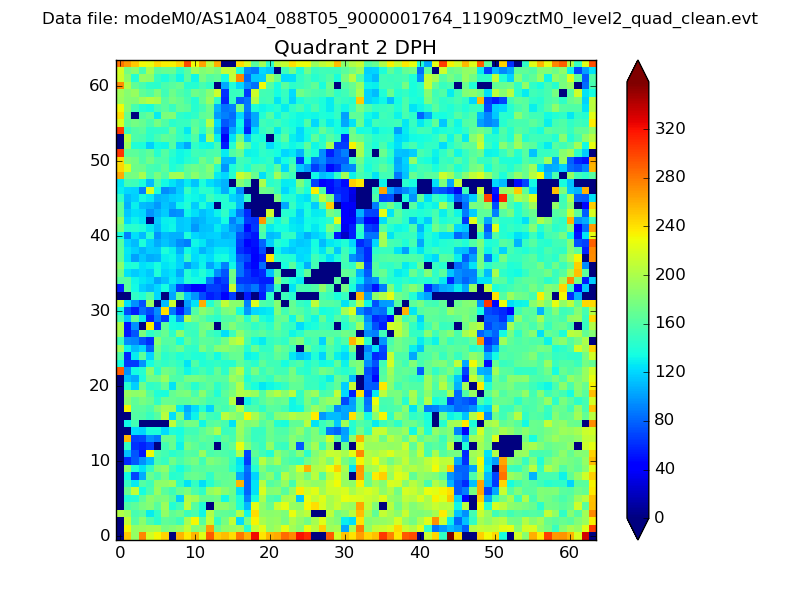 |
Quadrant C |
| Plot type | Count rate plots | Images |
|---|---|---|
| Comparison with Poisson distribution Blue bars denote a histogram of data divided into 1 sec bins. Red curve is a Poisson curve with rate = median count rate of data. |
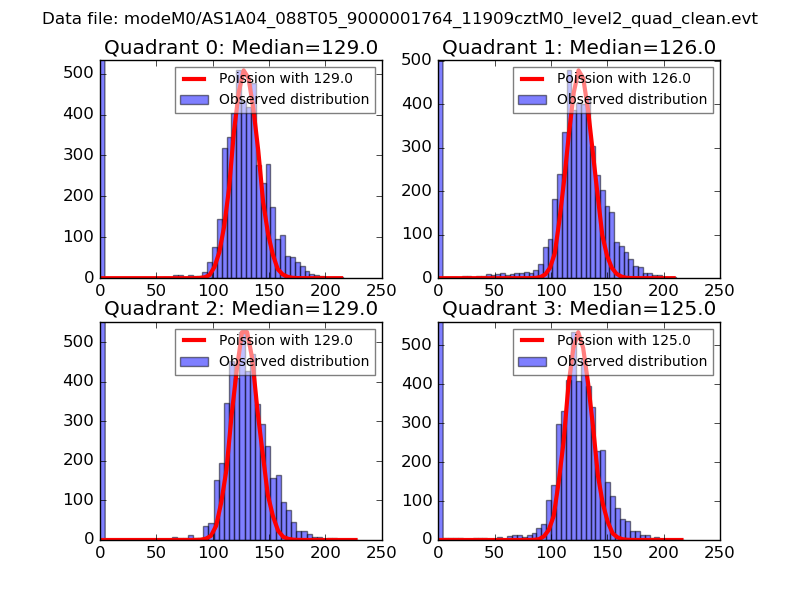 |
 |
| Quadrant-wise count rates Data is divided into 100 sec bins |
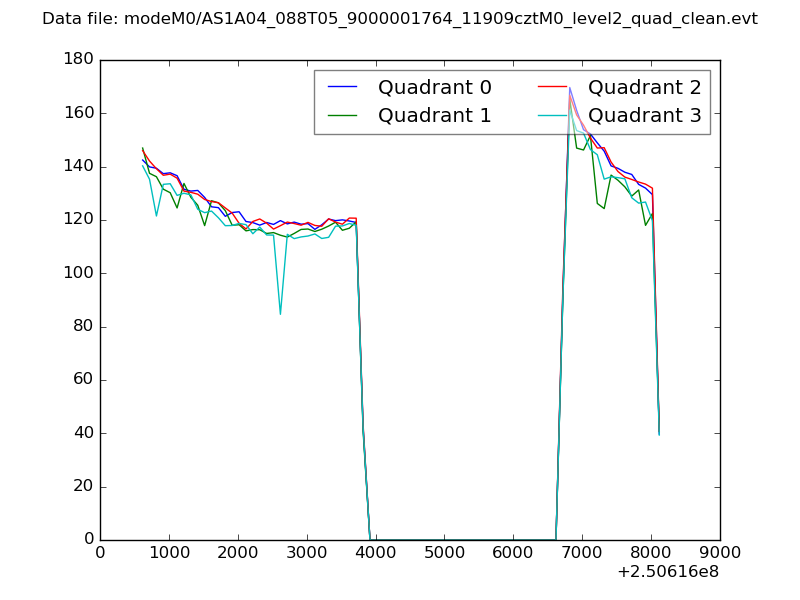 |
|
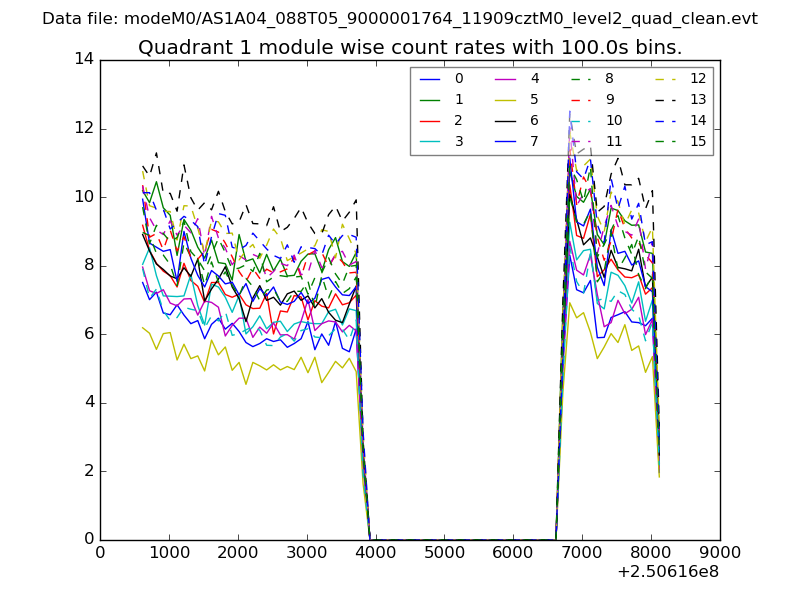
| Module-wise count rates for Quadrant A Data is divided into 100 sec bins |
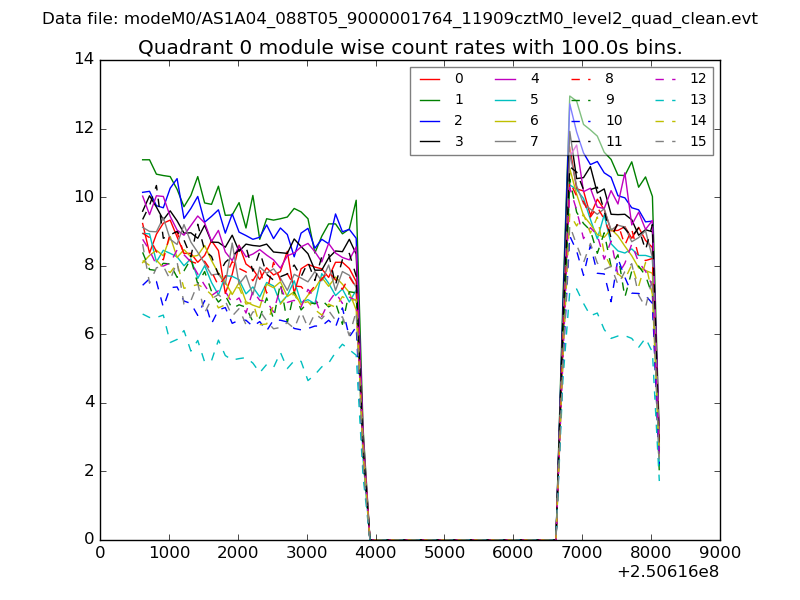 |
 |
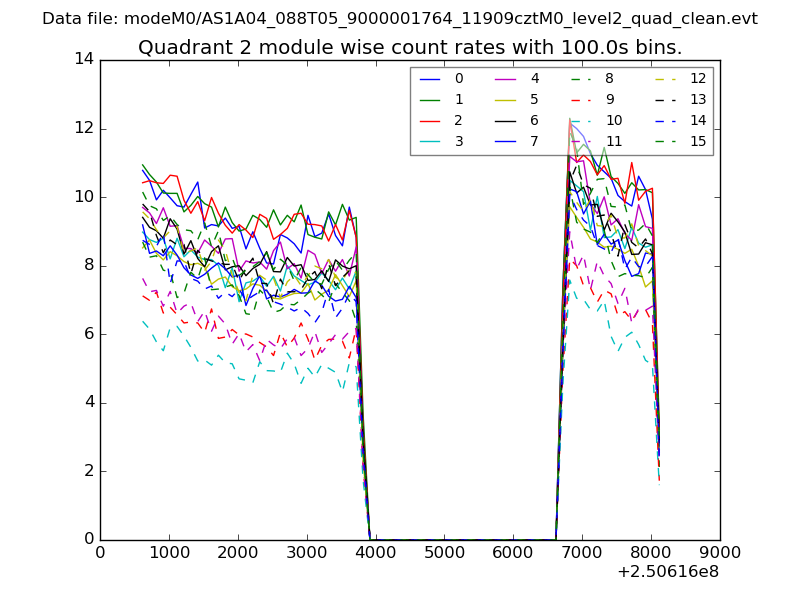
| Module-wise count rates for Quadrant B Data is divided into 100 sec bins |
 |
 |
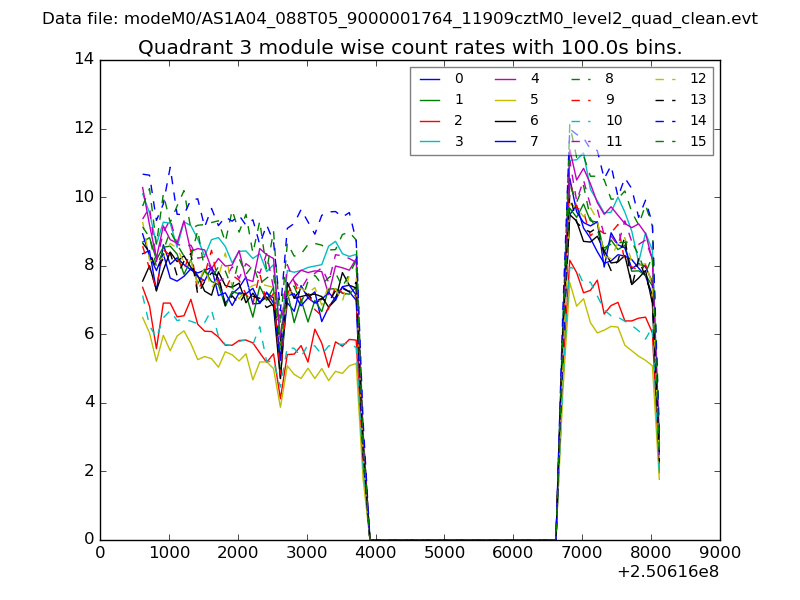
| Module-wise count rates for Quadrant C Data is divided into 100 sec bins |
 |
 |
| Module-wise count rates for Quadrant D Data is divided into 100 sec bins |
 |
 |
| Parameter | Plot |
|---|---|
| CZT HV Monitor | 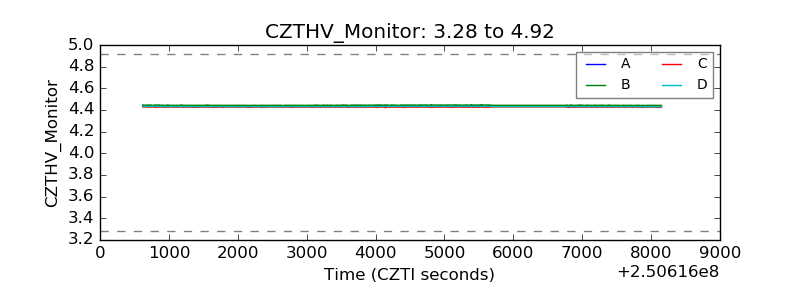 |
| D_VDD | 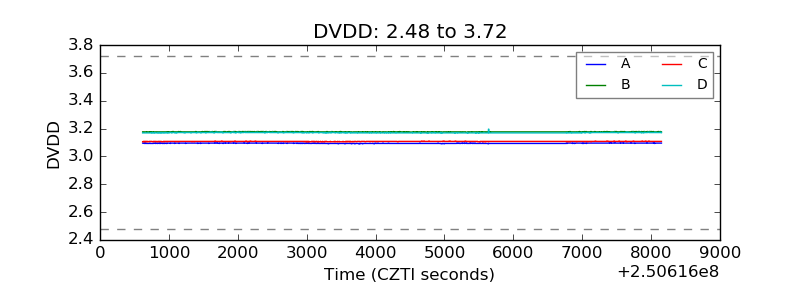 |
| Temperature 1 | 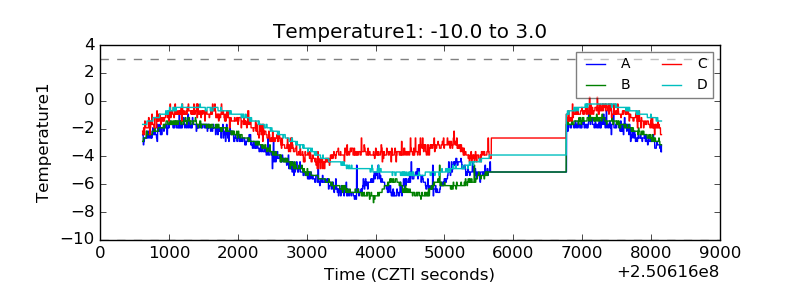 |
| Veto HV Monitor |  |
| Veto LLD | 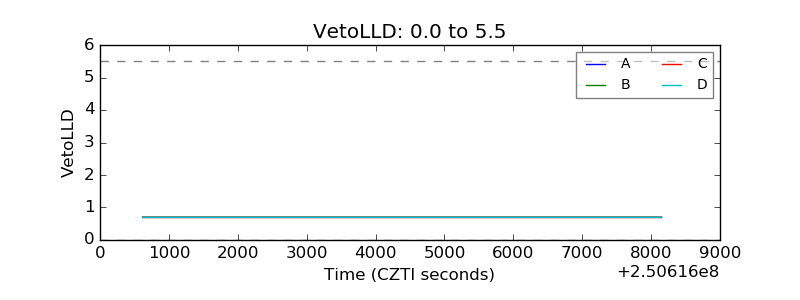 |
| Alpha Counter | 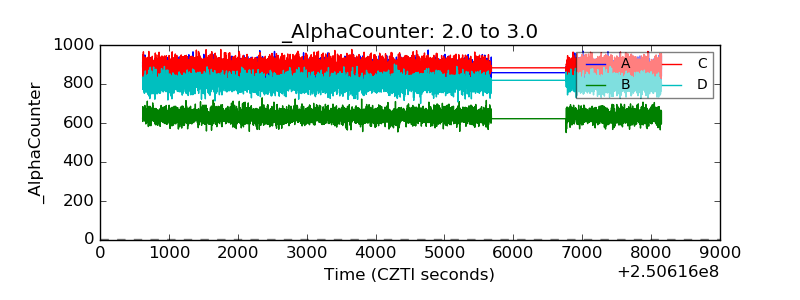 |
| _CPM_Rate | 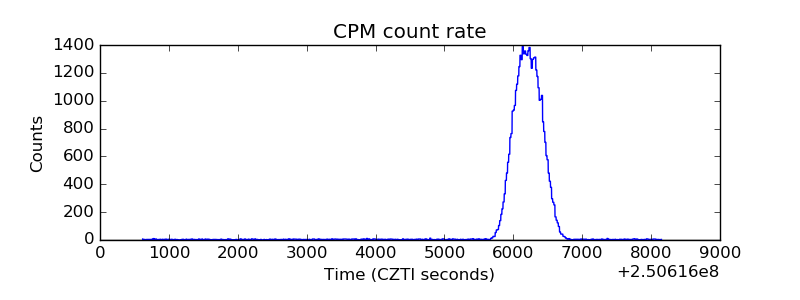 |
| CZT Counter | 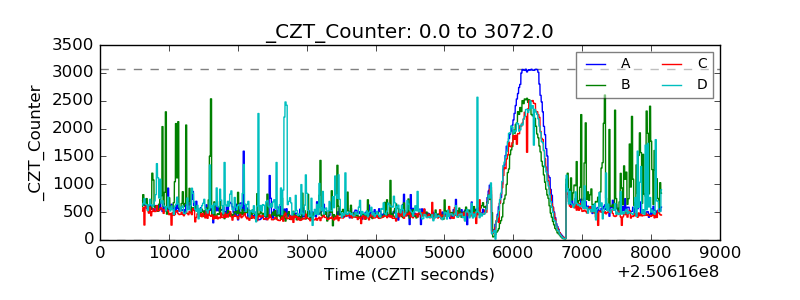 |
| +2.5 Volts monitor |  |
| +5 Volts monitor |  |
| _ROLL_ROT | 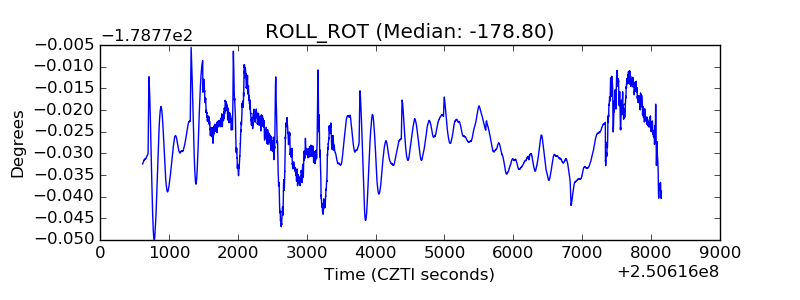 |
| _Roll_DEC | 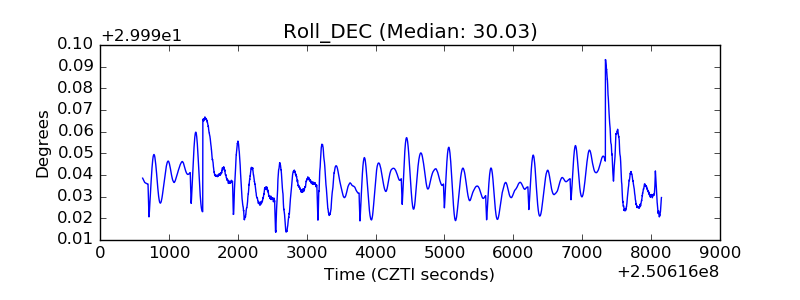 |
| _Roll_RA | 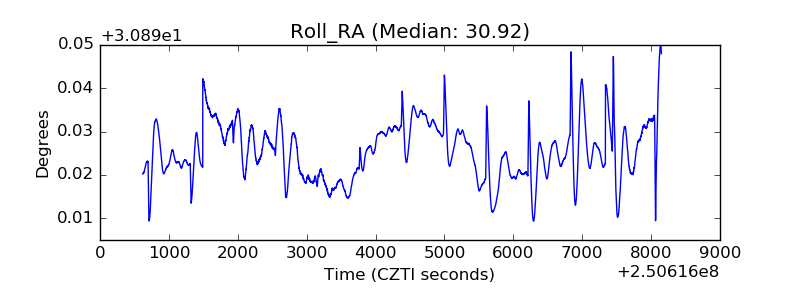 |
| Veto Counter | 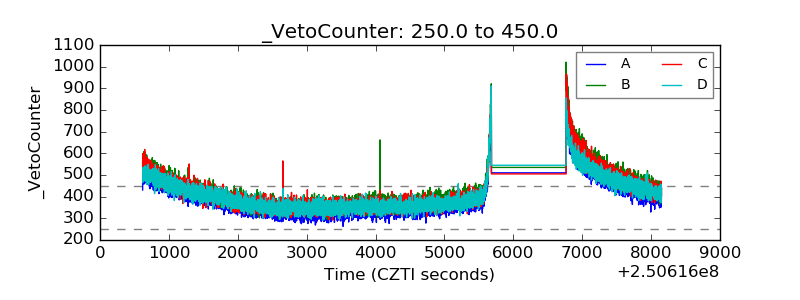 |