| Param | Original file | Final file |
|---|---|---|
| Filename | modeM0/AS1A04_088T05_9000001764_11910cztM0_level2.evt | modeM0/AS1A04_088T05_9000001764_11910cztM0_level2_quad_clean.evt |
| Size (bytes) | 540,123,840 | 93,395,520 |
| Size | 515.1 MB | 89.1 MB |
| Events in quadrant A | 3,508,830 | 609,220 |
| Events in quadrant B | 5,032,972 | 580,282 |
| Events in quadrant C | 3,058,901 | 607,594 |
| Events in quadrant D | 4,315,187 | 576,436 |
| Mode M9 | |||
|---|---|---|---|
| Quadrant | BADHDUFLAG | Total packets | Discarded packets |
| A | 0 | 16 | 0 |
| B | 0 | 16 | 0 |
| C | 0 | 16 | 0 |
| D | 0 | 17 | 0 |
| Mode M0 | |||
|---|---|---|---|
| Quadrant | BADHDUFLAG | Total packets | Discarded packets |
| A | 0 | 14550 | 3 |
| B | 0 | 19320 | 2 |
| C | 0 | 13501 | 2 |
| D | 0 | 17347 | 2 |
| Mode SS | |||
|---|---|---|---|
| Quadrant | BADHDUFLAG | Total packets | Discarded packets |
| A | 0 | 132 | 0 |
| B | 0 | 132 | 0 |
| C | 0 | 132 | 0 |
| D | 0 | 132 | 0 |
| Quadrant | Total seconds | Saturated seconds | Saturation percentage |
|---|---|---|---|
| A | 6519 | 81 | 1.242522% |
| B | 6519 | 473 | 7.255714% |
| C | 6519 | 44 | 0.674950% |
| D | 6519 | 233 | 3.574168% |
Noise dominated data is calculated using 1-second bins in cleaned event files. If a bin has >2000 counts, and if more than 50% of those come from <1% of pixels, then it is considered to be noise-dominated and hence unusable.
| Quadrant | # 1 sec bins | Bins with >0 counts | Bins with >2000 counts | High rate bins dominated by noise | Noise dominated (total time) | Noise dominated (detector-on time) | Marked lightcurve |
|---|---|---|---|---|---|---|---|
| A | 7720 | 6520 | 1 | 1 | 0.01% | 0.02% | 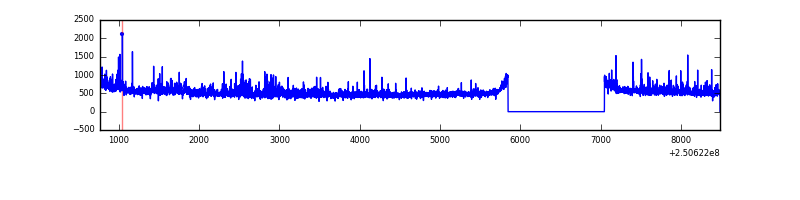 |
| B | 7720 | 6520 | 345 | 345 | 4.47% | 5.29% | 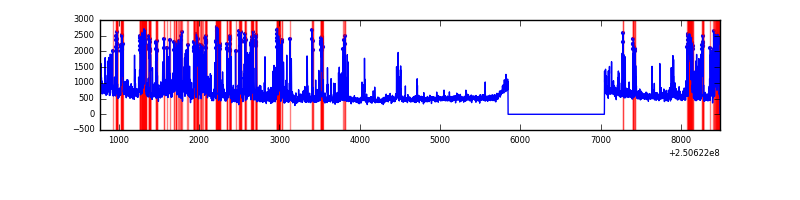 |
| C | 7720 | 6520 | 0 | 0 | 0.00% | 0.00% | 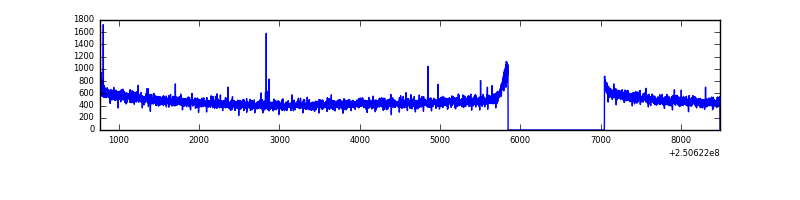 |
| D | 7719 | 6519 | 133 | 133 | 1.72% | 2.04% | 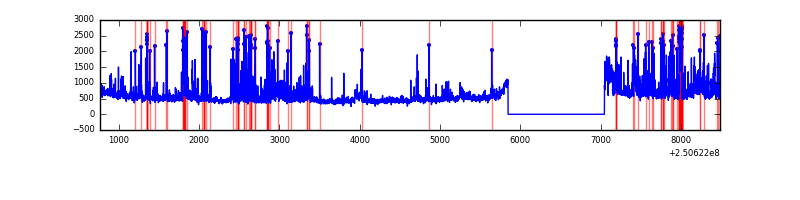 |
Top three noisy pixels from each quadrant. If the there are fewer than three noisy pixels in the level2.evt file, extra rows are filled as -1
| Pixel properties | Quadrant properties | ||||||
|---|---|---|---|---|---|---|---|
| Quadrant | DetID | PixID | Counts | Sigma | Mean | Median | Sigma |
| A | 8 | 15 | 160672 | 987.93 | 805 | 788 | 161.8 |
| A | 1 | 162 | 91916 | 563.08 | 805 | 788 | 161.8 |
| A | 1 | 178 | 47361 | 287.78 | 805 | 788 | 161.8 |
| B | 4 | 239 | 1189585 | 8051.12 | 784 | 764 | 147.7 |
| B | 5 | 8 | 273579 | 1847.6 | 784 | 764 | 147.7 |
| B | 15 | 204 | 229303 | 1547.75 | 784 | 764 | 147.7 |
| C | 13 | 61 | 5657 | 27.08 | 783 | 788 | 179.8 |
| C | 12 | 4 | 3496 | 15.06 | 783 | 788 | 179.8 |
| C | 14 | 234 | 2941 | 11.97 | 783 | 788 | 179.8 |
| D | 1 | 52 | 431449 | 2356.38 | 777 | 758 | 182.8 |
| D | 13 | 249 | 226908 | 1237.3 | 777 | 758 | 182.8 |
| D | 10 | 199 | 197487 | 1076.33 | 777 | 758 | 182.8 |
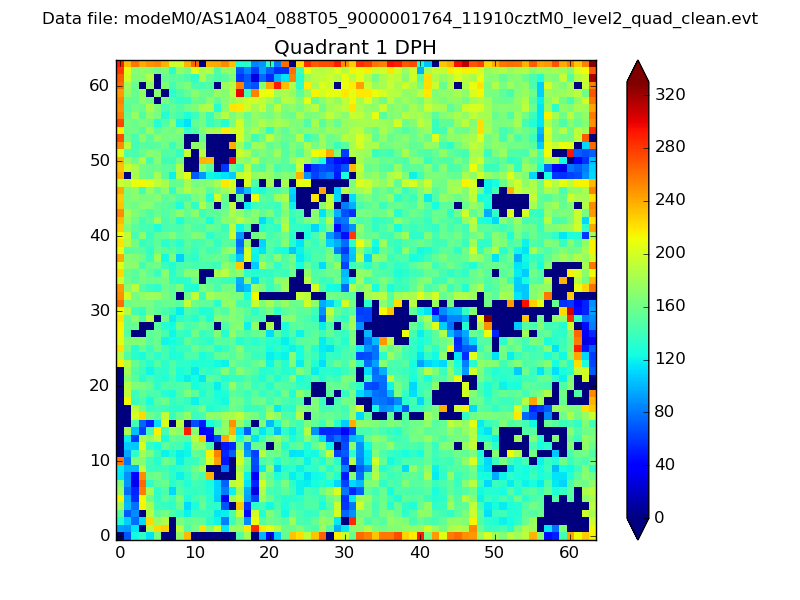
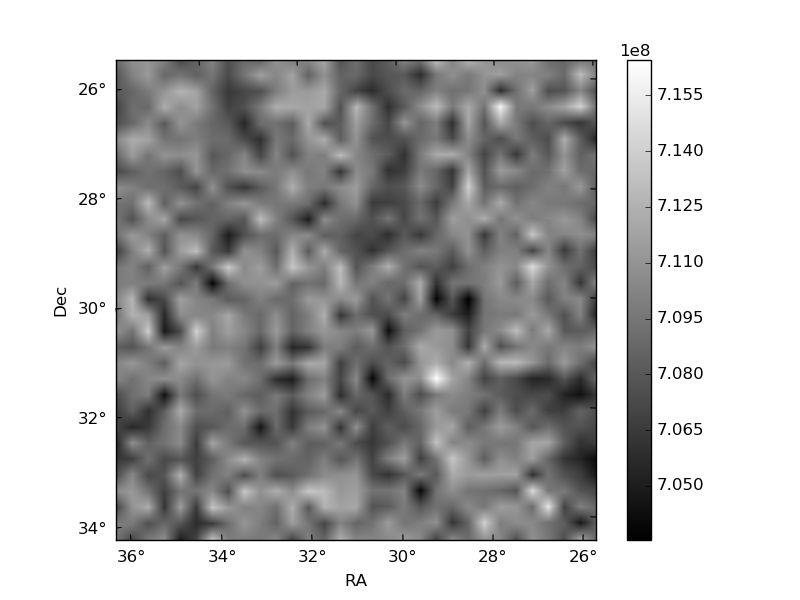
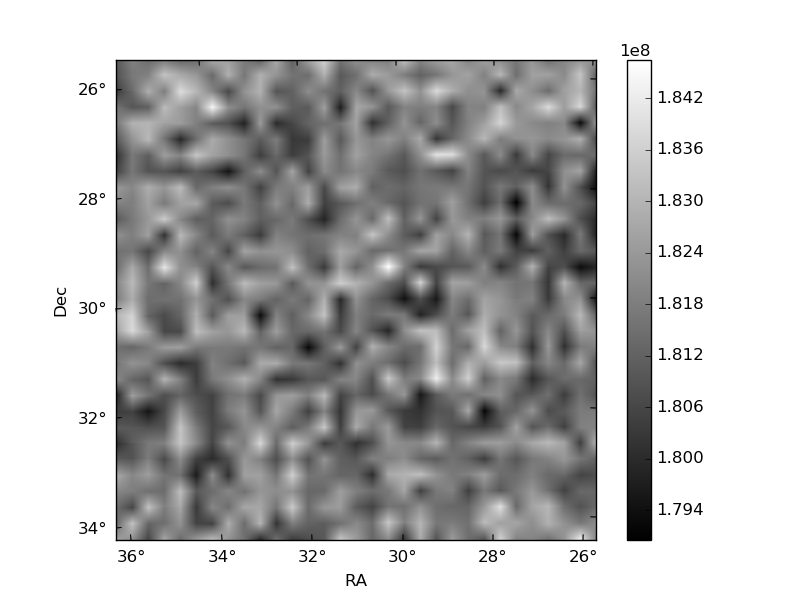
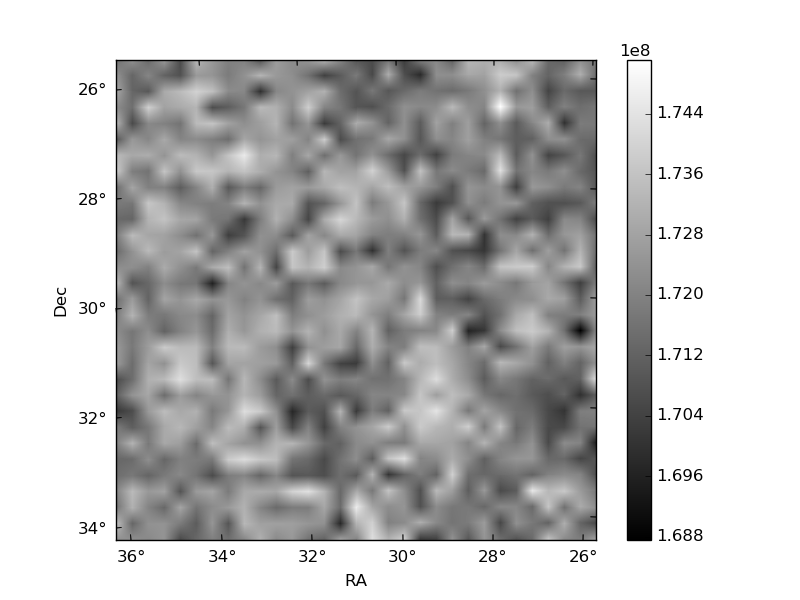
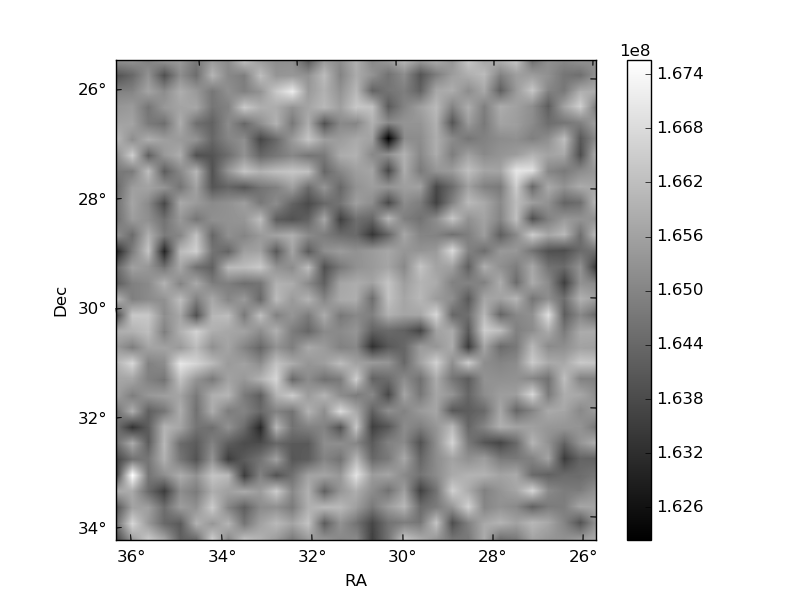
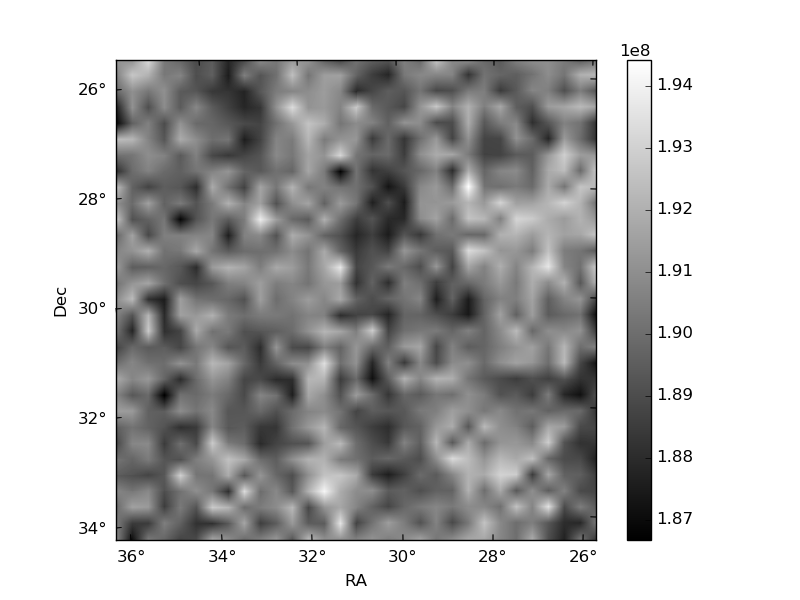
Histogram calculated using DETX and DETY for each event in the final _common_clean file
| Quadrant A | 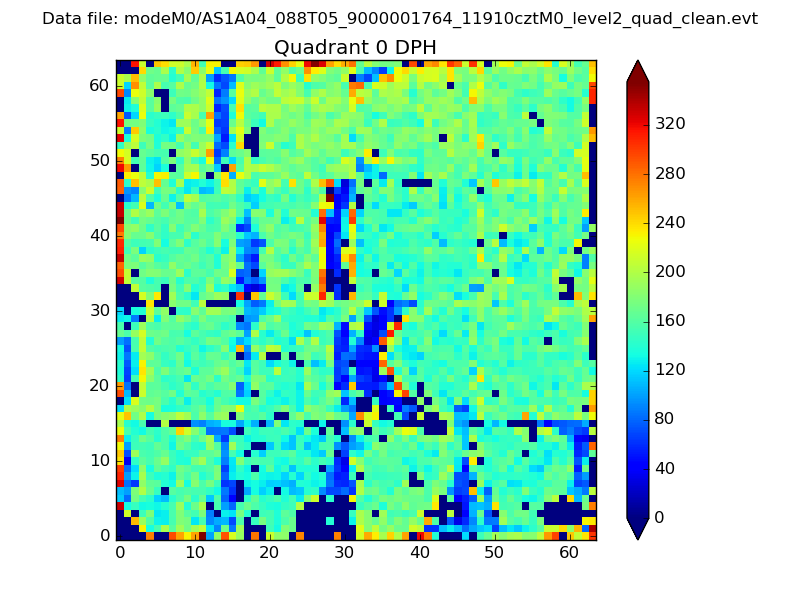 |
 |
Quadrant B |
|---|---|---|---|
| Quadrant D | 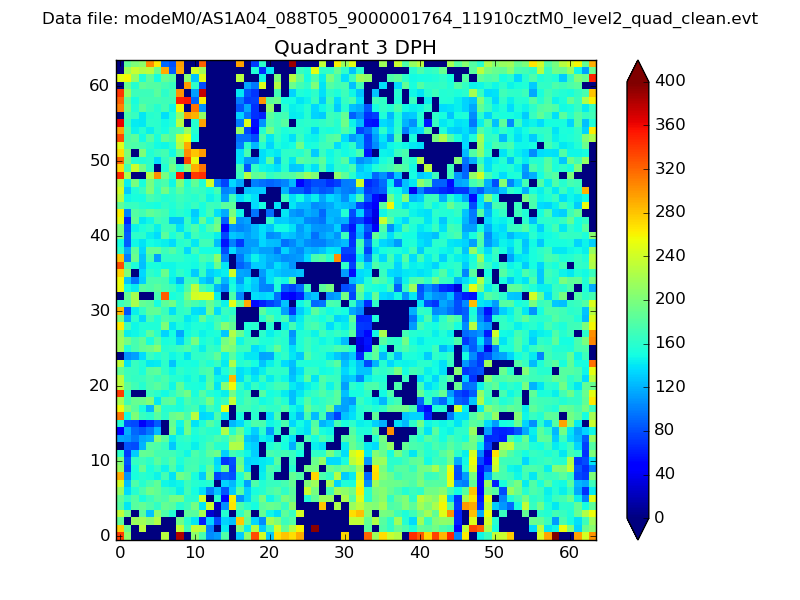 |
 |
Quadrant C |
| Plot type | Count rate plots | Images |
|---|---|---|
| Comparison with Poisson distribution Blue bars denote a histogram of data divided into 1 sec bins. Red curve is a Poisson curve with rate = median count rate of data. |
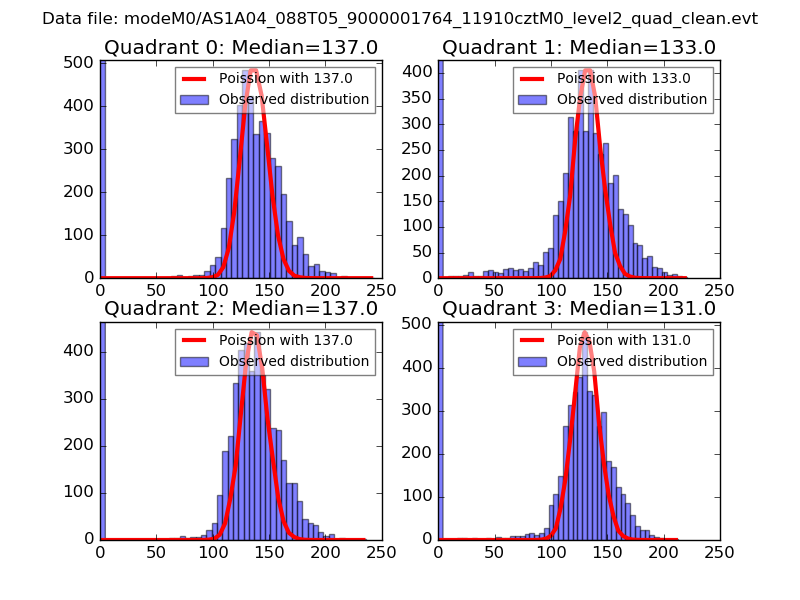 |
 |
| Quadrant-wise count rates Data is divided into 100 sec bins |
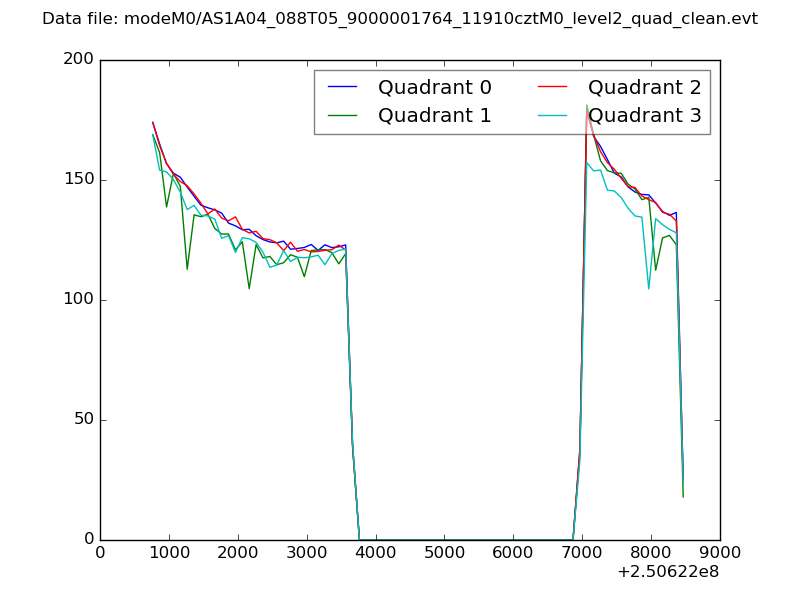 |
|
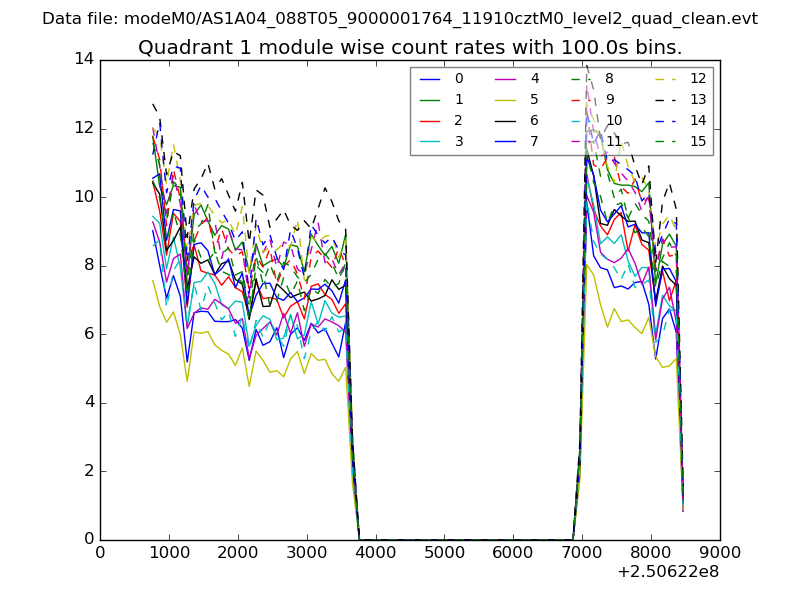
| Module-wise count rates for Quadrant A Data is divided into 100 sec bins |
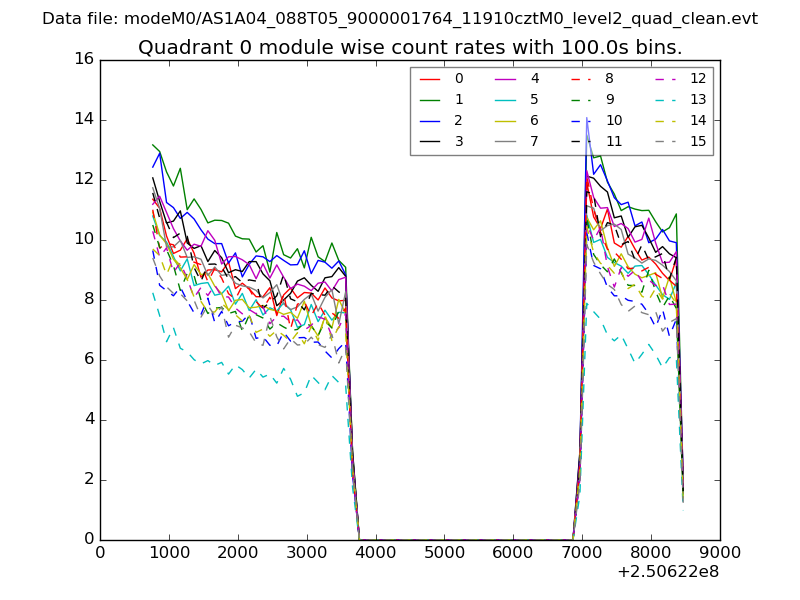 |
 |
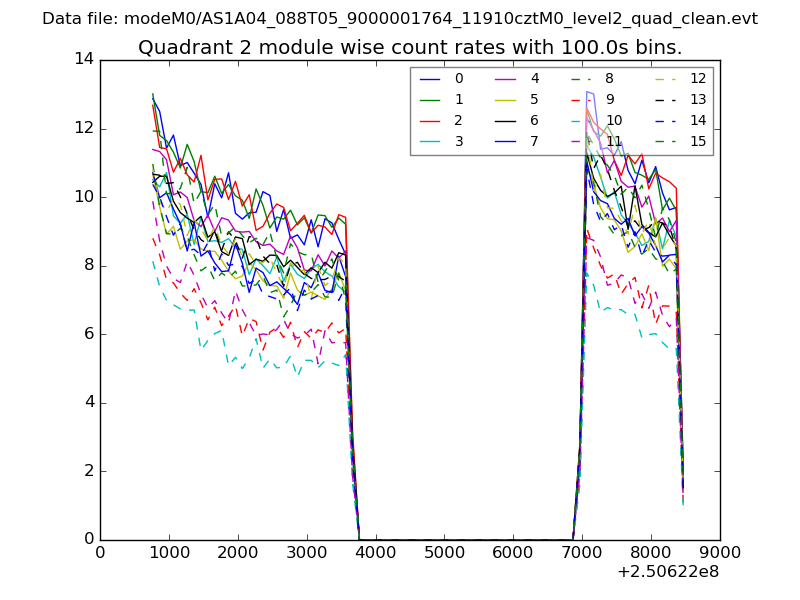
| Module-wise count rates for Quadrant B Data is divided into 100 sec bins |
 |
 |
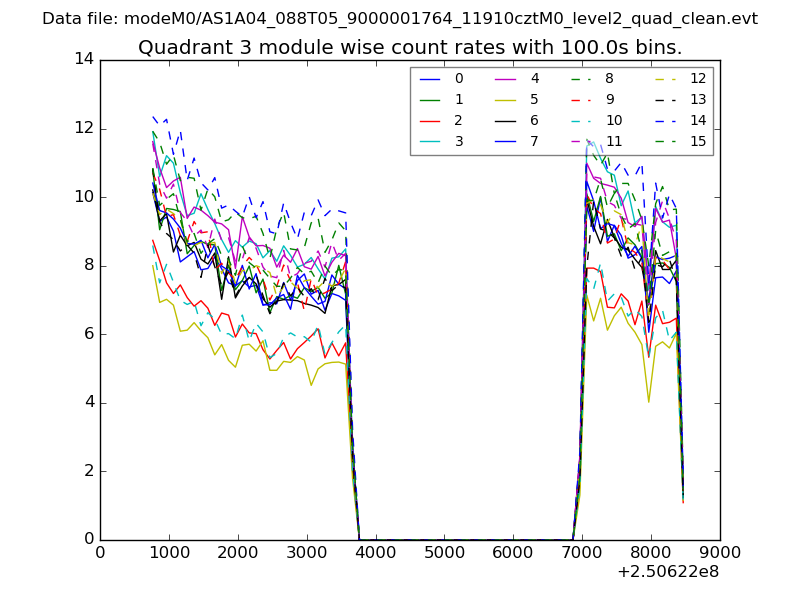
| Module-wise count rates for Quadrant C Data is divided into 100 sec bins |
 |
 |
| Module-wise count rates for Quadrant D Data is divided into 100 sec bins |
 |
 |
| Parameter | Plot |
|---|---|
| CZT HV Monitor | 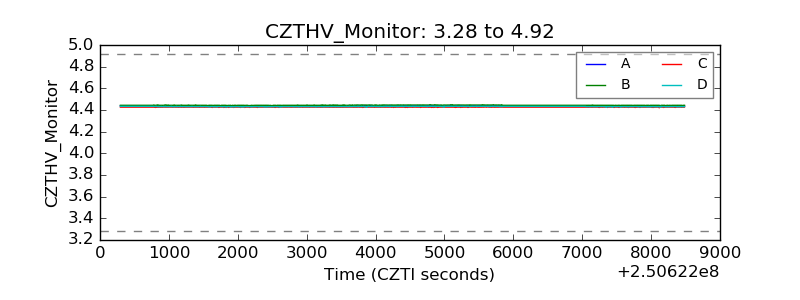 |
| D_VDD | 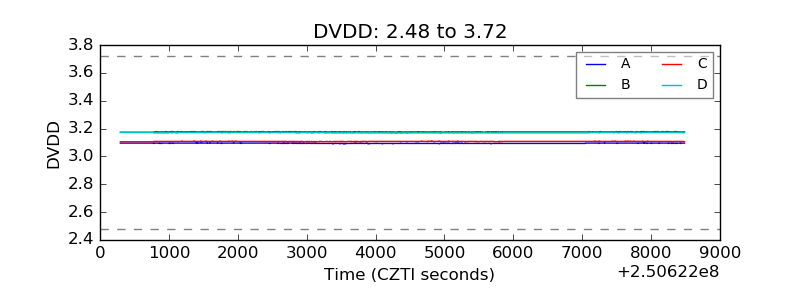 |
| Temperature 1 | 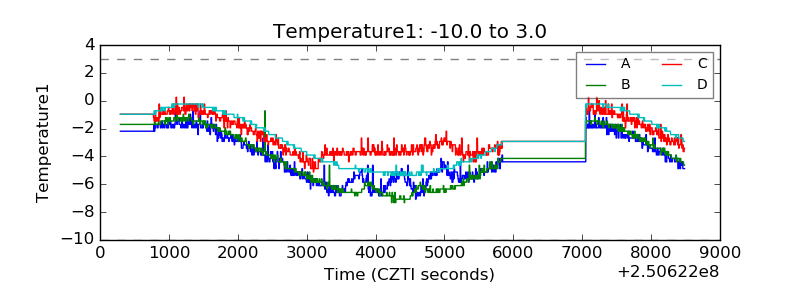 |
| Veto HV Monitor | 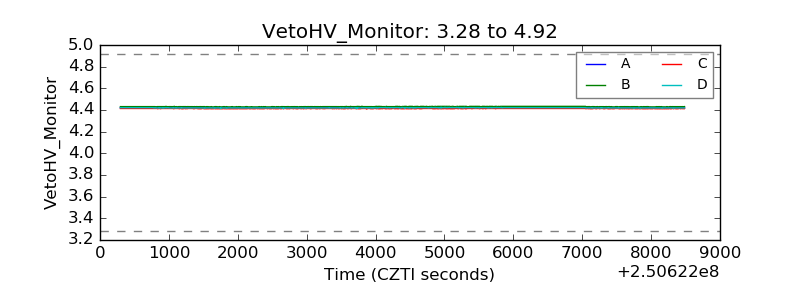 |
| Veto LLD | 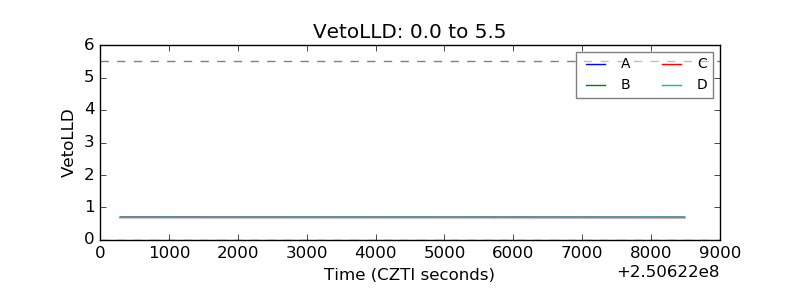 |
| Alpha Counter | 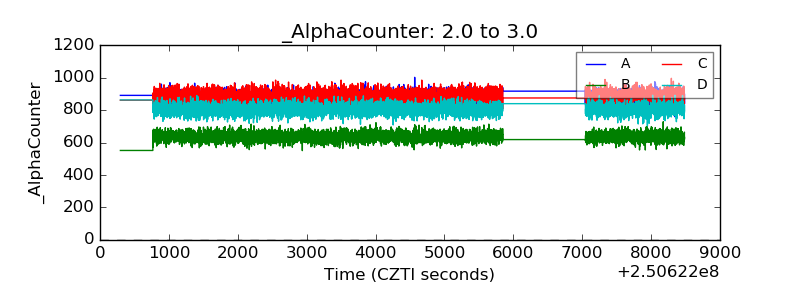 |
| _CPM_Rate | 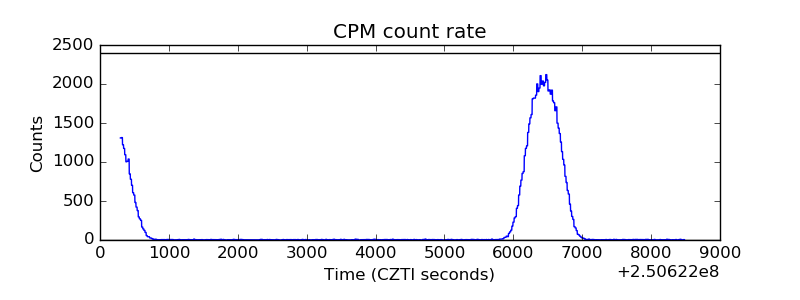 |
| CZT Counter | 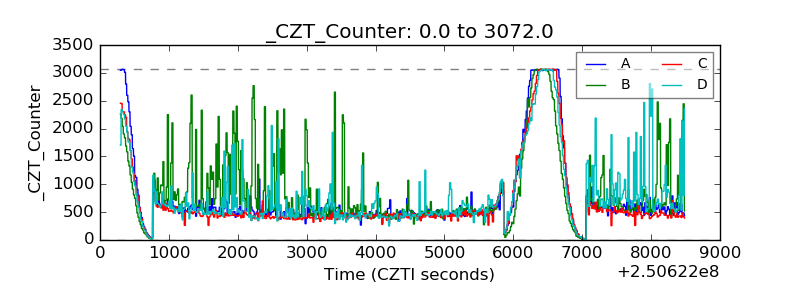 |
| +2.5 Volts monitor |  |
| +5 Volts monitor |  |
| _ROLL_ROT | 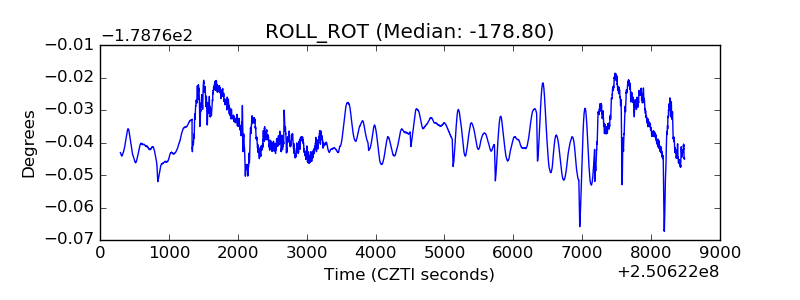 |
| _Roll_DEC | 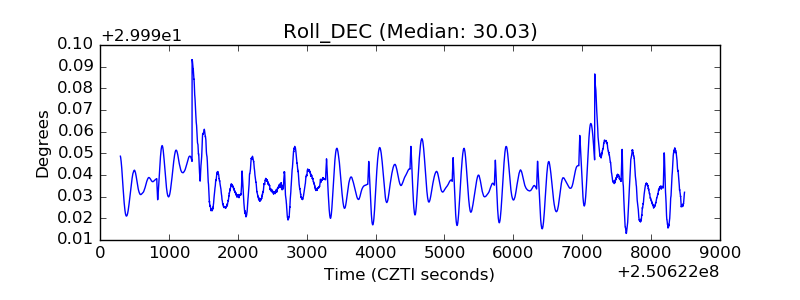 |
| _Roll_RA | 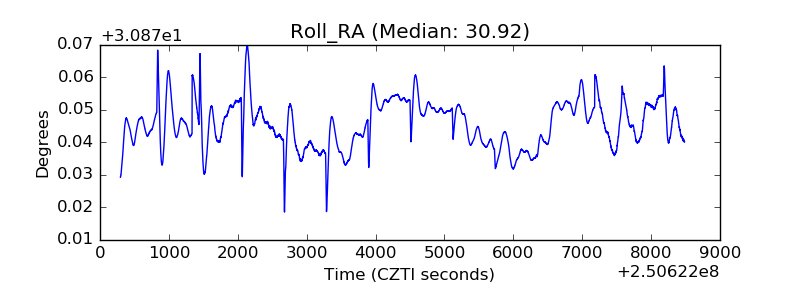 |
| Veto Counter | 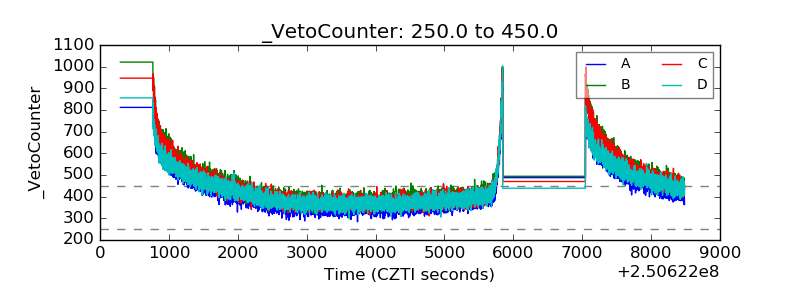 |