| Param | Original file | Final file |
|---|---|---|
| Filename | modeM0/AS1A04_088T05_9000001764_11912cztM0_level2.evt | modeM0/AS1A04_088T05_9000001764_11912cztM0_level2_quad_clean.evt |
| Size (bytes) | 588,260,160 | 83,756,160 |
| Size | 561.0 MB | 79.9 MB |
| Events in quadrant A | 3,416,066 | 570,739 |
| Events in quadrant B | 4,264,412 | 560,746 |
| Events in quadrant C | 2,929,472 | 577,833 |
| Events in quadrant D | 6,789,297 | 397,474 |
| Mode M9 | |||
|---|---|---|---|
| Quadrant | BADHDUFLAG | Total packets | Discarded packets |
| A | 0 | 22 | 0 |
| B | 0 | 22 | 0 |
| C | 0 | 22 | 0 |
| D | 0 | 23 | 0 |
| Mode M0 | |||
|---|---|---|---|
| Quadrant | BADHDUFLAG | Total packets | Discarded packets |
| A | 0 | 14086 | 3 |
| B | 0 | 16709 | 2 |
| C | 0 | 12684 | 2 |
| D | 0 | 24218 | 2 |
| Mode SS | |||
|---|---|---|---|
| Quadrant | BADHDUFLAG | Total packets | Discarded packets |
| A | 0 | 126 | 0 |
| B | 0 | 126 | 0 |
| C | 0 | 126 | 0 |
| D | 0 | 126 | 0 |
| Quadrant | Total seconds | Saturated seconds | Saturation percentage |
|---|---|---|---|
| A | 6135 | 50 | 0.814996% |
| B | 6135 | 338 | 5.509372% |
| C | 6135 | 29 | 0.472698% |
| D | 6135 | 1724 | 28.101059% |
Noise dominated data is calculated using 1-second bins in cleaned event files. If a bin has >2000 counts, and if more than 50% of those come from <1% of pixels, then it is considered to be noise-dominated and hence unusable.
| Quadrant | # 1 sec bins | Bins with >0 counts | Bins with >2000 counts | High rate bins dominated by noise | Noise dominated (total time) | Noise dominated (detector-on time) | Marked lightcurve |
|---|---|---|---|---|---|---|---|
| A | 7446 | 6136 | 1 | 1 | 0.01% | 0.02% | 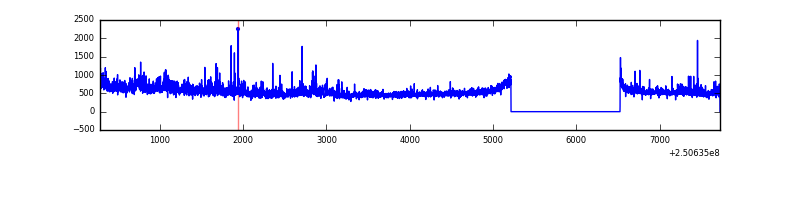 |
| B | 7446 | 6136 | 221 | 221 | 2.97% | 3.60% | 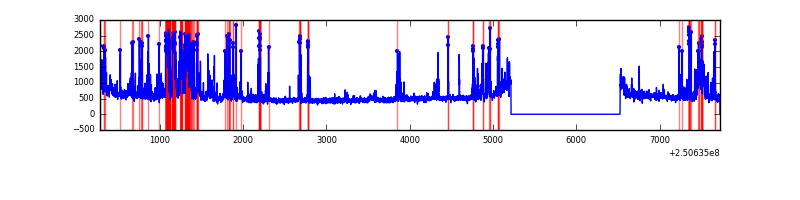 |
| C | 7446 | 6136 | 0 | 0 | 0.00% | 0.00% | 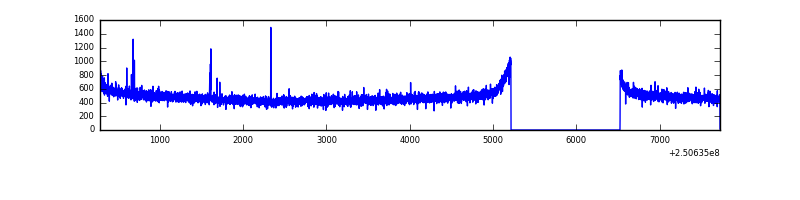 |
| D | 7446 | 6136 | 1528 | 1528 | 20.52% | 24.90% | 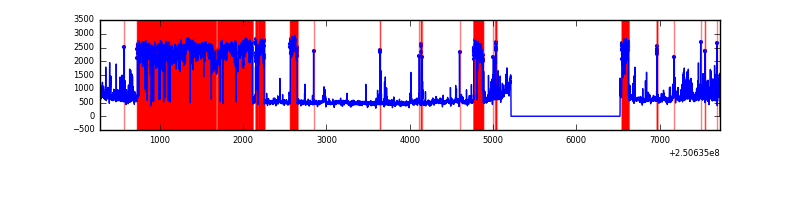 |
Top three noisy pixels from each quadrant. If the there are fewer than three noisy pixels in the level2.evt file, extra rows are filled as -1
| Pixel properties | Quadrant properties | ||||||
|---|---|---|---|---|---|---|---|
| Quadrant | DetID | PixID | Counts | Sigma | Mean | Median | Sigma |
| A | 8 | 15 | 279767 | 1804.62 | 761 | 745 | 154.6 |
| A | 1 | 162 | 71526 | 457.79 | 761 | 745 | 154.6 |
| A | 1 | 178 | 37402 | 237.09 | 761 | 745 | 154.6 |
| B | 4 | 239 | 903913 | 6408.23 | 754 | 736 | 140.9 |
| B | 0 | 231 | 161088 | 1137.73 | 754 | 736 | 140.9 |
| B | 15 | 204 | 128188 | 904.3 | 754 | 736 | 140.9 |
| C | 13 | 61 | 5521 | 27.79 | 748 | 753 | 171.6 |
| C | 12 | 4 | 5195 | 25.89 | 748 | 753 | 171.6 |
| C | 0 | 207 | 3797 | 17.74 | 748 | 753 | 171.6 |
| D | 1 | 52 | 3649268 | 24788.04 | 613 | 597 | 147.2 |
| D | 8 | 195 | 327963 | 2224.03 | 613 | 597 | 147.2 |
| D | 5 | 222 | 271526 | 1840.62 | 613 | 597 | 147.2 |
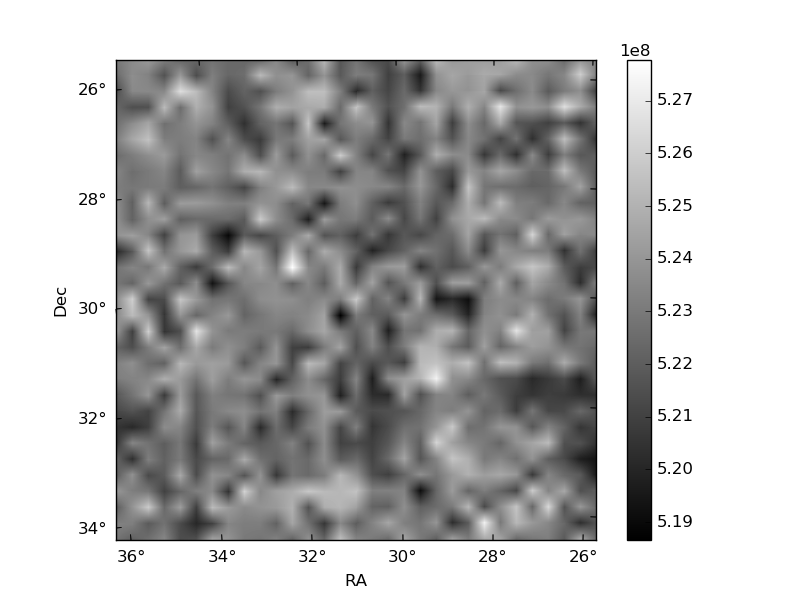
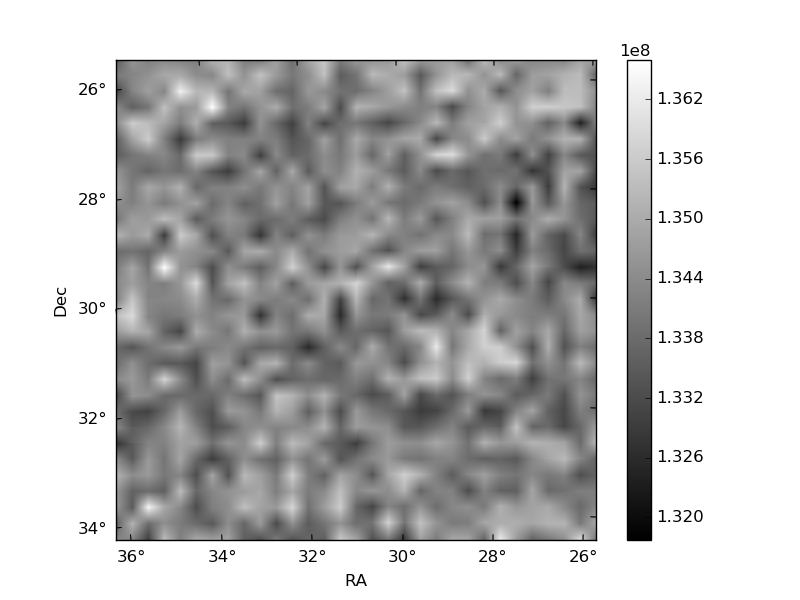
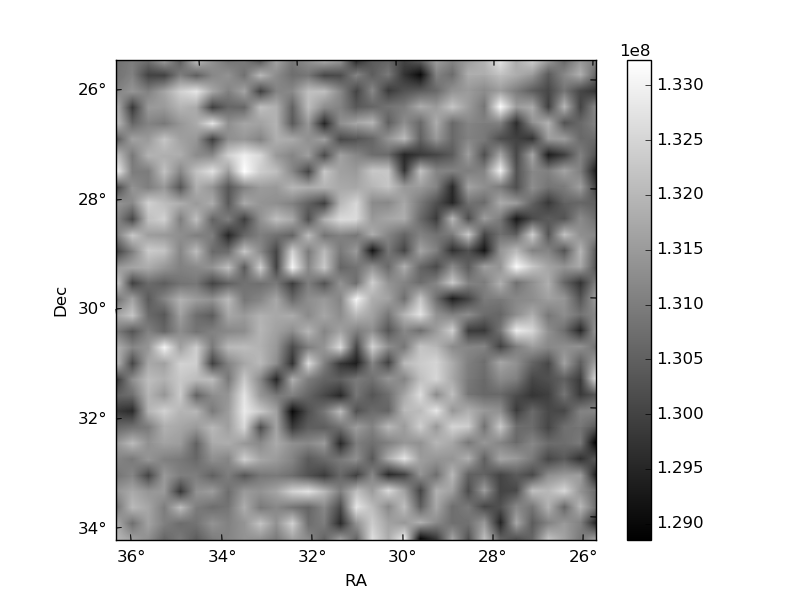
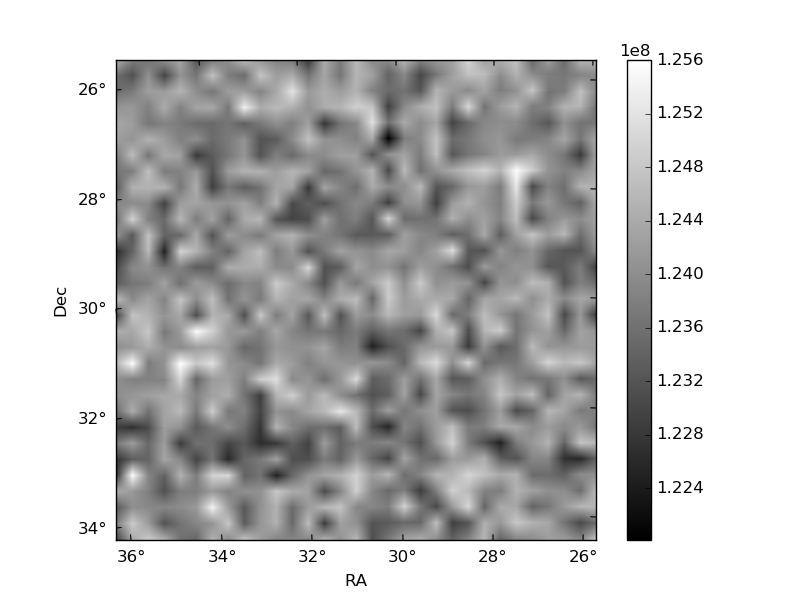
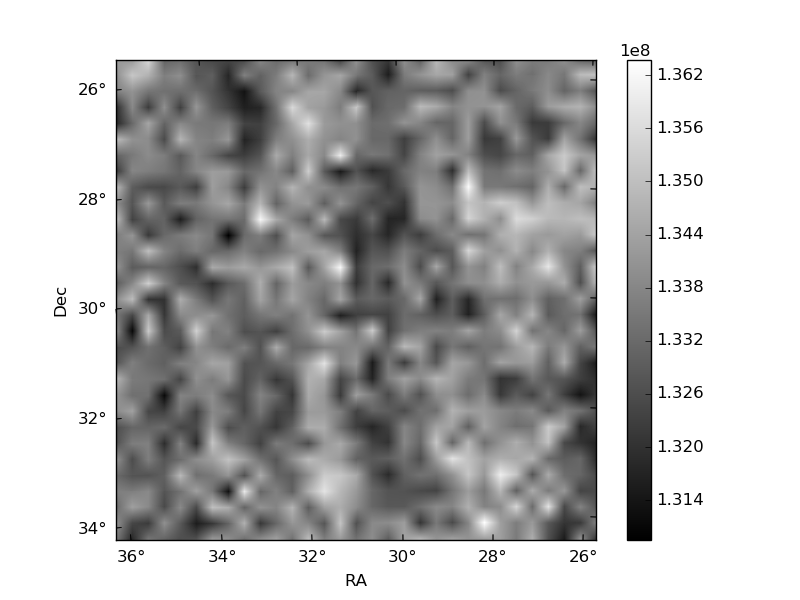
Histogram calculated using DETX and DETY for each event in the final _common_clean file
| Quadrant A | 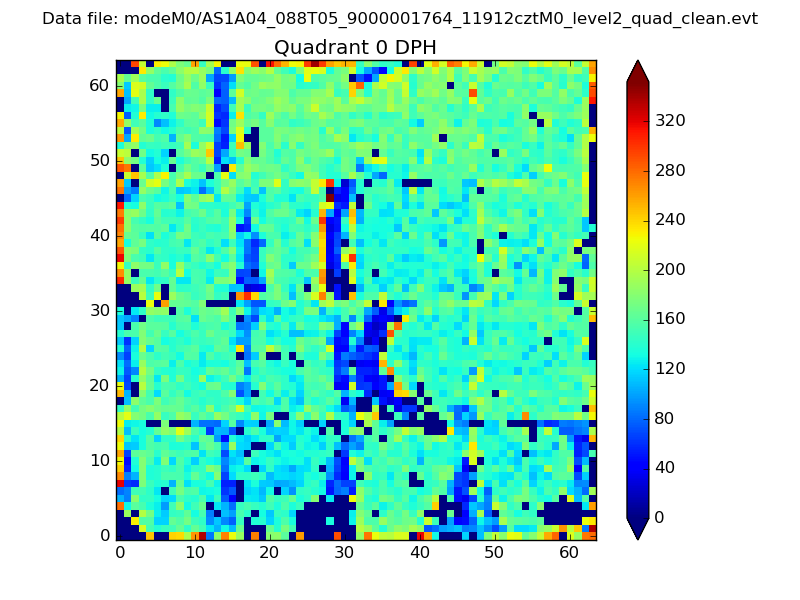 |
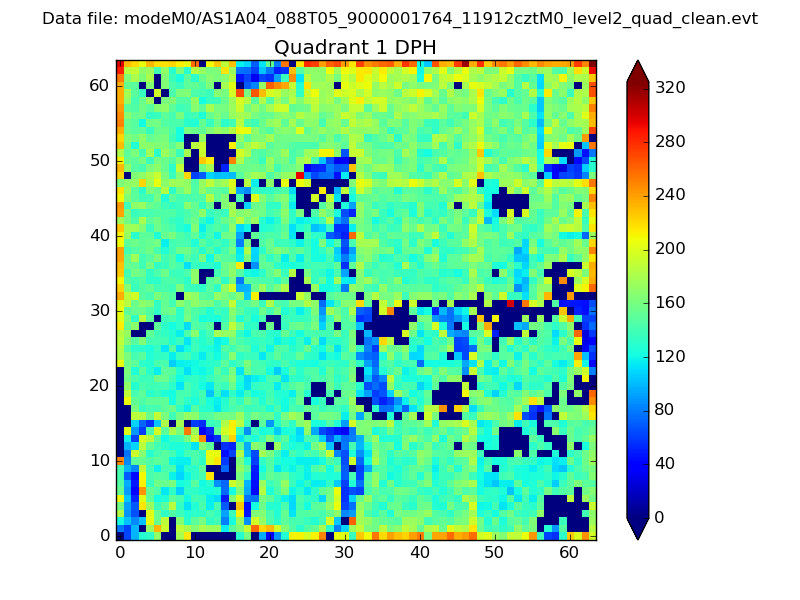 |
Quadrant B |
|---|---|---|---|
| Quadrant D | 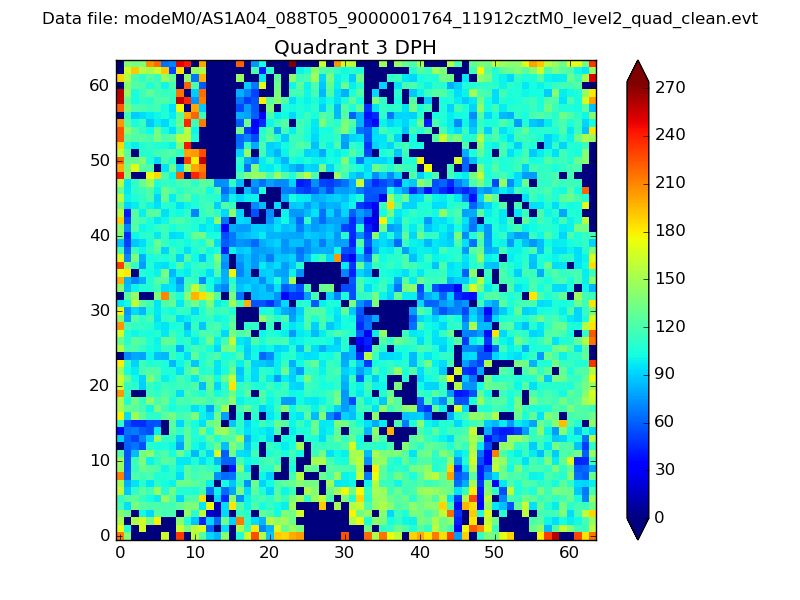 |
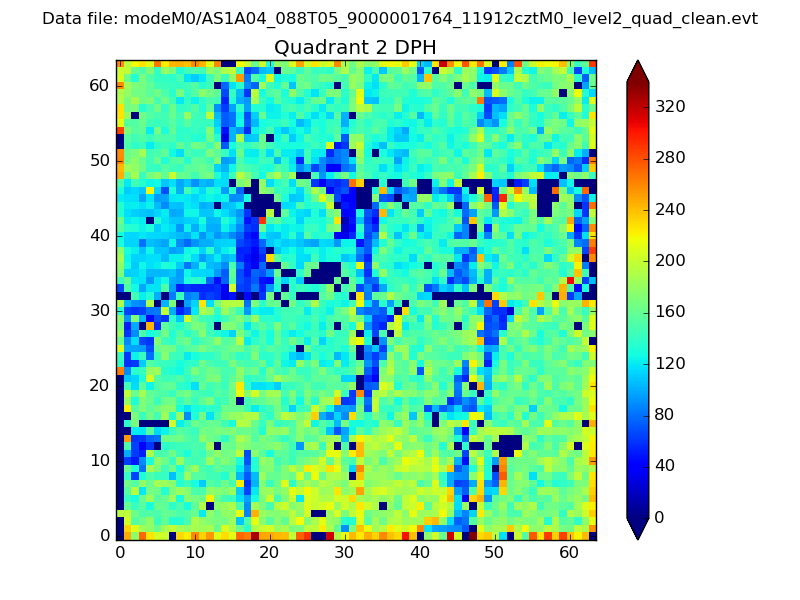 |
Quadrant C |
| Plot type | Count rate plots | Images |
|---|---|---|
| Comparison with Poisson distribution Blue bars denote a histogram of data divided into 1 sec bins. Red curve is a Poisson curve with rate = median count rate of data. |
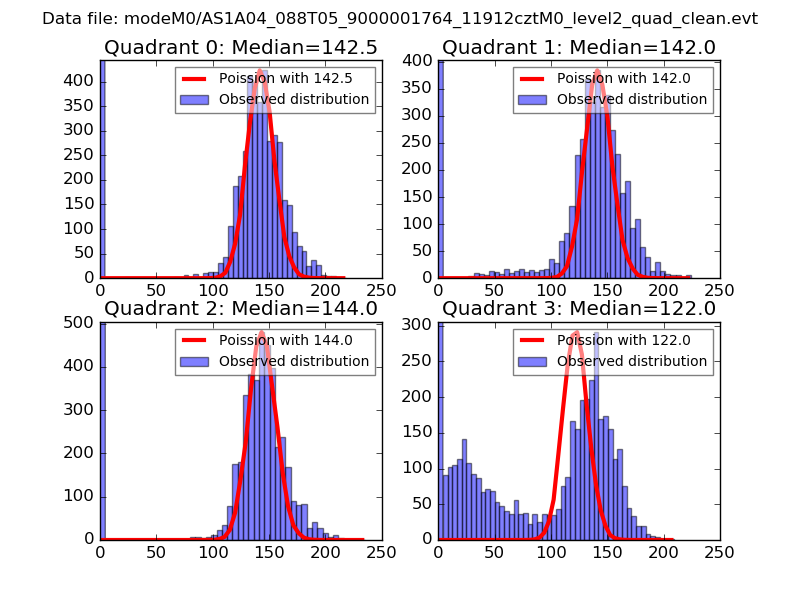 |
 |
| Quadrant-wise count rates Data is divided into 100 sec bins |
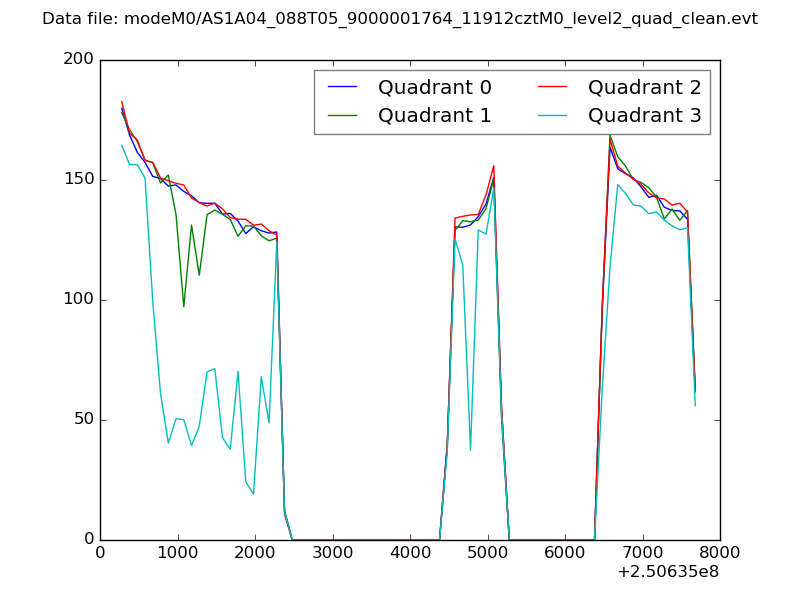 |
|
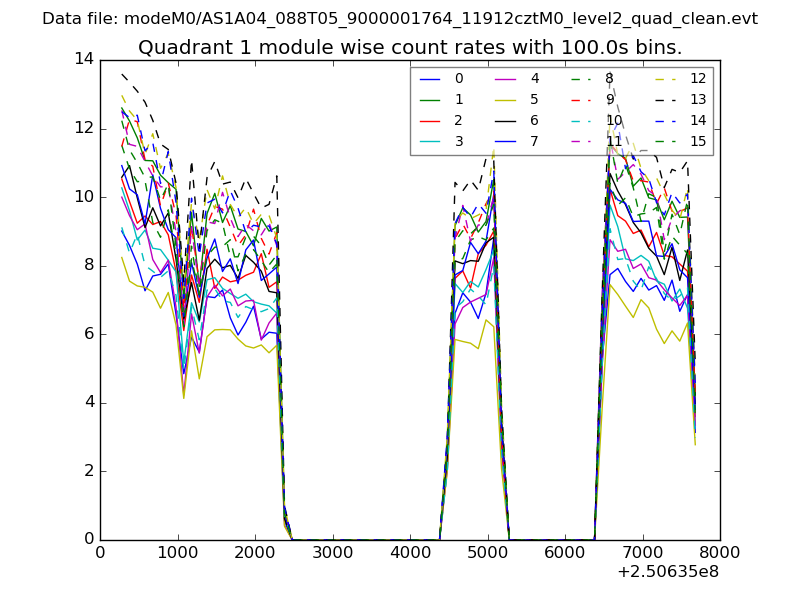
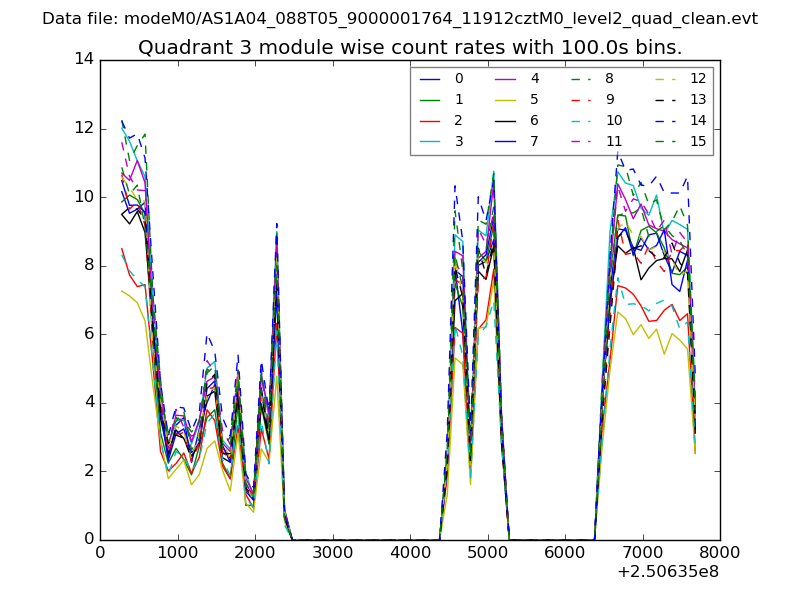
| Module-wise count rates for Quadrant A Data is divided into 100 sec bins |
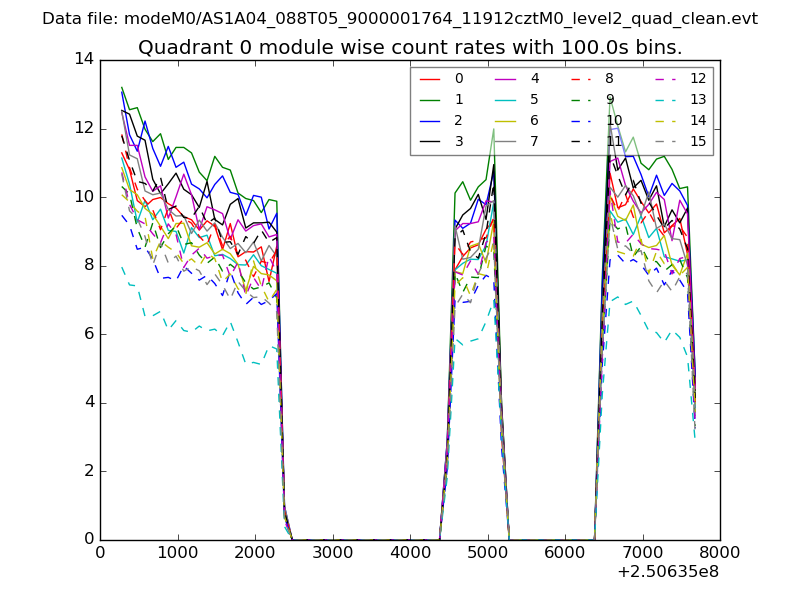 |
 |
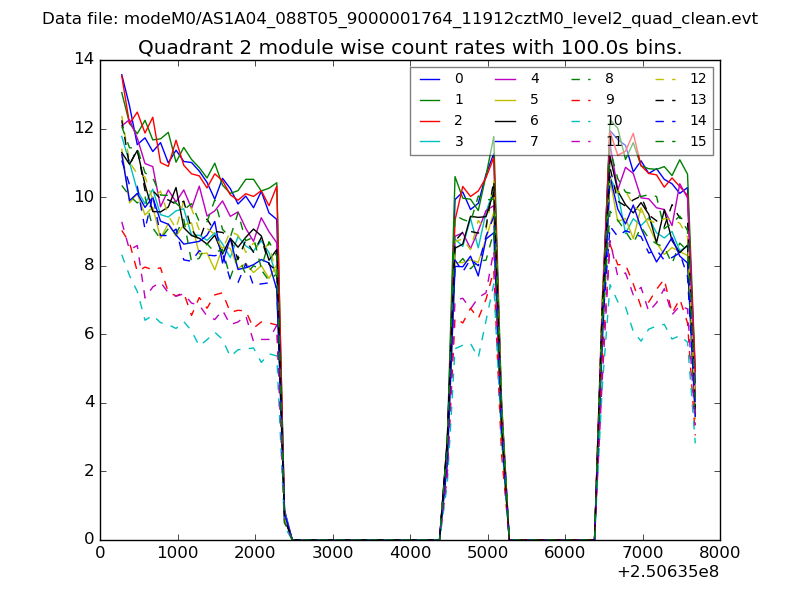
| Module-wise count rates for Quadrant B Data is divided into 100 sec bins |
 |
 |
| Module-wise count rates for Quadrant C Data is divided into 100 sec bins |
 |
 |
| Module-wise count rates for Quadrant D Data is divided into 100 sec bins |
 |
 |
| Parameter | Plot |
|---|---|
| CZT HV Monitor | 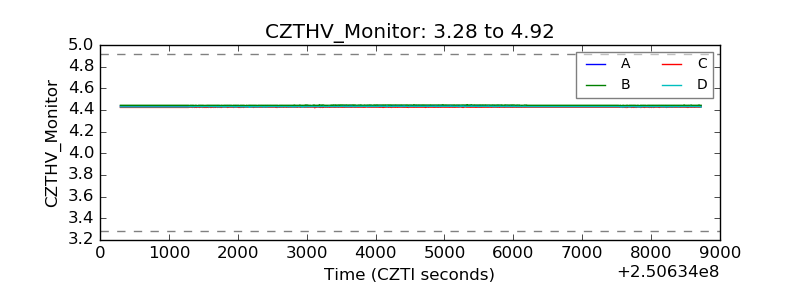 |
| D_VDD | 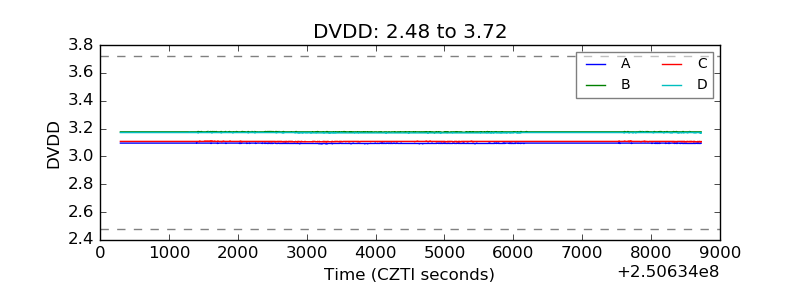 |
| Temperature 1 | 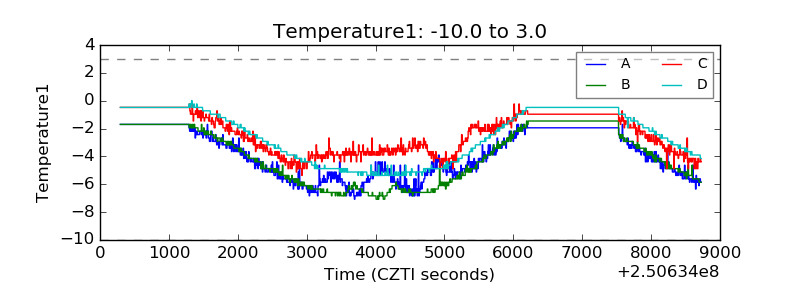 |
| Veto HV Monitor | 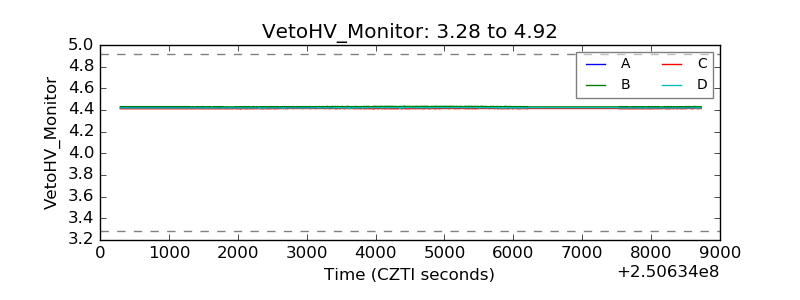 |
| Veto LLD | 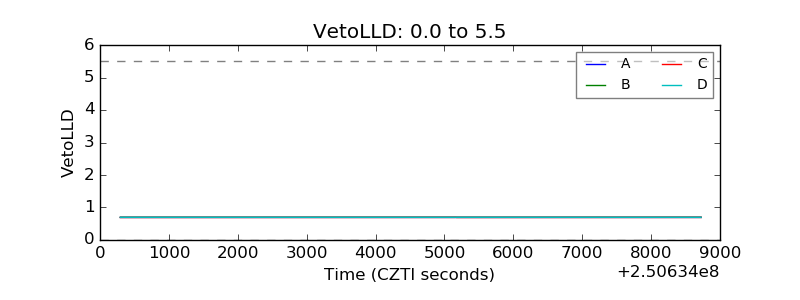 |
| Alpha Counter | 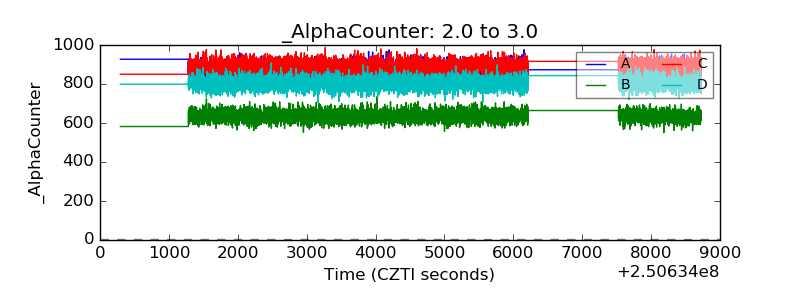 |
| _CPM_Rate | 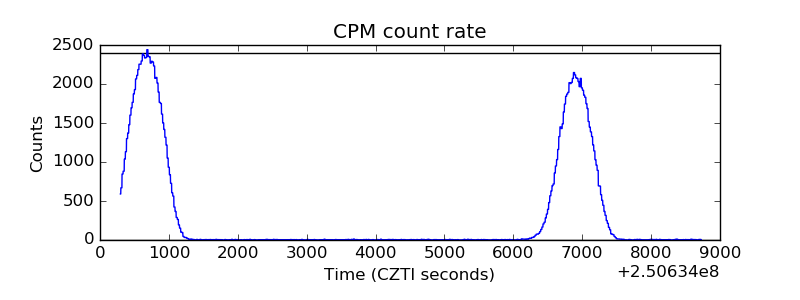 |
| CZT Counter | 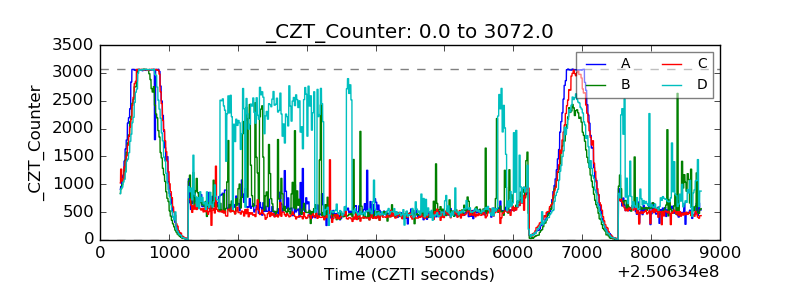 |
| +2.5 Volts monitor | 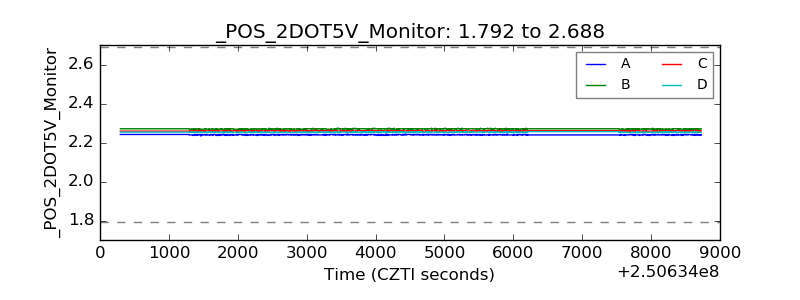 |
| +5 Volts monitor | 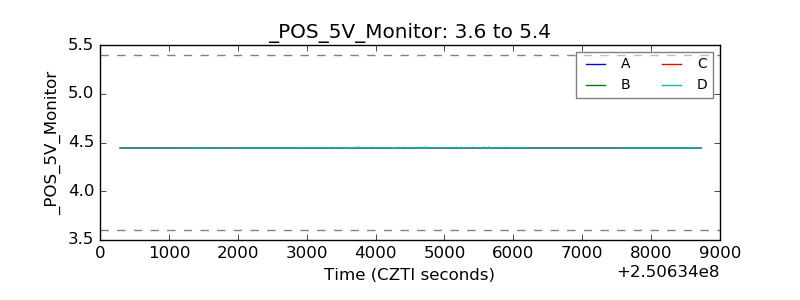 |
| _ROLL_ROT | 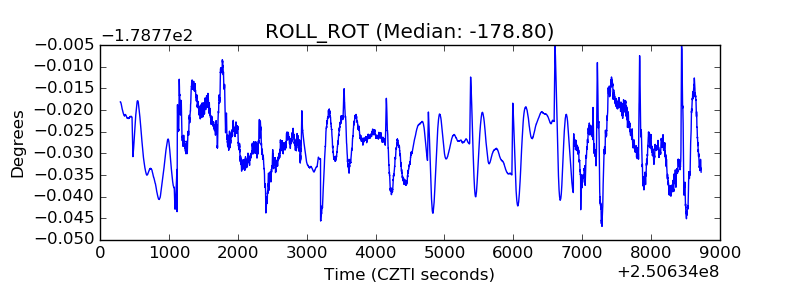 |
| _Roll_DEC | 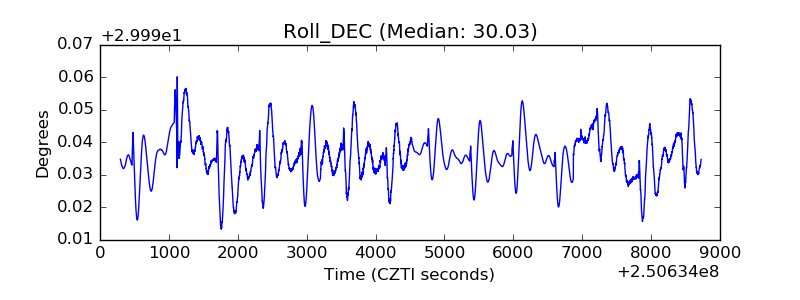 |
| _Roll_RA | 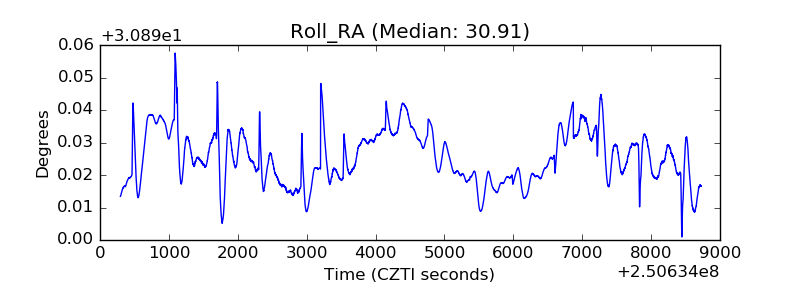 |
| Veto Counter | 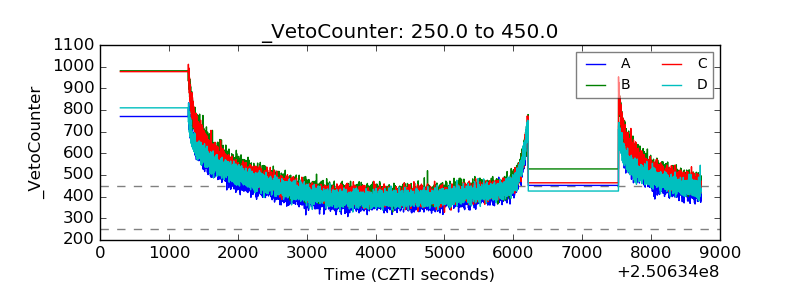 |