| Param | Original file | Final file |
|---|---|---|
| Filename | modeM0/AS1A04_088T05_9000001764_11913cztM0_level2.evt | modeM0/AS1A04_088T05_9000001764_11913cztM0_level2_quad_clean.evt |
| Size (bytes) | 493,706,880 | 86,630,400 |
| Size | 470.8 MB | 82.6 MB |
| Events in quadrant A | 3,185,956 | 556,289 |
| Events in quadrant B | 4,121,196 | 550,875 |
| Events in quadrant C | 2,914,911 | 564,826 |
| Events in quadrant D | 4,309,952 | 519,344 |
| Mode M9 | |||
|---|---|---|---|
| Quadrant | BADHDUFLAG | Total packets | Discarded packets |
| A | 0 | 23 | 0 |
| B | 0 | 23 | 0 |
| C | 0 | 23 | 0 |
| D | 0 | 24 | 0 |
| Mode M0 | |||
|---|---|---|---|
| Quadrant | BADHDUFLAG | Total packets | Discarded packets |
| A | 0 | 13443 | 3 |
| B | 0 | 16303 | 2 |
| C | 0 | 12749 | 2 |
| D | 0 | 16785 | 2 |
| Mode SS | |||
|---|---|---|---|
| Quadrant | BADHDUFLAG | Total packets | Discarded packets |
| A | 0 | 126 | 0 |
| B | 0 | 126 | 0 |
| C | 0 | 126 | 0 |
| D | 0 | 126 | 0 |
| Quadrant | Total seconds | Saturated seconds | Saturation percentage |
|---|---|---|---|
| A | 6187 | 50 | 0.808146% |
| B | 6187 | 334 | 5.398416% |
| C | 6187 | 17 | 0.274770% |
| D | 6187 | 227 | 3.668983% |
Noise dominated data is calculated using 1-second bins in cleaned event files. If a bin has >2000 counts, and if more than 50% of those come from <1% of pixels, then it is considered to be noise-dominated and hence unusable.
| Quadrant | # 1 sec bins | Bins with >0 counts | Bins with >2000 counts | High rate bins dominated by noise | Noise dominated (total time) | Noise dominated (detector-on time) | Marked lightcurve |
|---|---|---|---|---|---|---|---|
| A | 7448 | 6188 | 6 | 6 | 0.08% | 0.10% | 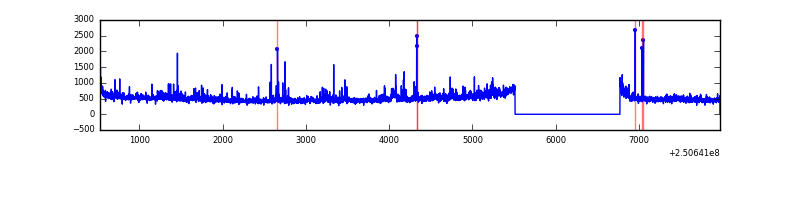 |
| B | 7448 | 6188 | 187 | 187 | 2.51% | 3.02% | 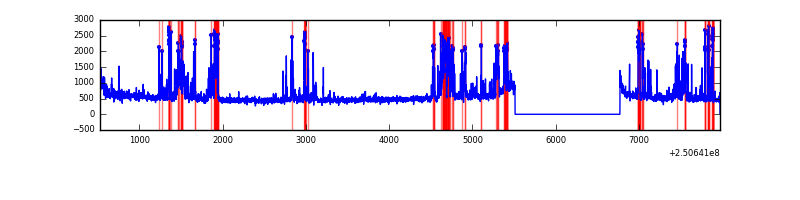 |
| C | 7448 | 6189 | 1 | 1 | 0.01% | 0.02% |  |
| D | 7448 | 6189 | 210 | 210 | 2.82% | 3.39% | 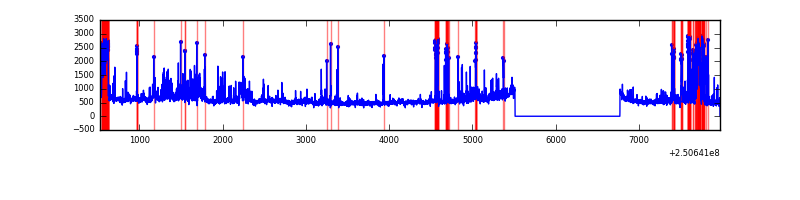 |
Top three noisy pixels from each quadrant. If the there are fewer than three noisy pixels in the level2.evt file, extra rows are filled as -1
| Pixel properties | Quadrant properties | ||||||
|---|---|---|---|---|---|---|---|
| Quadrant | DetID | PixID | Counts | Sigma | Mean | Median | Sigma |
| A | 1 | 162 | 70995 | 461.06 | 752 | 736 | 152.4 |
| A | 7 | 144 | 51041 | 330.11 | 752 | 736 | 152.4 |
| A | 1 | 178 | 35028 | 225.03 | 752 | 736 | 152.4 |
| B | 4 | 239 | 879511 | 6268.96 | 750 | 732 | 140.2 |
| B | 0 | 85 | 116731 | 827.5 | 750 | 732 | 140.2 |
| B | 15 | 204 | 75162 | 530.96 | 750 | 732 | 140.2 |
| C | 12 | 4 | 10159 | 54.72 | 744 | 749 | 172.0 |
| C | 13 | 61 | 5559 | 27.97 | 744 | 749 | 172.0 |
| C | 14 | 234 | 2330 | 9.19 | 744 | 749 | 172.0 |
| D | 1 | 52 | 611608 | 3504.37 | 725 | 704 | 174.3 |
| D | 8 | 195 | 353663 | 2024.7 | 725 | 704 | 174.3 |
| D | 5 | 222 | 344065 | 1969.65 | 725 | 704 | 174.3 |
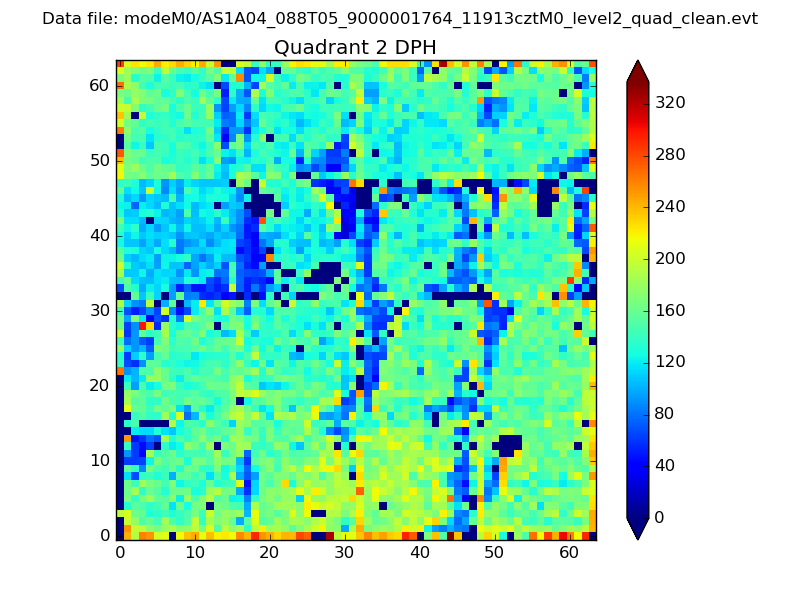
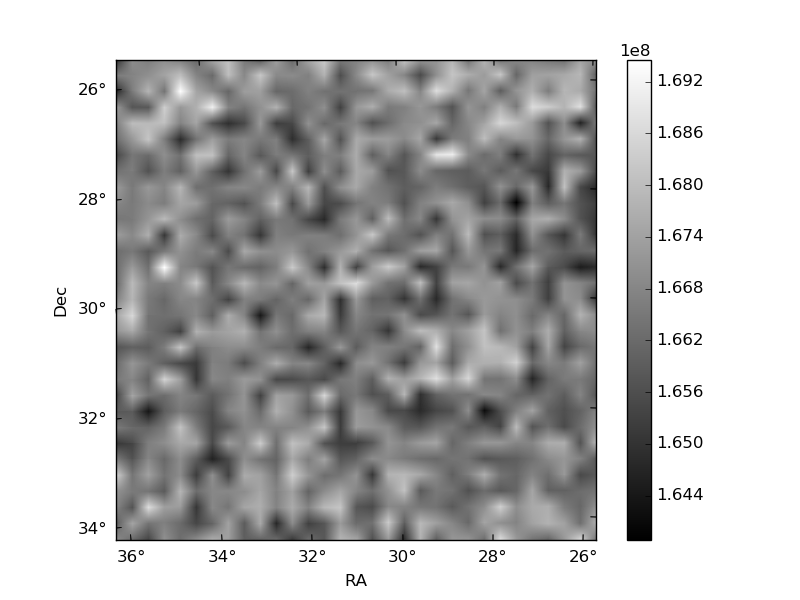
Histogram calculated using DETX and DETY for each event in the final _common_clean file
| Quadrant A | 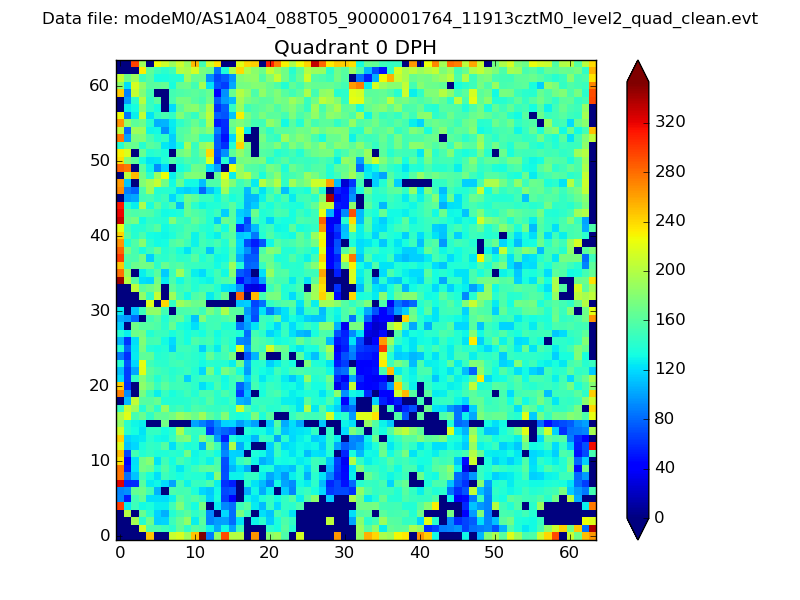 |
 |
Quadrant B |
|---|---|---|---|
| Quadrant D | 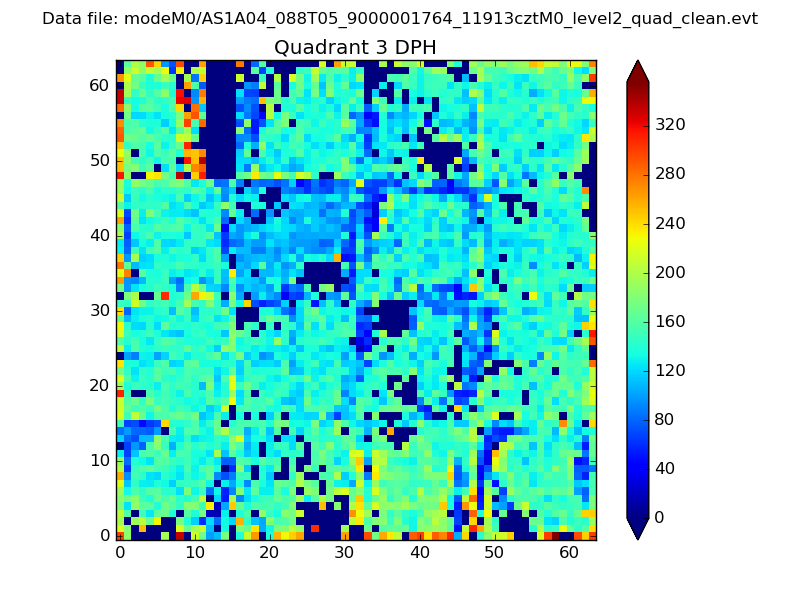 |
 |
Quadrant C |
| Plot type | Count rate plots | Images |
|---|---|---|
| Comparison with Poisson distribution Blue bars denote a histogram of data divided into 1 sec bins. Red curve is a Poisson curve with rate = median count rate of data. |
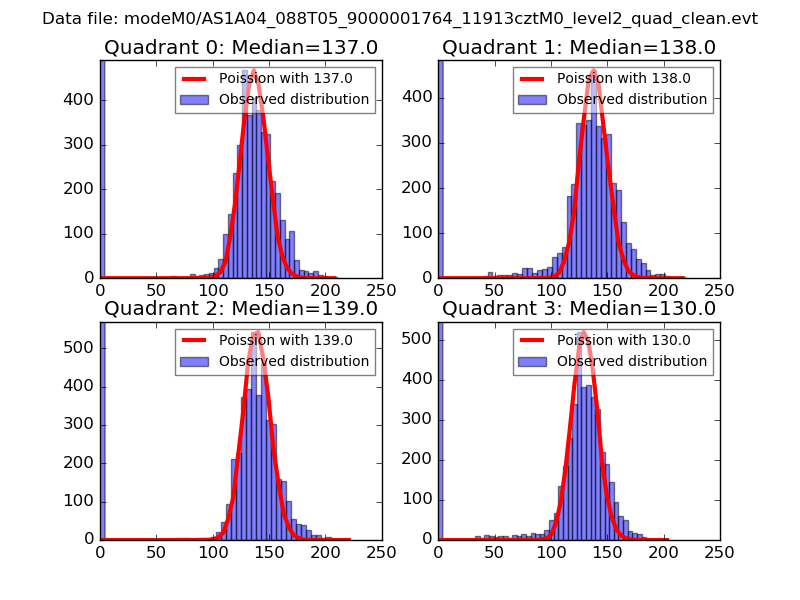 |
 |
| Quadrant-wise count rates Data is divided into 100 sec bins |
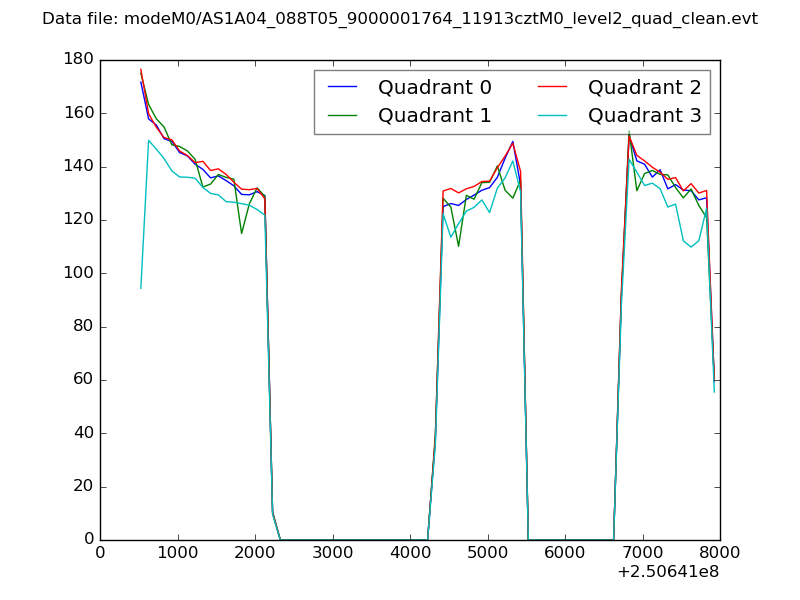 |
|
| Module-wise count rates for Quadrant A Data is divided into 100 sec bins |
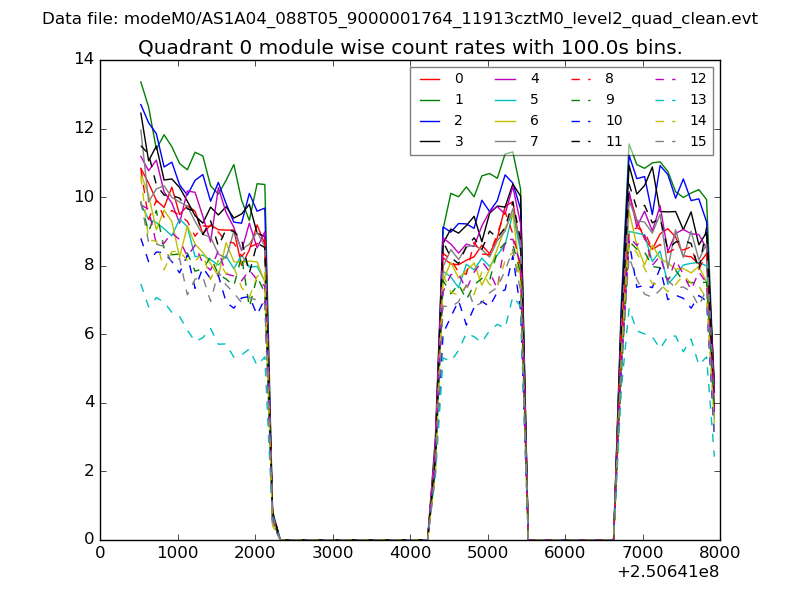 |
 |
| Module-wise count rates for Quadrant B Data is divided into 100 sec bins |
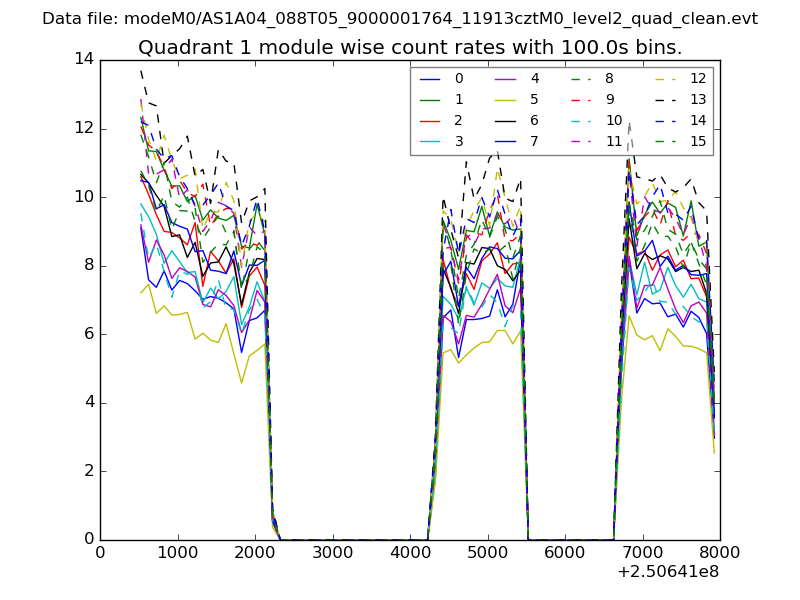 |
 |
| Module-wise count rates for Quadrant C Data is divided into 100 sec bins |
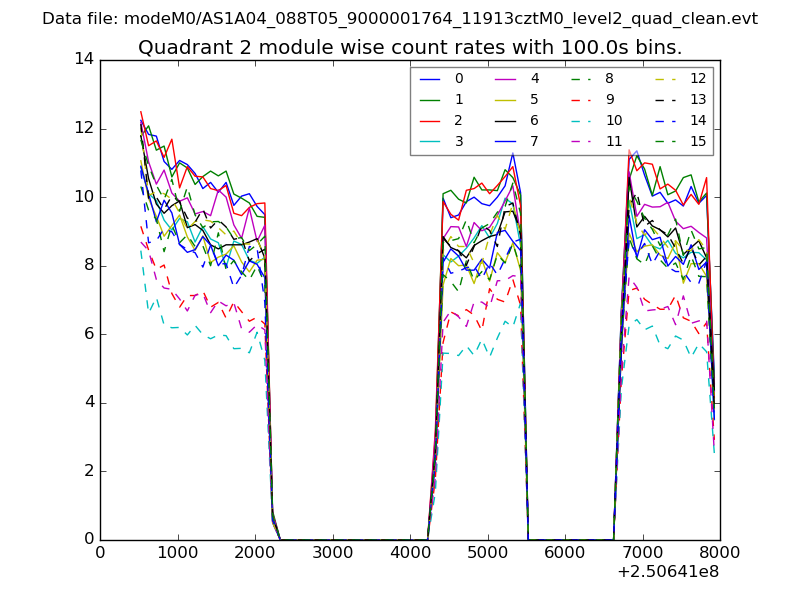 |
 |
| Module-wise count rates for Quadrant D Data is divided into 100 sec bins |
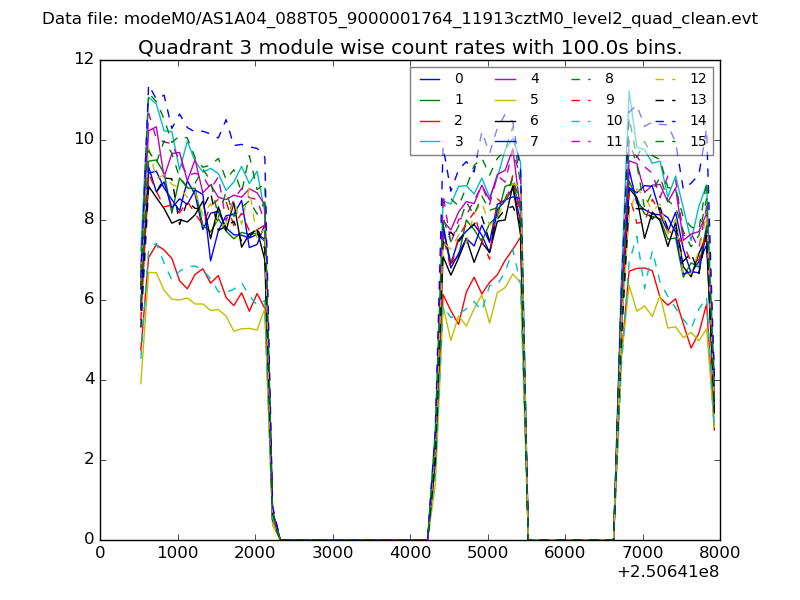 |
 |
| Parameter | Plot |
|---|---|
| CZT HV Monitor | 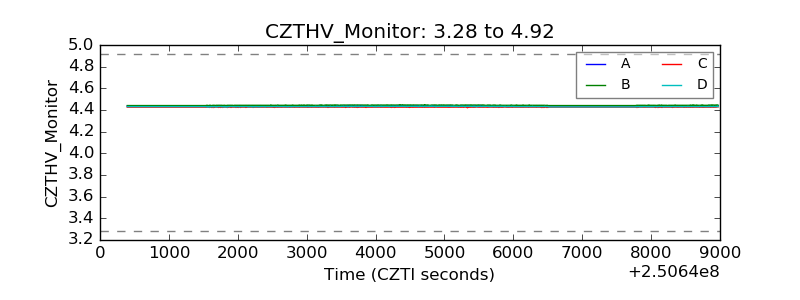 |
| D_VDD | 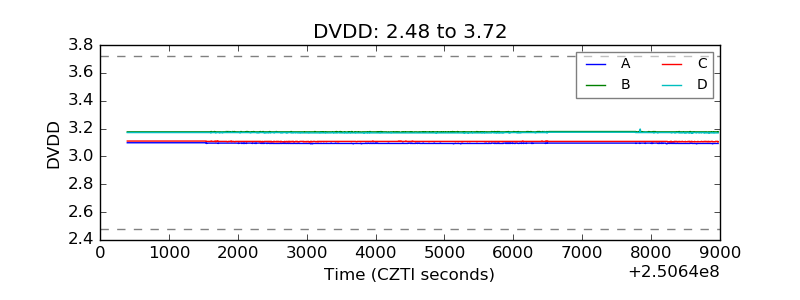 |
| Temperature 1 | 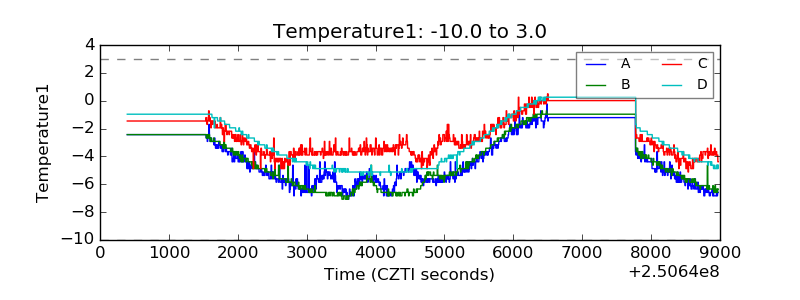 |
| Veto HV Monitor | 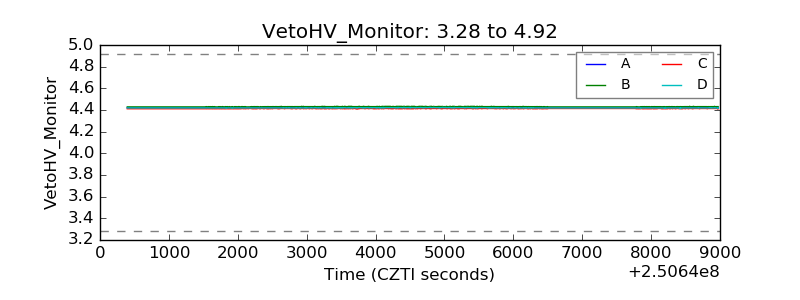 |
| Veto LLD | 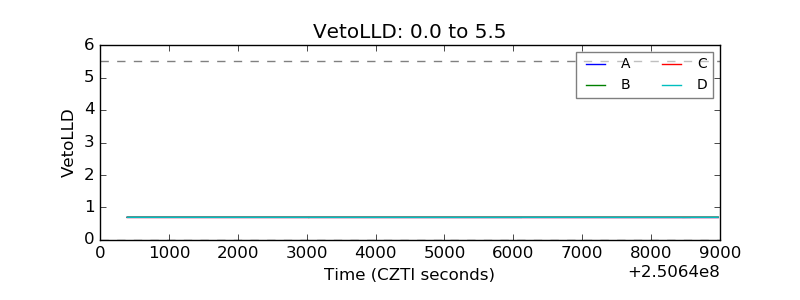 |
| Alpha Counter | 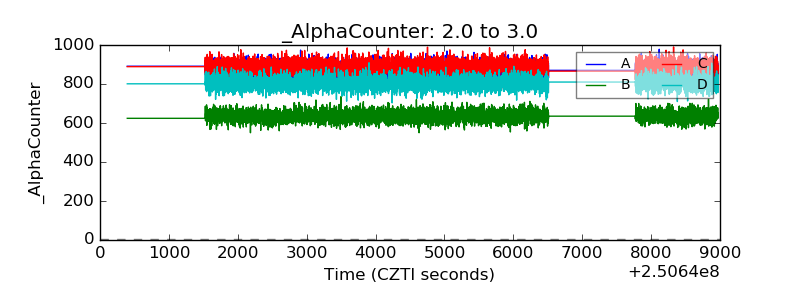 |
| _CPM_Rate | 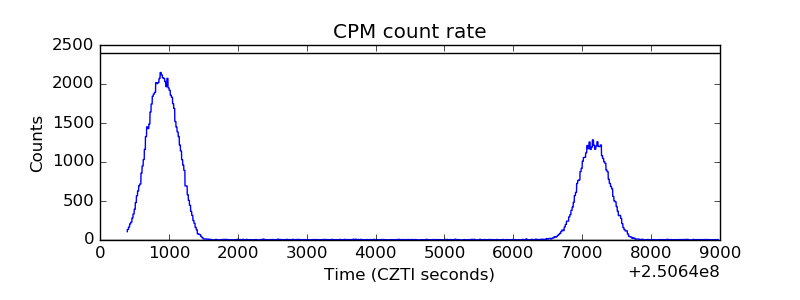 |
| CZT Counter | 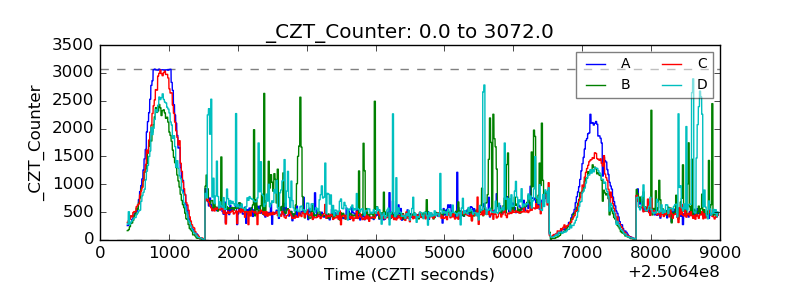 |
| +2.5 Volts monitor |  |
| +5 Volts monitor |  |
| _ROLL_ROT | 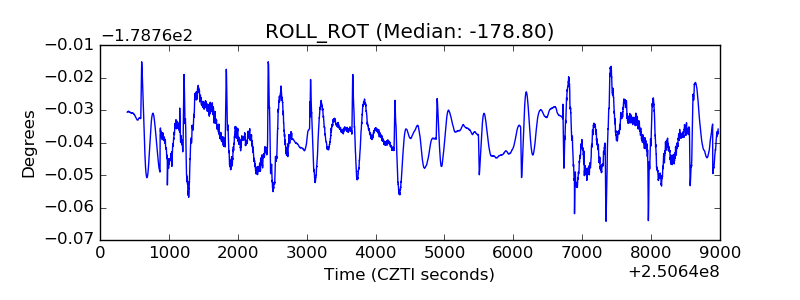 |
| _Roll_DEC | 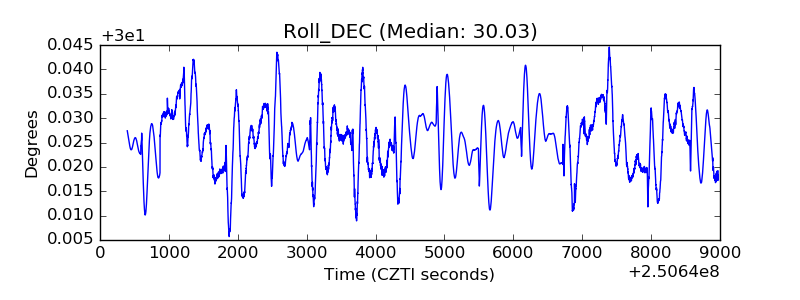 |
| _Roll_RA | 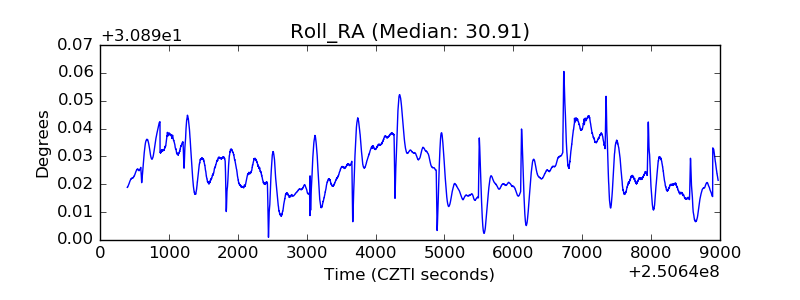 |
| Veto Counter | 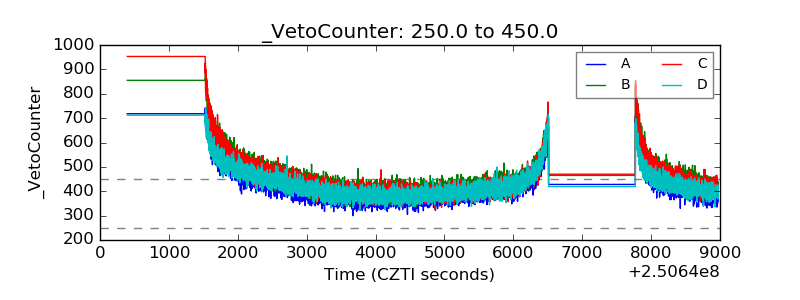 |