| Param | Original file | Final file |
|---|---|---|
| Filename | modeM0/AS1A04_088T05_9000001764_11917cztM0_level2.evt | modeM0/AS1A04_088T05_9000001764_11917cztM0_level2_quad_clean.evt |
| Size (bytes) | 579,280,320 | 76,003,200 |
| Size | 552.4 MB | 72.5 MB |
| Events in quadrant A | 4,031,604 | 452,069 |
| Events in quadrant B | 5,058,318 | 423,680 |
| Events in quadrant C | 3,382,674 | 463,421 |
| Events in quadrant D | 4,565,095 | 442,887 |
| Mode M9 | |||
|---|---|---|---|
| Quadrant | BADHDUFLAG | Total packets | Discarded packets |
| A | 0 | 3 | 0 |
| B | 0 | 3 | 0 |
| C | 0 | 3 | 0 |
| D | 0 | 3 | 0 |
| Mode M0 | |||
|---|---|---|---|
| Quadrant | BADHDUFLAG | Total packets | Discarded packets |
| A | 0 | 16789 | 2 |
| B | 0 | 20016 | 1 |
| C | 0 | 15326 | 1 |
| D | 0 | 18370 | 1 |
| Mode SS | |||
|---|---|---|---|
| Quadrant | BADHDUFLAG | Total packets | Discarded packets |
| A | 0 | 148 | 0 |
| B | 0 | 148 | 0 |
| C | 0 | 148 | 0 |
| D | 0 | 148 | 0 |
| Quadrant | Total seconds | Saturated seconds | Saturation percentage |
|---|---|---|---|
| A | 7469 | 137 | 1.834248% |
| B | 7469 | 649 | 8.689249% |
| C | 7469 | 56 | 0.749766% |
| D | 7469 | 227 | 3.039229% |
Noise dominated data is calculated using 1-second bins in cleaned event files. If a bin has >2000 counts, and if more than 50% of those come from <1% of pixels, then it is considered to be noise-dominated and hence unusable.
| Quadrant | # 1 sec bins | Bins with >0 counts | Bins with >2000 counts | High rate bins dominated by noise | Noise dominated (total time) | Noise dominated (detector-on time) | Marked lightcurve |
|---|---|---|---|---|---|---|---|
| A | 7721 | 7471 | 1 | 1 | 0.01% | 0.01% | 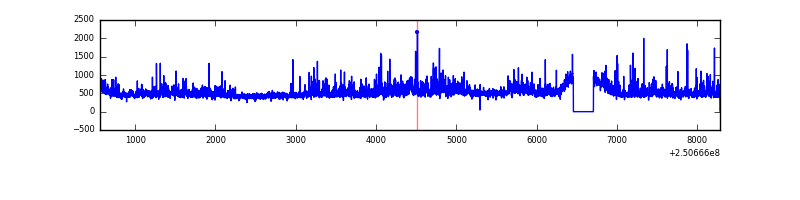 |
| B | 7721 | 7471 | 429 | 429 | 5.56% | 5.74% | 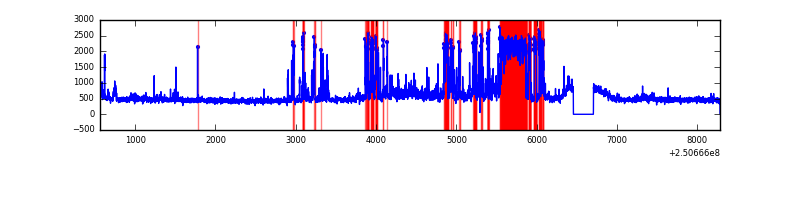 |
| C | 7721 | 7472 | 5 | 5 | 0.06% | 0.07% | 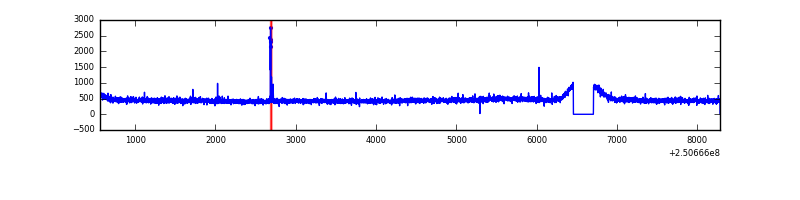 |
| D | 7721 | 7471 | 165 | 165 | 2.14% | 2.21% | 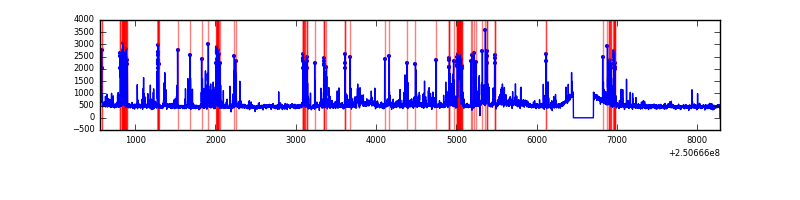 |
Top three noisy pixels from each quadrant. If the there are fewer than three noisy pixels in the level2.evt file, extra rows are filled as -1
| Pixel properties | Quadrant properties | ||||||
|---|---|---|---|---|---|---|---|
| Quadrant | DetID | PixID | Counts | Sigma | Mean | Median | Sigma |
| A | 8 | 15 | 204556 | 1146.19 | 871 | 851 | 177.7 |
| A | 1 | 162 | 178071 | 997.16 | 871 | 851 | 177.7 |
| A | 1 | 178 | 92852 | 517.66 | 871 | 851 | 177.7 |
| B | 4 | 239 | 1249531 | 7519.77 | 854 | 832 | 166.1 |
| B | 15 | 204 | 212720 | 1276.01 | 854 | 832 | 166.1 |
| B | 10 | 245 | 107337 | 641.38 | 854 | 832 | 166.1 |
| C | 14 | 234 | 23612 | 113.5 | 862 | 868 | 200.4 |
| C | 13 | 61 | 6273 | 26.97 | 862 | 868 | 200.4 |
| C | 3 | 202 | 2120 | 6.25 | 862 | 868 | 200.4 |
| D | 4 | 95 | 336972 | 1647.71 | 848 | 826 | 204.0 |
| D | 8 | 195 | 285416 | 1394.99 | 848 | 826 | 204.0 |
| D | 10 | 199 | 282230 | 1379.38 | 848 | 826 | 204.0 |
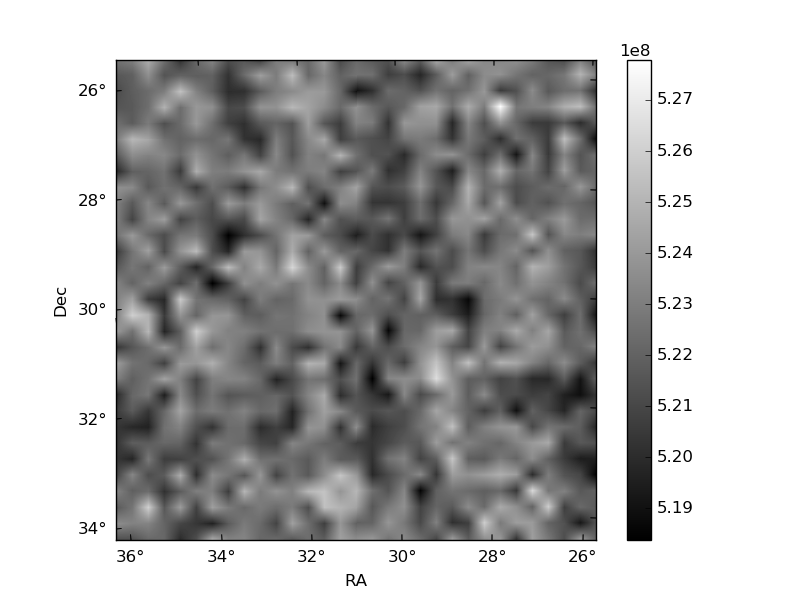
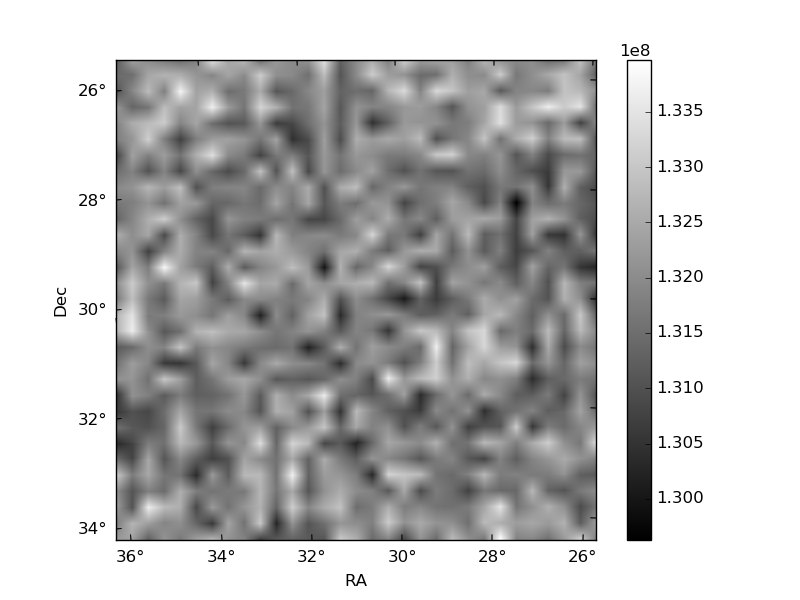
Histogram calculated using DETX and DETY for each event in the final _common_clean file
| Quadrant A | 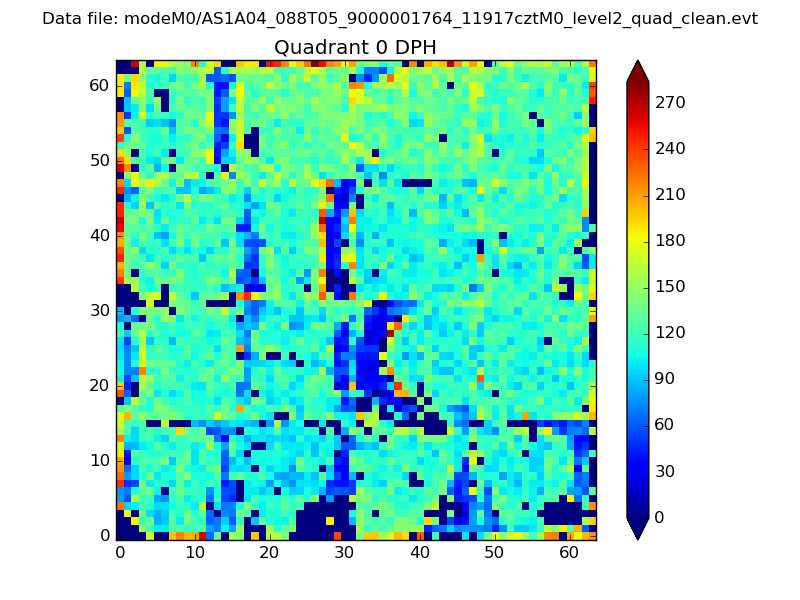 |
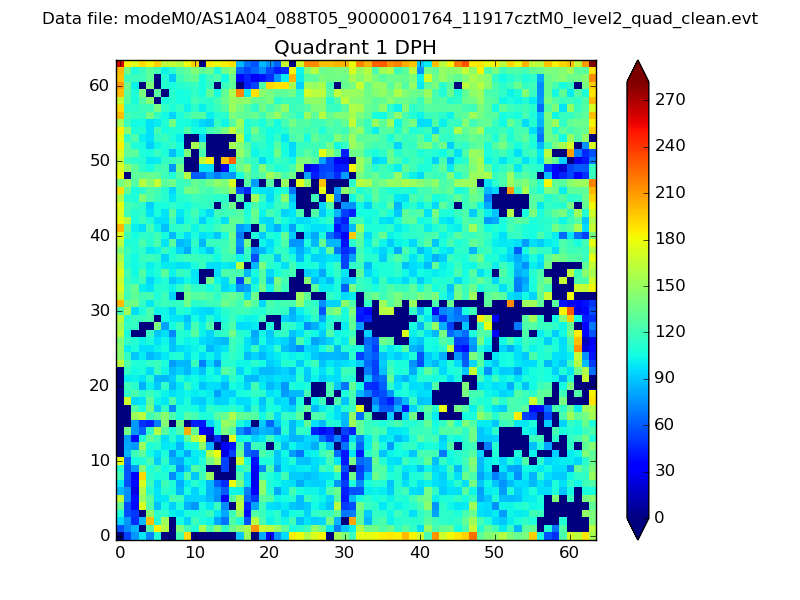 |
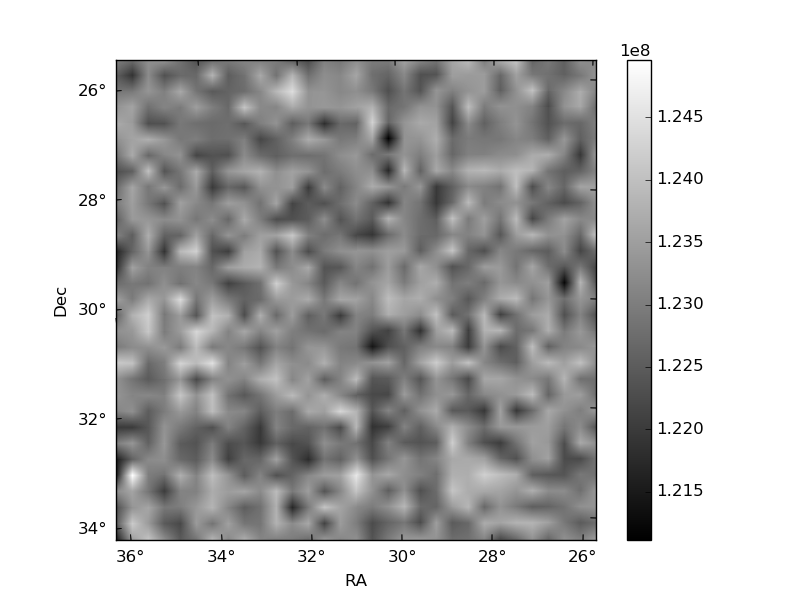
Quadrant B |
|---|---|---|---|
| Quadrant D | 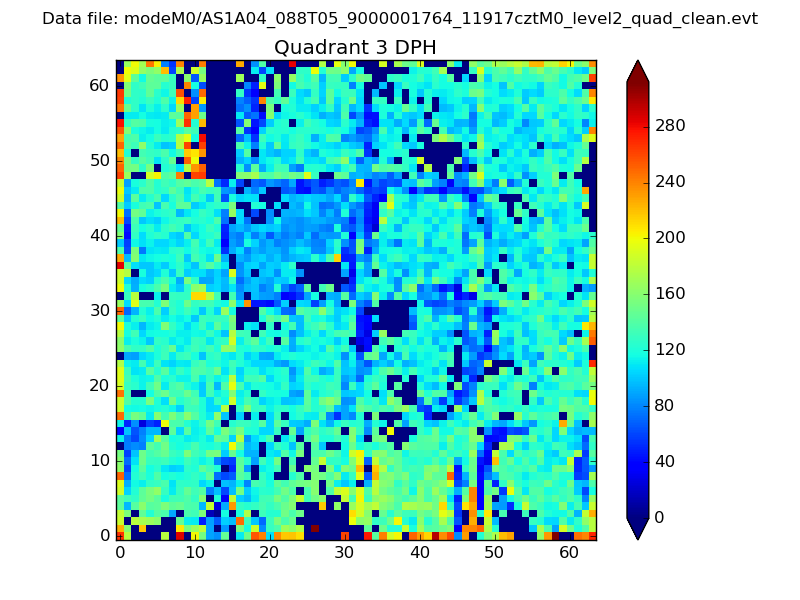 |
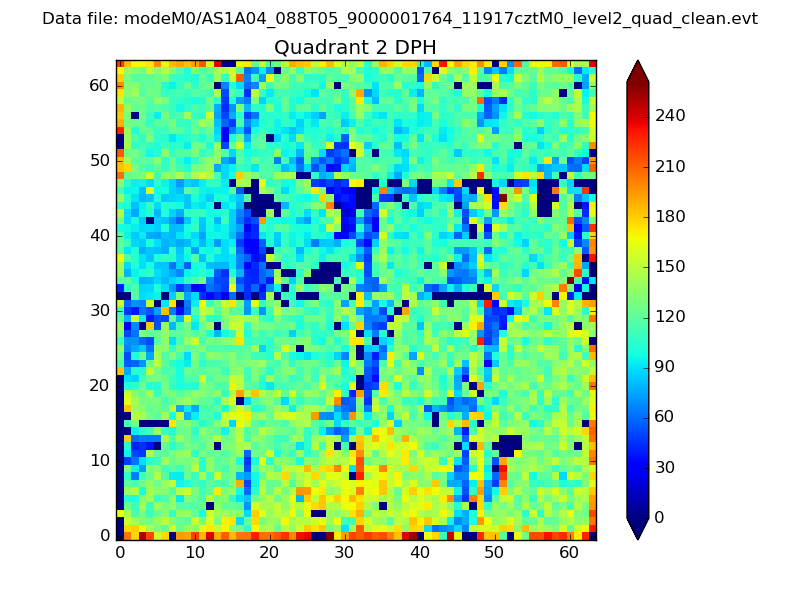 |
Quadrant C |
| Plot type | Count rate plots | Images |
|---|---|---|
| Comparison with Poisson distribution Blue bars denote a histogram of data divided into 1 sec bins. Red curve is a Poisson curve with rate = median count rate of data. |
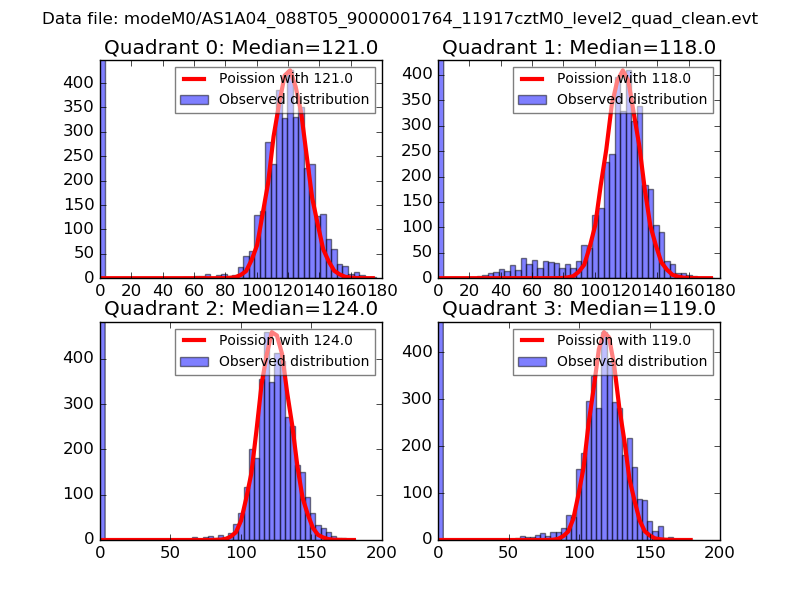 |
 |
| Quadrant-wise count rates Data is divided into 100 sec bins |
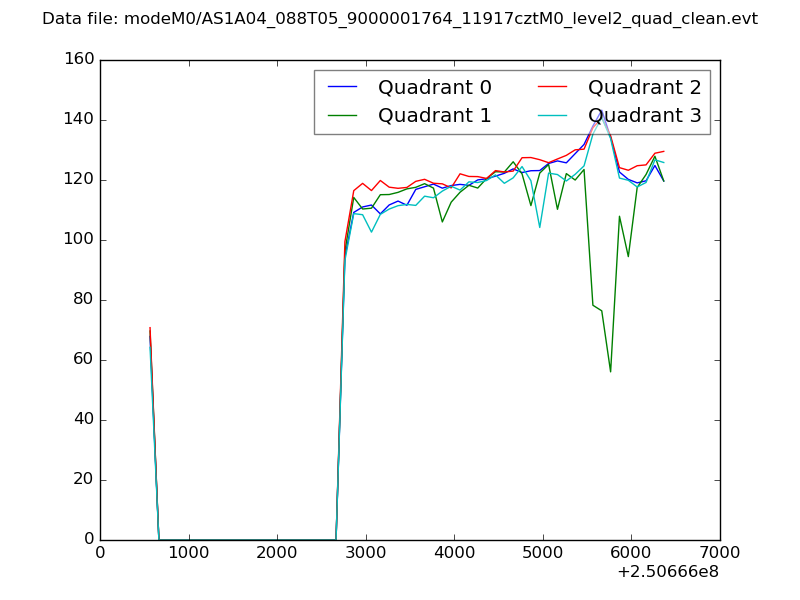 |
|
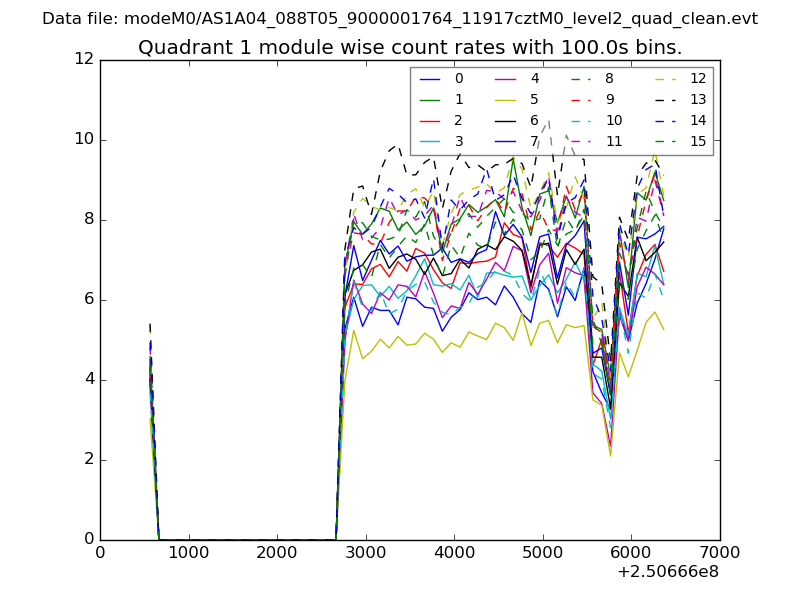
| Module-wise count rates for Quadrant A Data is divided into 100 sec bins |
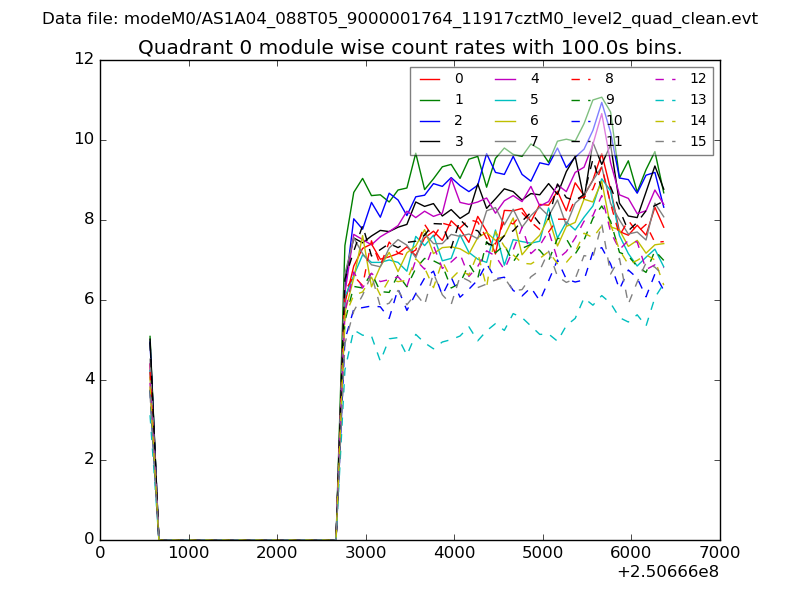 |
 |
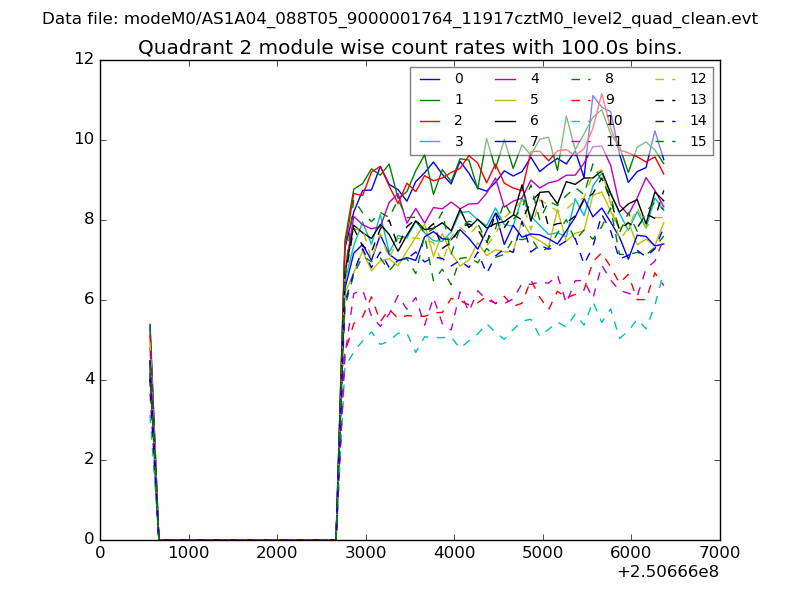
| Module-wise count rates for Quadrant B Data is divided into 100 sec bins |
 |
 |
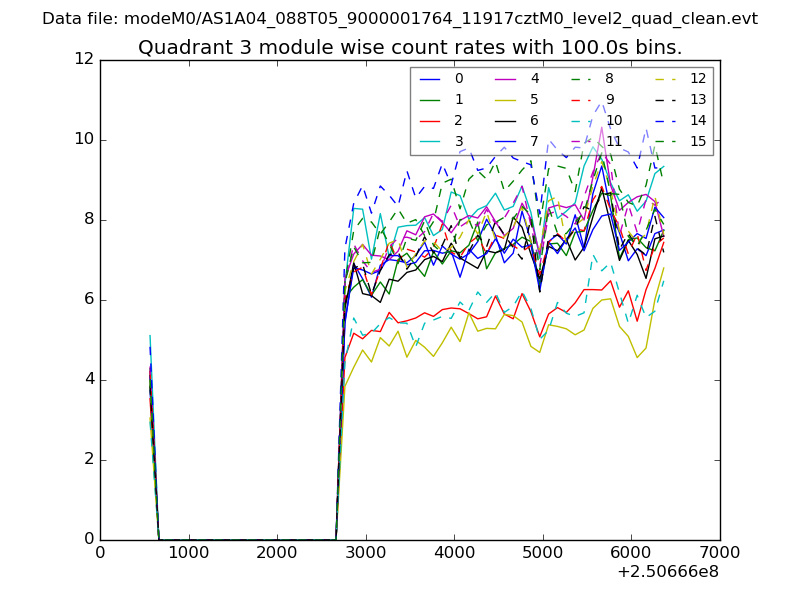
| Module-wise count rates for Quadrant C Data is divided into 100 sec bins |
 |
 |
| Module-wise count rates for Quadrant D Data is divided into 100 sec bins |
 |
 |
| Parameter | Plot |
|---|---|
| CZT HV Monitor | 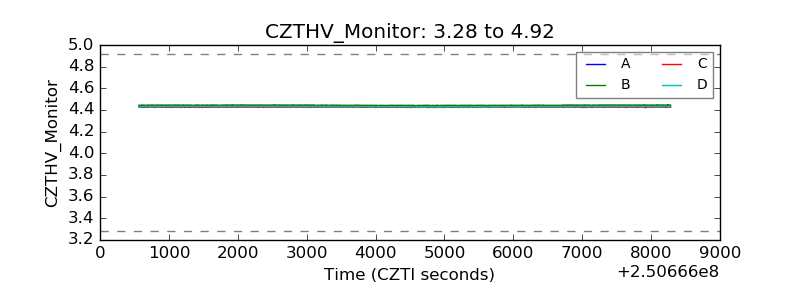 |
| D_VDD | 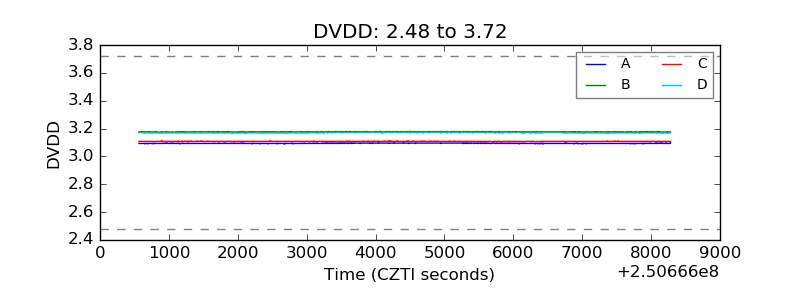 |
| Temperature 1 | 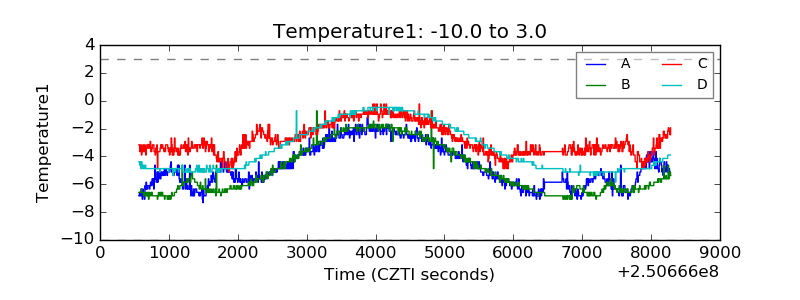 |
| Veto HV Monitor | 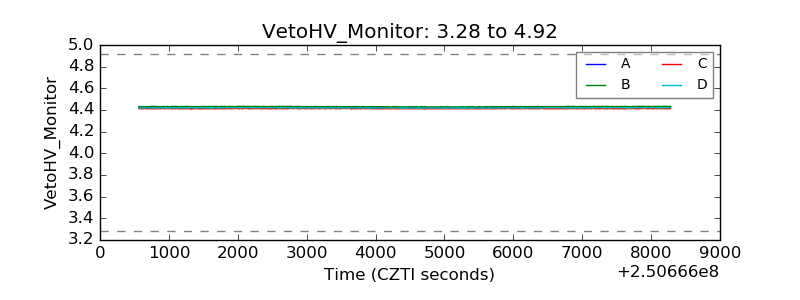 |
| Veto LLD | 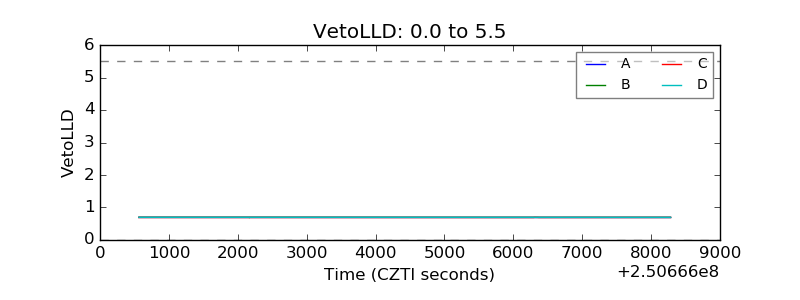 |
| Alpha Counter | 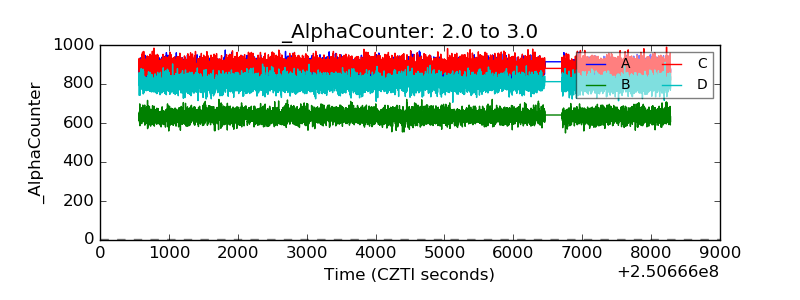 |
| _CPM_Rate | 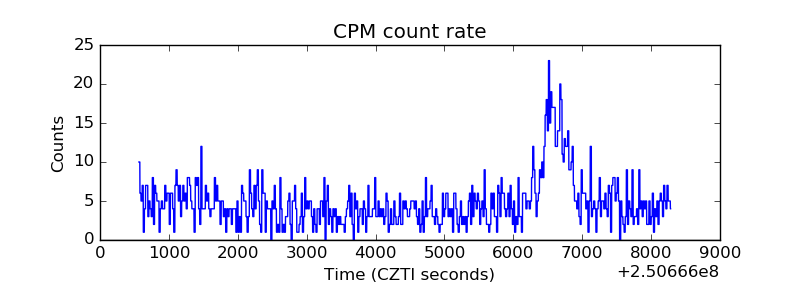 |
| CZT Counter | 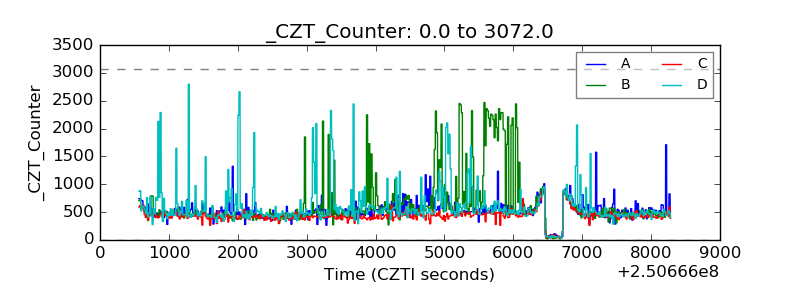 |
| +2.5 Volts monitor |  |
| +5 Volts monitor |  |
| _ROLL_ROT | 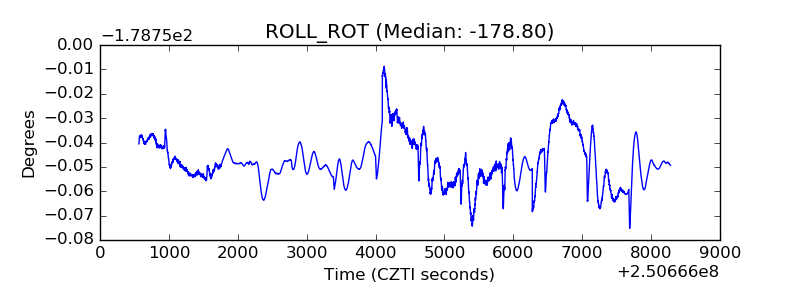 |
| _Roll_DEC | 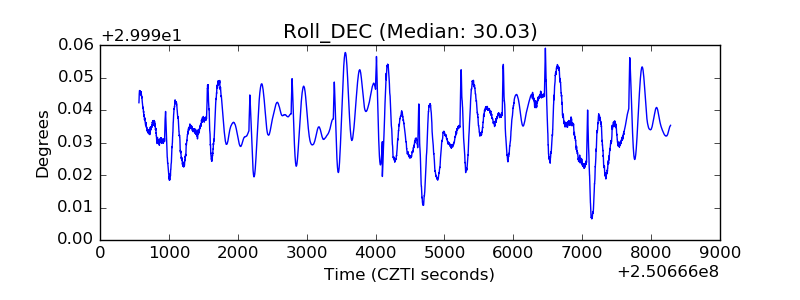 |
| _Roll_RA | 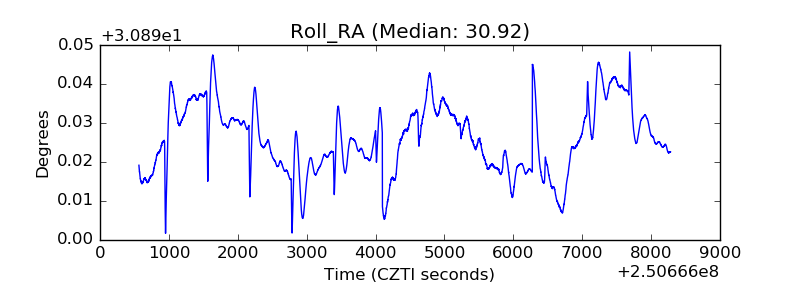 |
| Veto Counter | 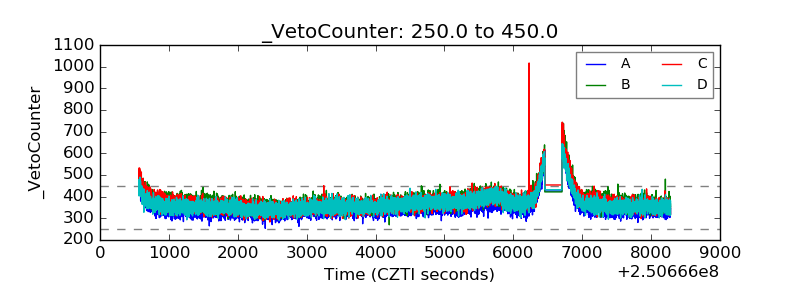 |