| Param | Original file | Final file |
|---|---|---|
| Filename | modeM0/AS1A04_088T05_9000001764_11920cztM0_level2.evt | modeM0/AS1A04_088T05_9000001764_11920cztM0_level2_quad_clean.evt |
| Size (bytes) | 1,435,409,280 | 231,050,880 |
| Size | 1.3 GB | 220.3 MB |
| Events in quadrant A | 9,916,117 | 1,438,033 |
| Events in quadrant B | 12,286,131 | 1,390,944 |
| Events in quadrant C | 8,578,797 | 1,464,253 |
| Events in quadrant D | 11,410,327 | 1,398,629 |
| Mode M9 | |||
|---|---|---|---|
| Quadrant | BADHDUFLAG | Total packets | Discarded packets |
| A | 0 | 18 | 0 |
| B | 0 | 18 | 0 |
| C | 0 | 18 | 0 |
| D | 0 | 18 | 0 |
| Mode M0 | |||
|---|---|---|---|
| Quadrant | BADHDUFLAG | Total packets | Discarded packets |
| A | 0 | 41154 | 6 |
| B | 0 | 48386 | 5 |
| C | 0 | 38701 | 5 |
| D | 0 | 45811 | 5 |
| Mode SS | |||
|---|---|---|---|
| Quadrant | BADHDUFLAG | Total packets | Discarded packets |
| A | 0 | 388 | 0 |
| B | 0 | 388 | 0 |
| C | 0 | 388 | 0 |
| D | 0 | 388 | 0 |
| Quadrant | Total seconds | Saturated seconds | Saturation percentage |
|---|---|---|---|
| A | 18949 | 448 | 2.364241% |
| B | 18949 | 1188 | 6.269460% |
| C | 18949 | 223 | 1.176843% |
| D | 18949 | 513 | 2.707267% |
Noise dominated data is calculated using 1-second bins in cleaned event files. If a bin has >2000 counts, and if more than 50% of those come from <1% of pixels, then it is considered to be noise-dominated and hence unusable.
| Quadrant | # 1 sec bins | Bins with >0 counts | Bins with >2000 counts | High rate bins dominated by noise | Noise dominated (total time) | Noise dominated (detector-on time) | Marked lightcurve |
|---|---|---|---|---|---|---|---|
| A | 20760 | 18950 | 5 | 5 | 0.02% | 0.03% | 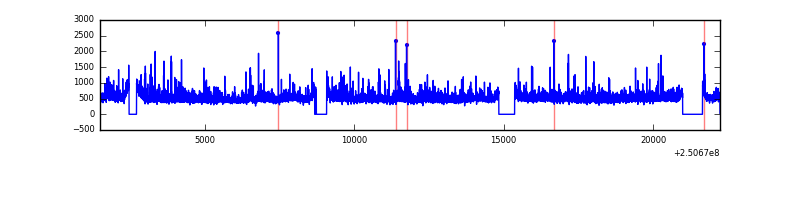 |
| B | 20760 | 18950 | 635 | 635 | 3.06% | 3.35% | 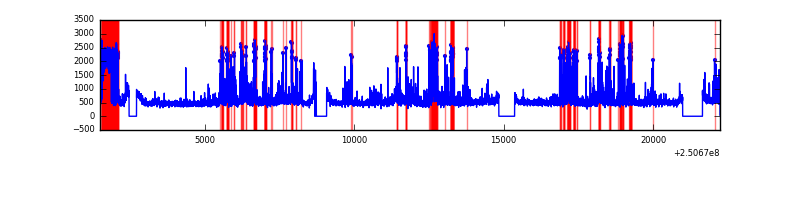 |
| C | 20760 | 18952 | 0 | 0 | 0.00% | 0.00% | 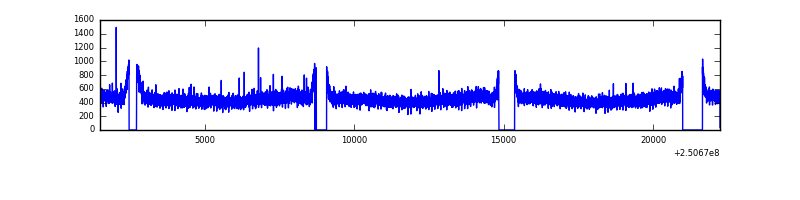 |
| D | 20760 | 18951 | 230 | 230 | 1.11% | 1.21% | 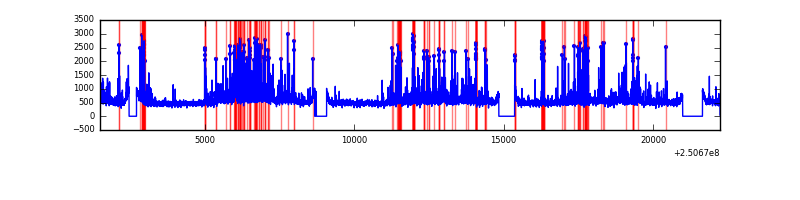 |
Top three noisy pixels from each quadrant. If the there are fewer than three noisy pixels in the level2.evt file, extra rows are filled as -1
| Pixel properties | Quadrant properties | ||||||
|---|---|---|---|---|---|---|---|
| Quadrant | DetID | PixID | Counts | Sigma | Mean | Median | Sigma |
| A | 1 | 162 | 381654 | 831.28 | 2238 | 2186 | 456.5 |
| A | 8 | 15 | 333544 | 725.88 | 2238 | 2186 | 456.5 |
| A | 1 | 178 | 194655 | 421.63 | 2238 | 2186 | 456.5 |
| B | 4 | 239 | 2613300 | 6125.81 | 2208 | 2153 | 426.3 |
| B | 15 | 204 | 539673 | 1261.03 | 2208 | 2153 | 426.3 |
| B | 0 | 85 | 152216 | 352.05 | 2208 | 2153 | 426.3 |
| C | 13 | 61 | 16040 | 27.37 | 2199 | 2216 | 505.0 |
| C | 14 | 234 | 8253 | 11.95 | 2199 | 2216 | 505.0 |
| C | 3 | 202 | 5338 | 6.18 | 2199 | 2216 | 505.0 |
| D | 8 | 195 | 1324448 | 2510.98 | 2182 | 2116 | 526.6 |
| D | 1 | 52 | 415343 | 784.68 | 2182 | 2116 | 526.6 |
| D | 10 | 199 | 368269 | 695.29 | 2182 | 2116 | 526.6 |
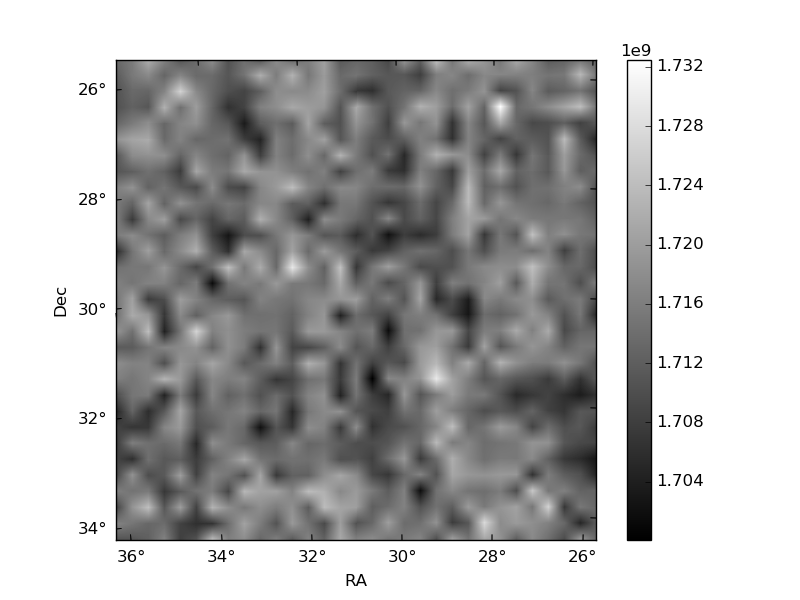
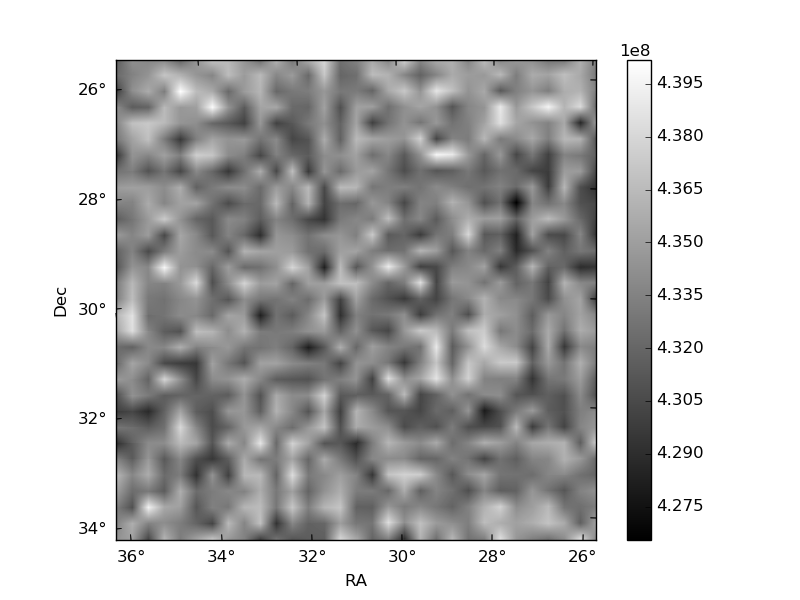
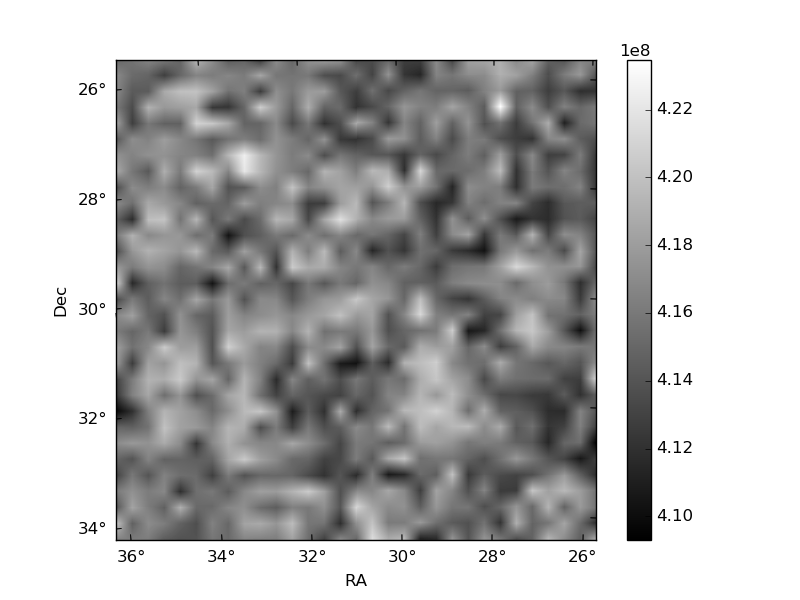
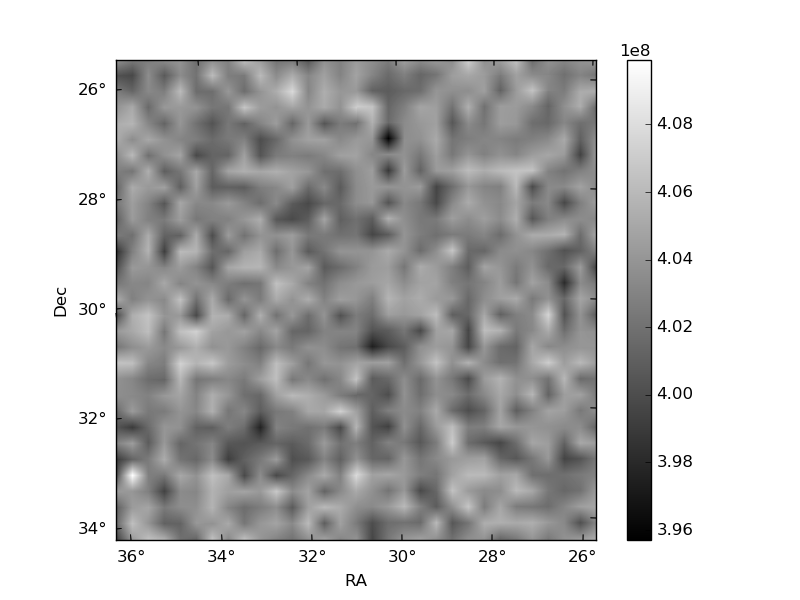
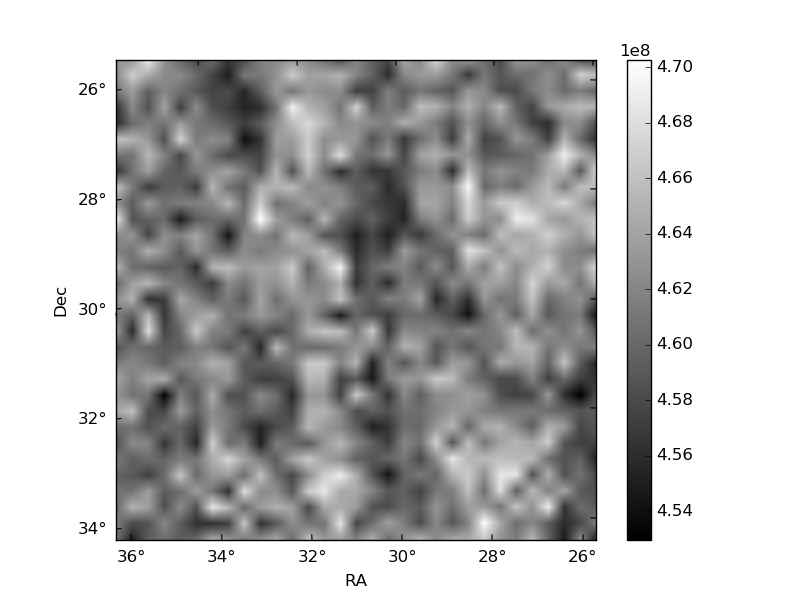
Histogram calculated using DETX and DETY for each event in the final _common_clean file
| Quadrant A | 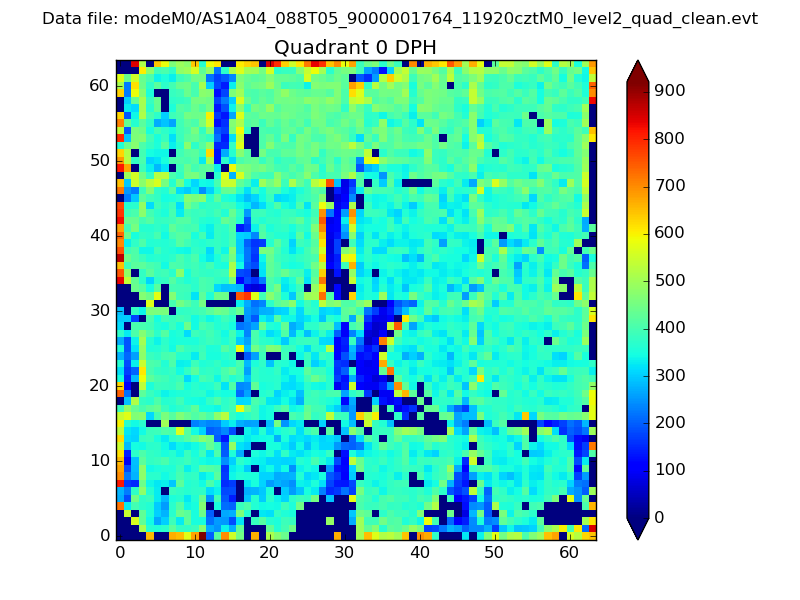 |
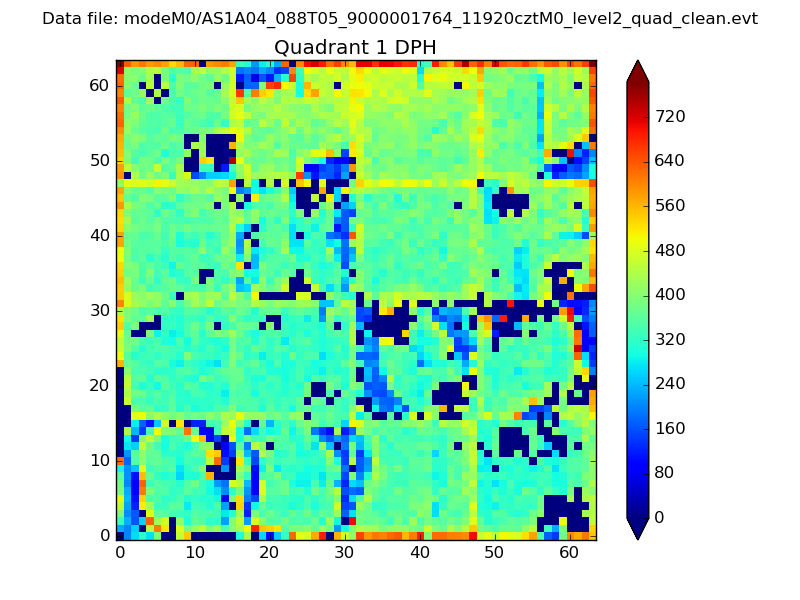 |
Quadrant B |
|---|---|---|---|
| Quadrant D | 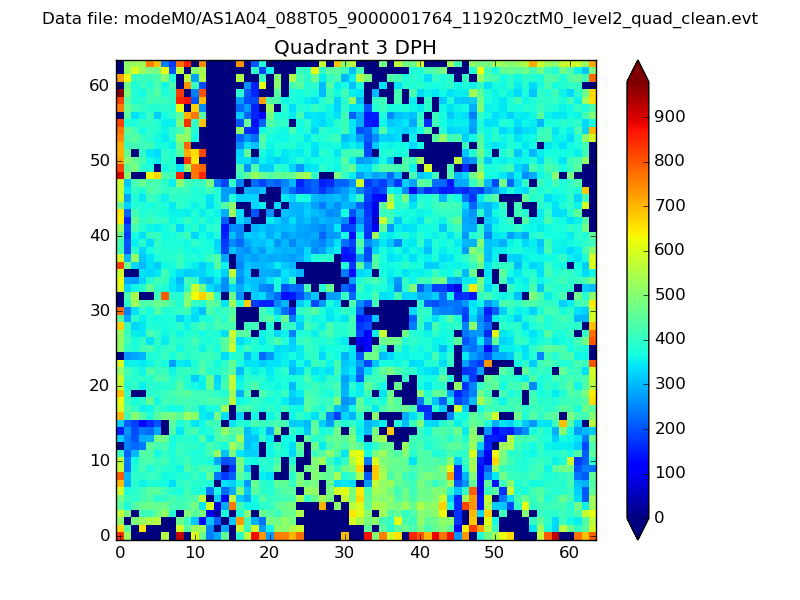 |
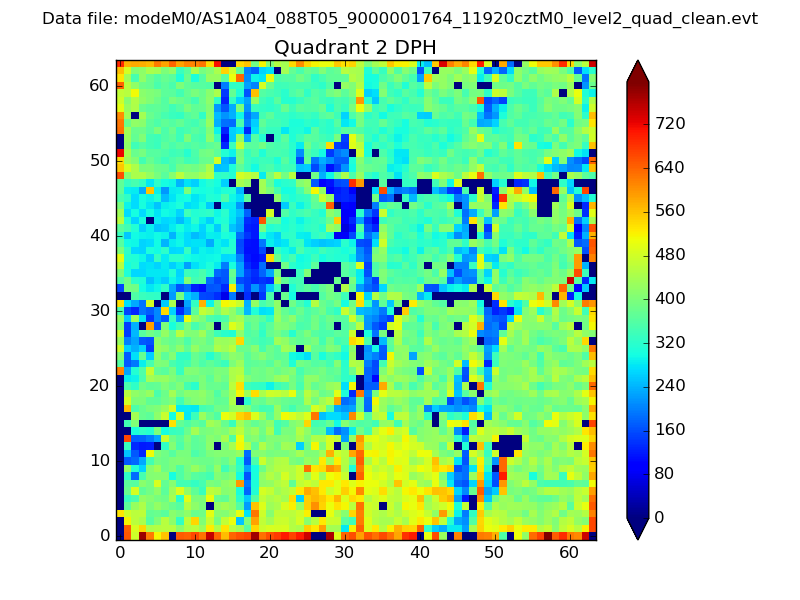 |
Quadrant C |
| Plot type | Count rate plots | Images |
|---|---|---|
| Comparison with Poisson distribution Blue bars denote a histogram of data divided into 1 sec bins. Red curve is a Poisson curve with rate = median count rate of data. |
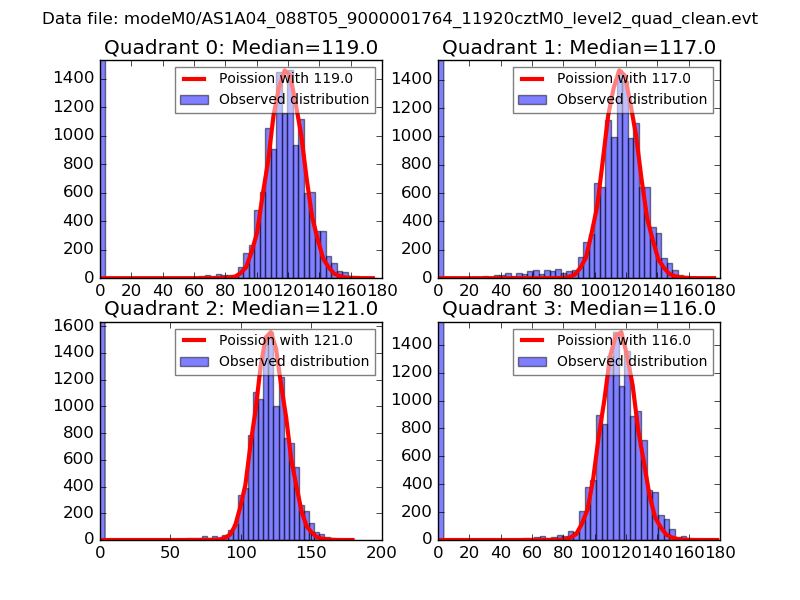 |
 |
| Quadrant-wise count rates Data is divided into 100 sec bins |
 |
|
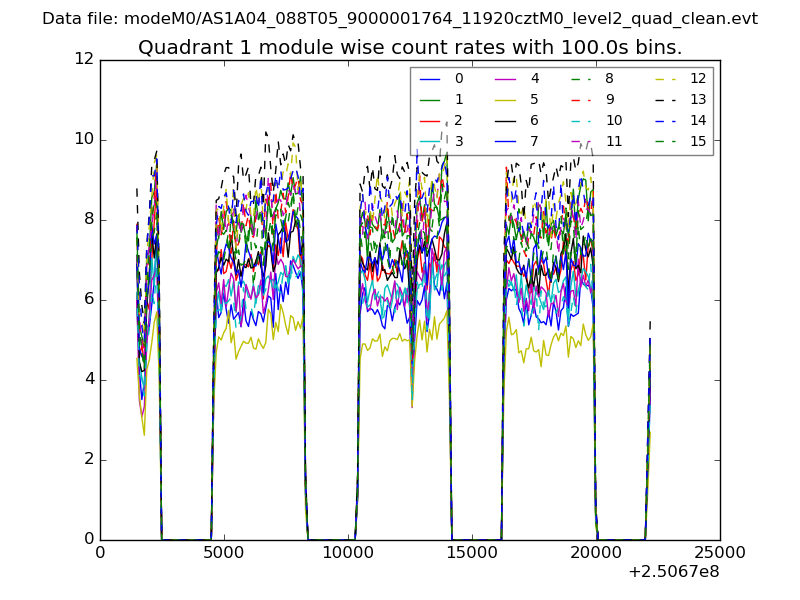
| Module-wise count rates for Quadrant A Data is divided into 100 sec bins |
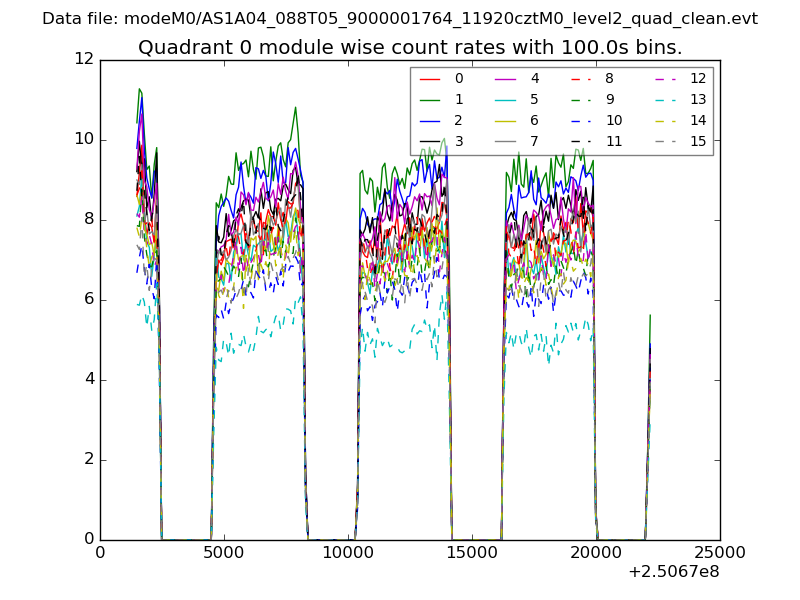 |
 |
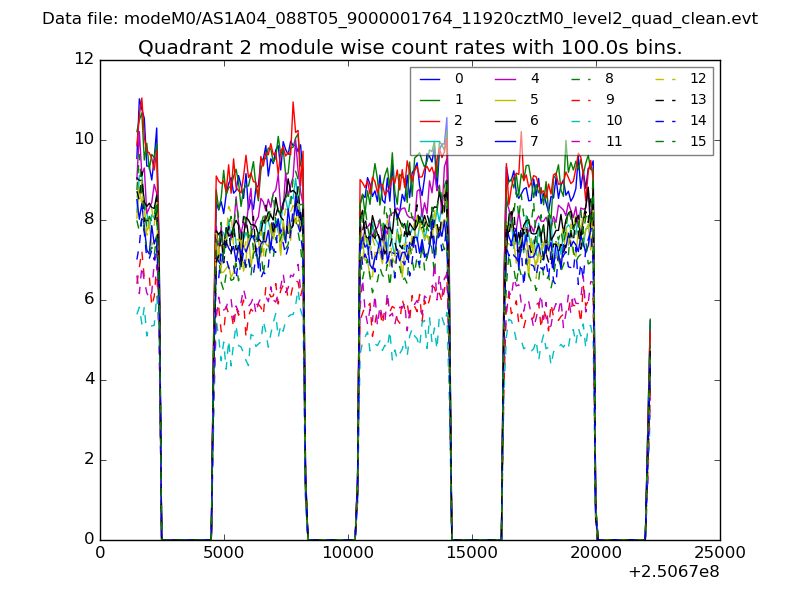
| Module-wise count rates for Quadrant B Data is divided into 100 sec bins |
 |
 |
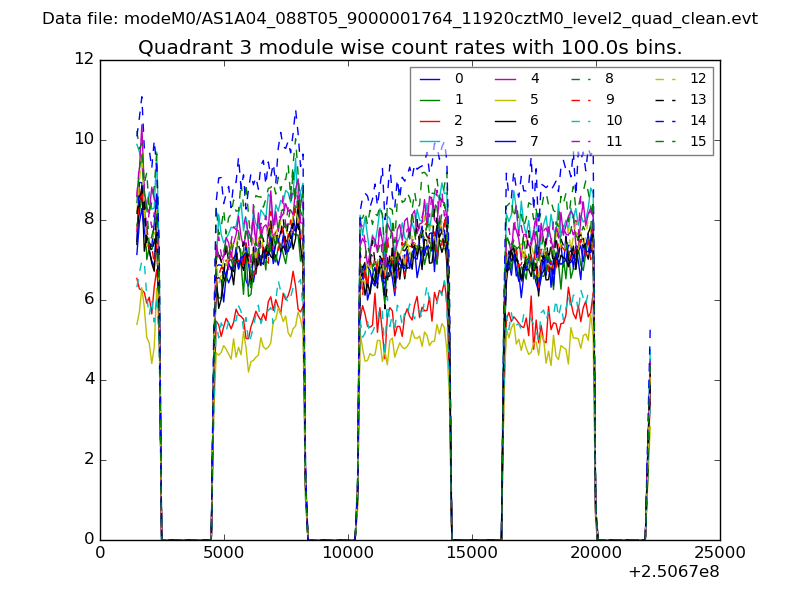
| Module-wise count rates for Quadrant C Data is divided into 100 sec bins |
 |
 |
| Module-wise count rates for Quadrant D Data is divided into 100 sec bins |
 |
 |
| Parameter | Plot |
|---|---|
| CZT HV Monitor | 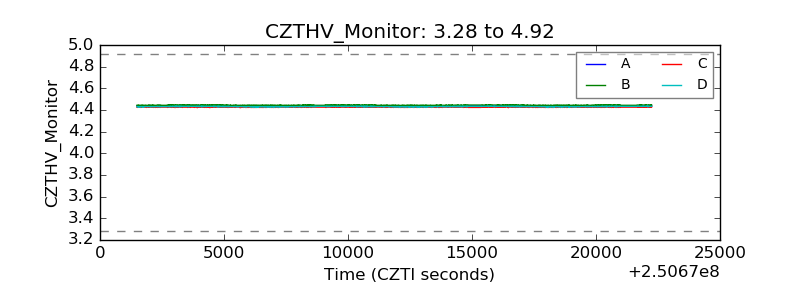 |
| D_VDD | 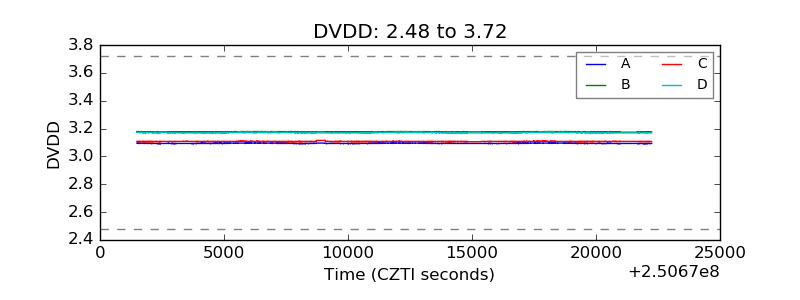 |
| Temperature 1 | 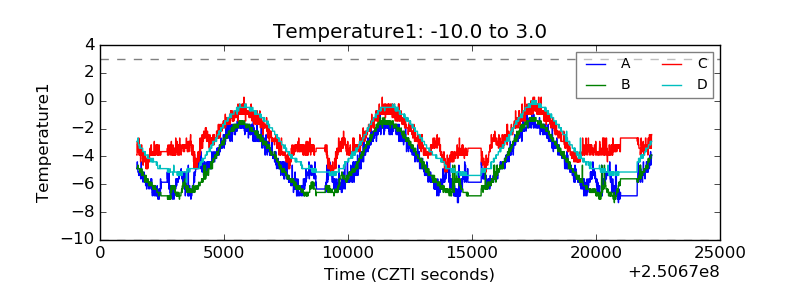 |
| Veto HV Monitor |  |
| Veto LLD | 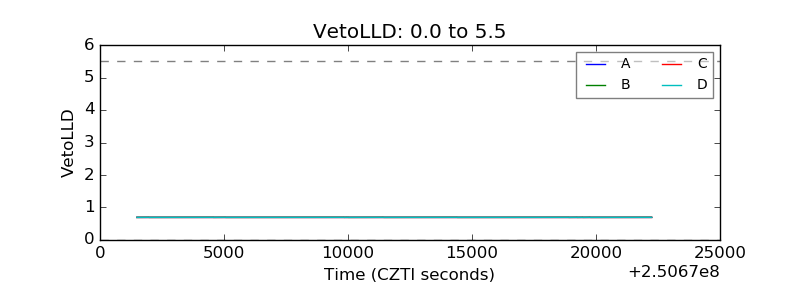 |
| Alpha Counter | 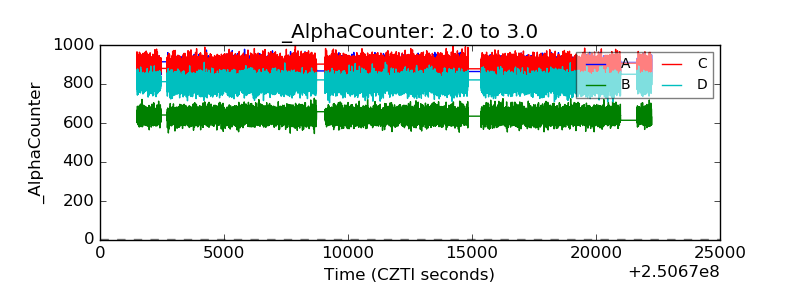 |
| _CPM_Rate | 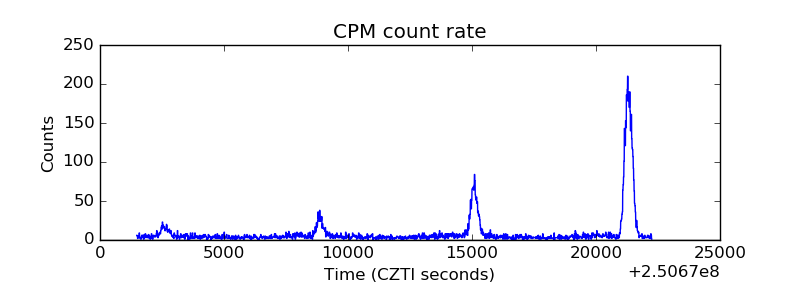 |
| CZT Counter | 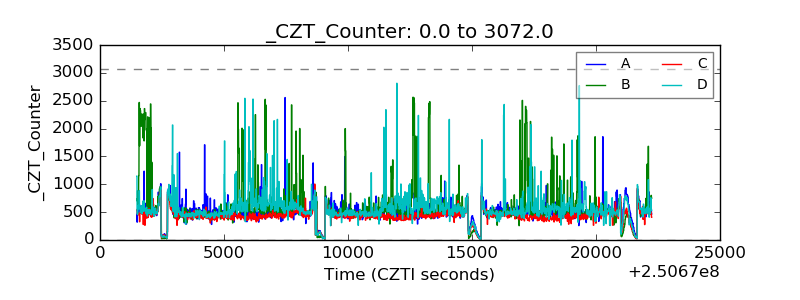 |
| +2.5 Volts monitor |  |
| +5 Volts monitor |  |
| _ROLL_ROT | 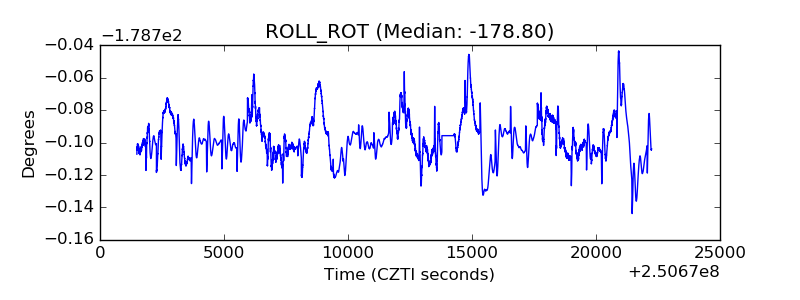 |
| _Roll_DEC | 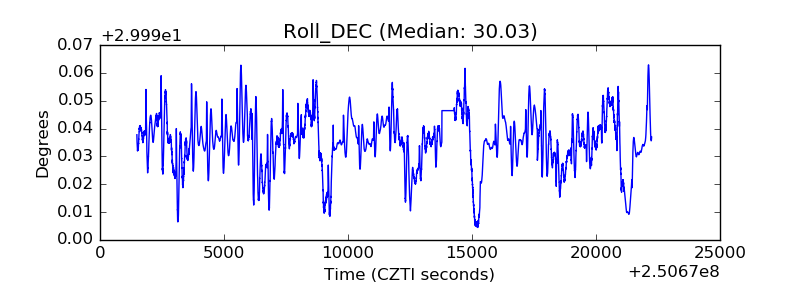 |
| _Roll_RA |  |
| Veto Counter | 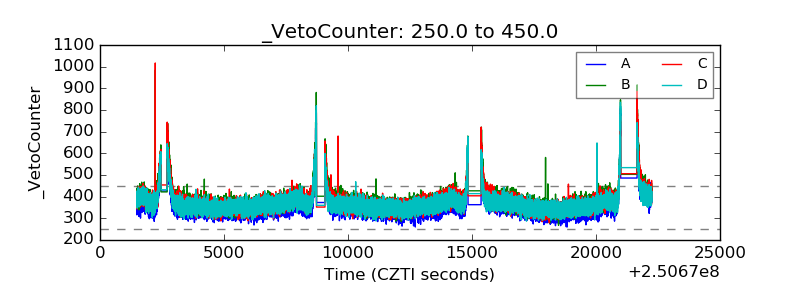 |