| Param | Original file | Final file |
|---|---|---|
| Filename | modeM0/AS1A04_088T05_9000001764_11924cztM0_level2.evt | modeM0/AS1A04_088T05_9000001764_11924cztM0_level2_quad_clean.evt |
| Size (bytes) | 501,281,280 | 94,230,720 |
| Size | 478.1 MB | 89.9 MB |
| Events in quadrant A | 3,753,120 | 612,047 |
| Events in quadrant B | 3,843,496 | 602,337 |
| Events in quadrant C | 3,002,436 | 610,303 |
| Events in quadrant D | 4,146,698 | 580,986 |
| Mode M9 | |||
|---|---|---|---|
| Quadrant | BADHDUFLAG | Total packets | Discarded packets |
| A | 0 | 11 | 0 |
| B | 0 | 11 | 0 |
| C | 0 | 11 | 0 |
| D | 0 | 11 | 0 |
| Mode M0 | |||
|---|---|---|---|
| Quadrant | BADHDUFLAG | Total packets | Discarded packets |
| A | 0 | 15463 | 2 |
| B | 0 | 15670 | 1 |
| C | 0 | 13270 | 1 |
| D | 0 | 16681 | 1 |
| Mode SS | |||
|---|---|---|---|
| Quadrant | BADHDUFLAG | Total packets | Discarded packets |
| A | 0 | 132 | 0 |
| B | 0 | 132 | 0 |
| C | 0 | 132 | 0 |
| D | 0 | 132 | 0 |
| Quadrant | Total seconds | Saturated seconds | Saturation percentage |
|---|---|---|---|
| A | 6413 | 84 | 1.309839% |
| B | 6413 | 199 | 3.103072% |
| C | 6413 | 39 | 0.608140% |
| D | 6413 | 241 | 3.757992% |
Noise dominated data is calculated using 1-second bins in cleaned event files. If a bin has >2000 counts, and if more than 50% of those come from <1% of pixels, then it is considered to be noise-dominated and hence unusable.
| Quadrant | # 1 sec bins | Bins with >0 counts | Bins with >2000 counts | High rate bins dominated by noise | Noise dominated (total time) | Noise dominated (detector-on time) | Marked lightcurve |
|---|---|---|---|---|---|---|---|
| A | 7569 | 6414 | 7 | 7 | 0.09% | 0.11% | 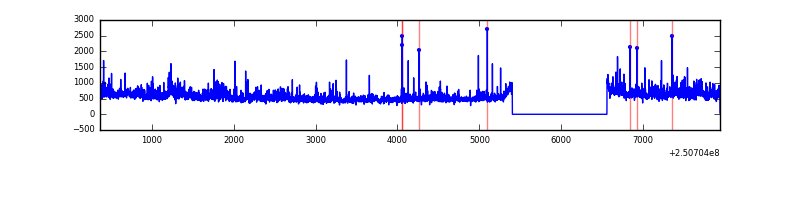 |
| B | 7569 | 6414 | 130 | 130 | 1.72% | 2.03% | 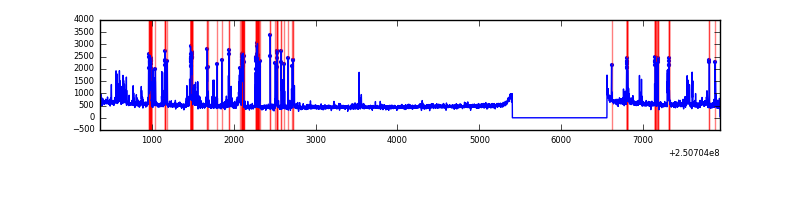 |
| C | 7569 | 6414 | 14 | 14 | 0.18% | 0.22% | 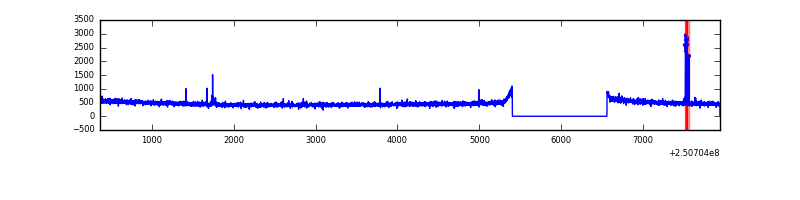 |
| D | 7569 | 6414 | 199 | 199 | 2.63% | 3.10% | 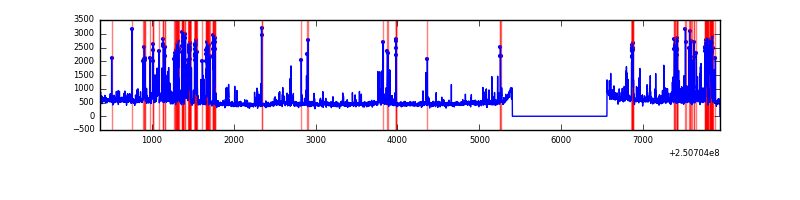 |
Top three noisy pixels from each quadrant. If the there are fewer than three noisy pixels in the level2.evt file, extra rows are filled as -1
| Pixel properties | Quadrant properties | ||||||
|---|---|---|---|---|---|---|---|
| Quadrant | DetID | PixID | Counts | Sigma | Mean | Median | Sigma |
| A | 8 | 15 | 353785 | 2249.52 | 782 | 765 | 156.9 |
| A | 1 | 162 | 131020 | 830.01 | 782 | 765 | 156.9 |
| A | 1 | 178 | 68546 | 431.92 | 782 | 765 | 156.9 |
| B | 4 | 239 | 623046 | 4227.68 | 772 | 752 | 147.2 |
| B | 15 | 204 | 83106 | 559.49 | 772 | 752 | 147.2 |
| B | 0 | 231 | 61825 | 414.91 | 772 | 752 | 147.2 |
| C | 0 | 207 | 47501 | 266.96 | 758 | 764 | 175.1 |
| C | 13 | 61 | 5689 | 28.13 | 758 | 764 | 175.1 |
| C | 3 | 202 | 1873 | 6.33 | 758 | 764 | 175.1 |
| D | 1 | 52 | 683274 | 3794.39 | 755 | 733 | 179.9 |
| D | 8 | 195 | 241889 | 1340.64 | 755 | 733 | 179.9 |
| D | 10 | 199 | 99213 | 547.47 | 755 | 733 | 179.9 |
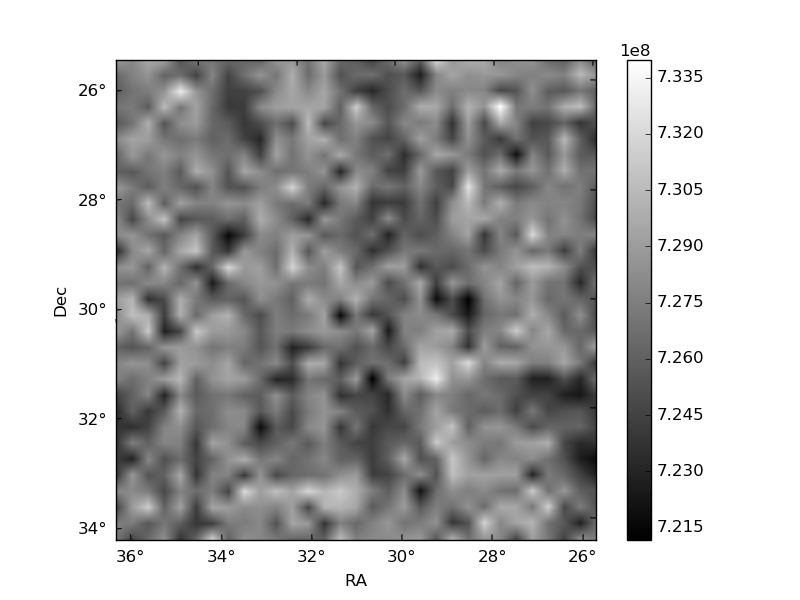
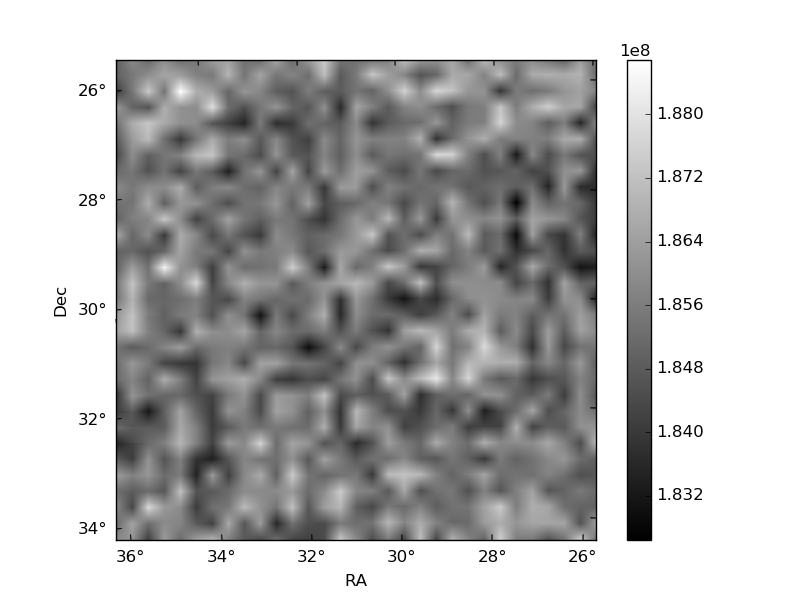
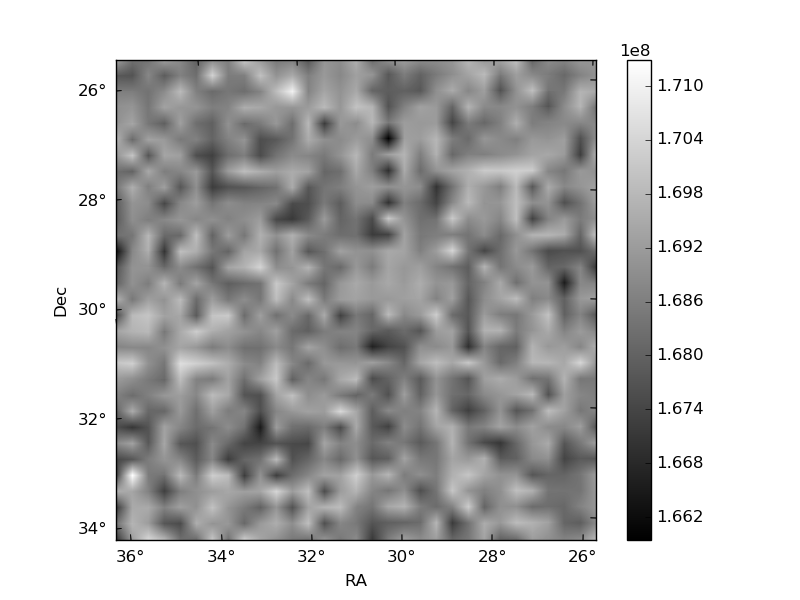
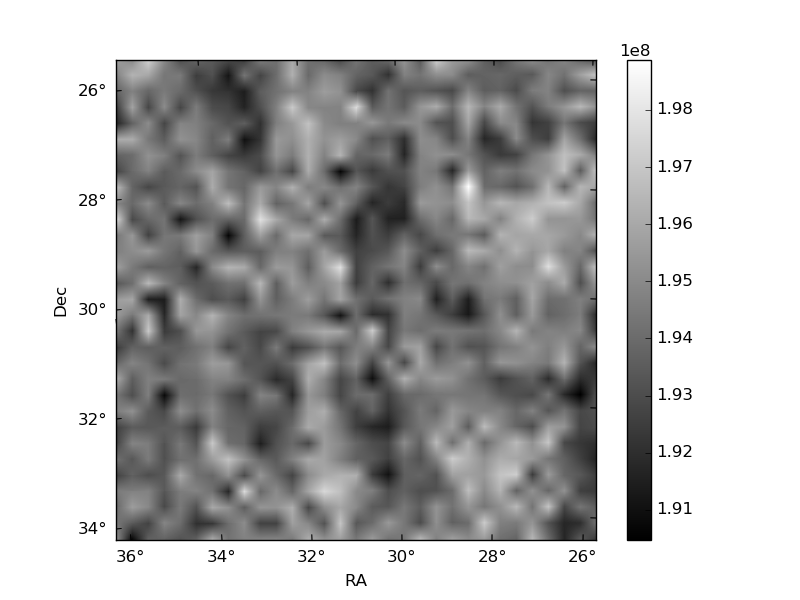
Histogram calculated using DETX and DETY for each event in the final _common_clean file
| Quadrant A | 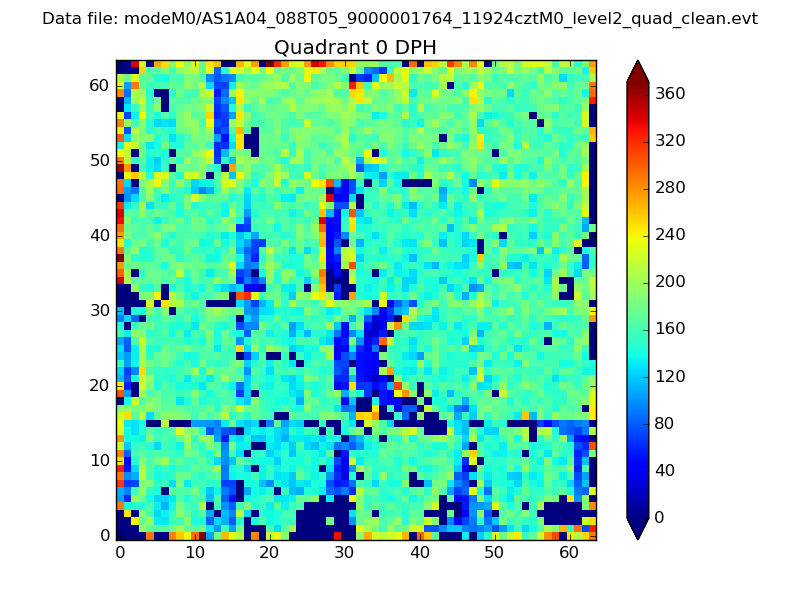 |
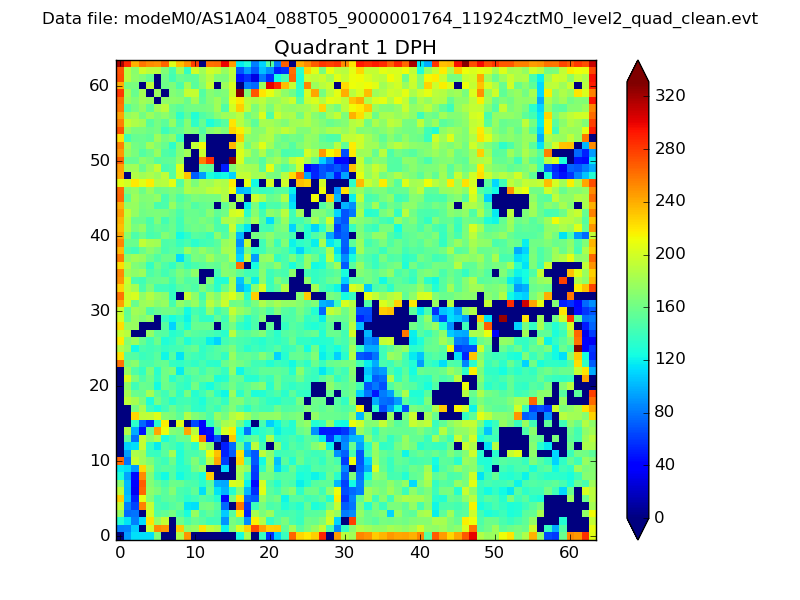 |
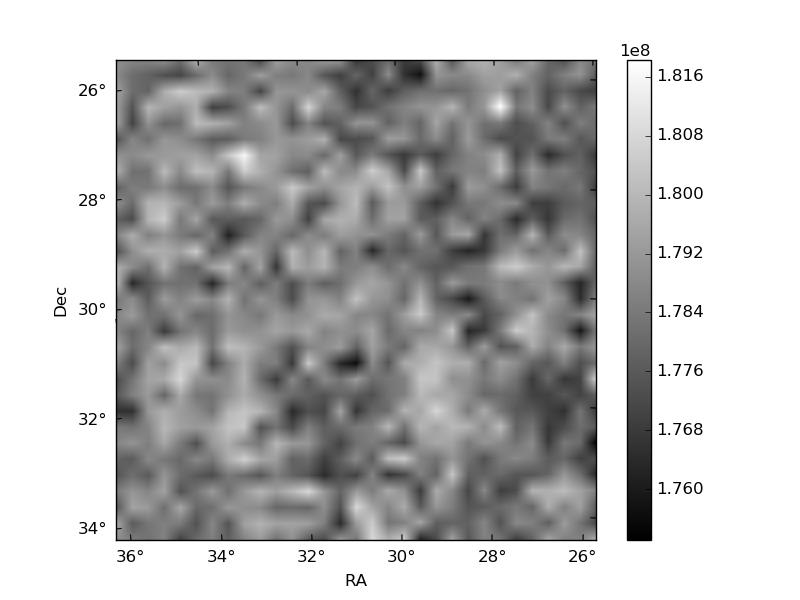
Quadrant B |
|---|---|---|---|
| Quadrant D | 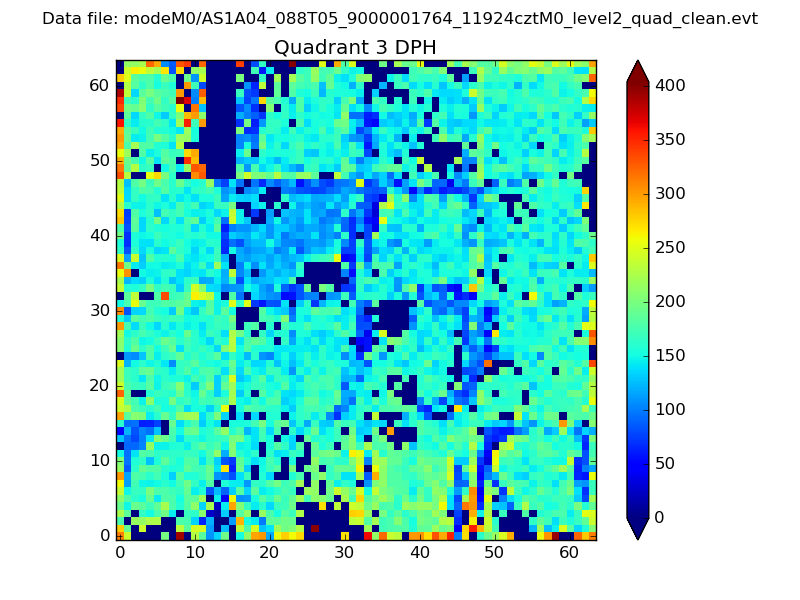 |
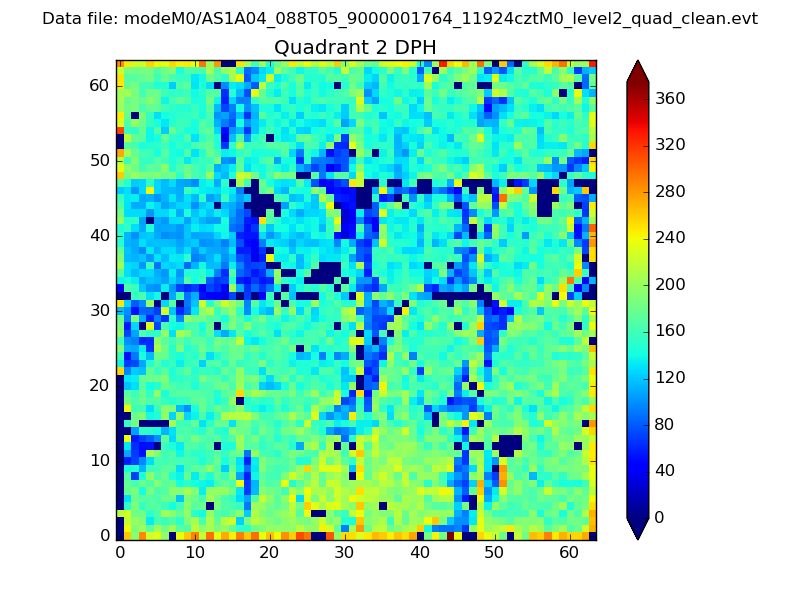 |
Quadrant C |
| Plot type | Count rate plots | Images |
|---|---|---|
| Comparison with Poisson distribution Blue bars denote a histogram of data divided into 1 sec bins. Red curve is a Poisson curve with rate = median count rate of data. |
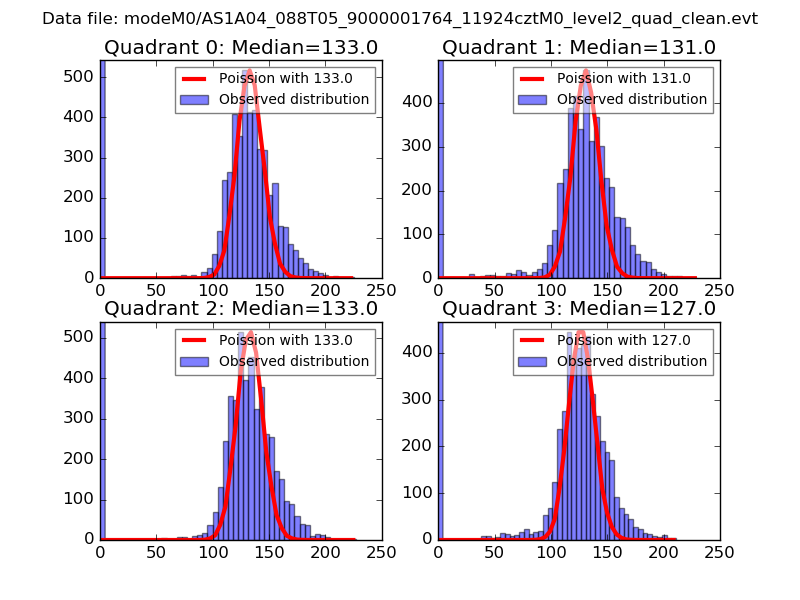 |
 |
| Quadrant-wise count rates Data is divided into 100 sec bins |
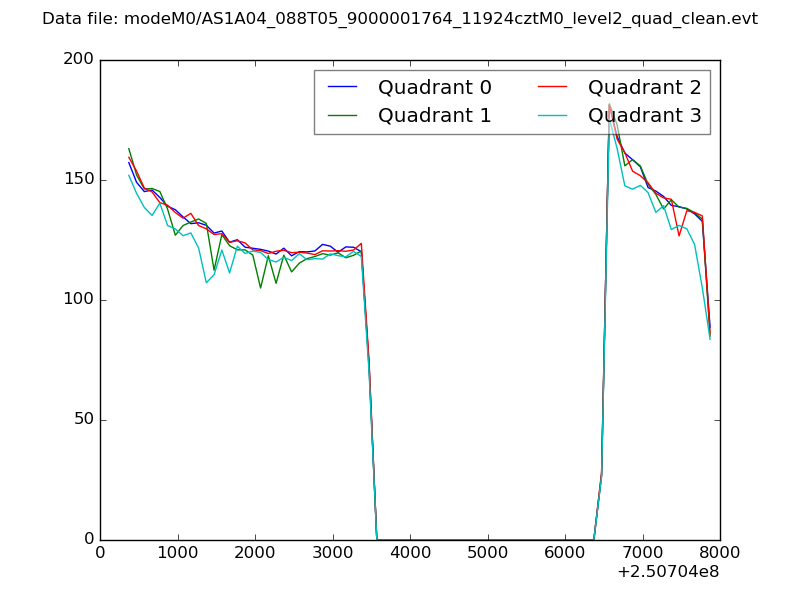 |
|
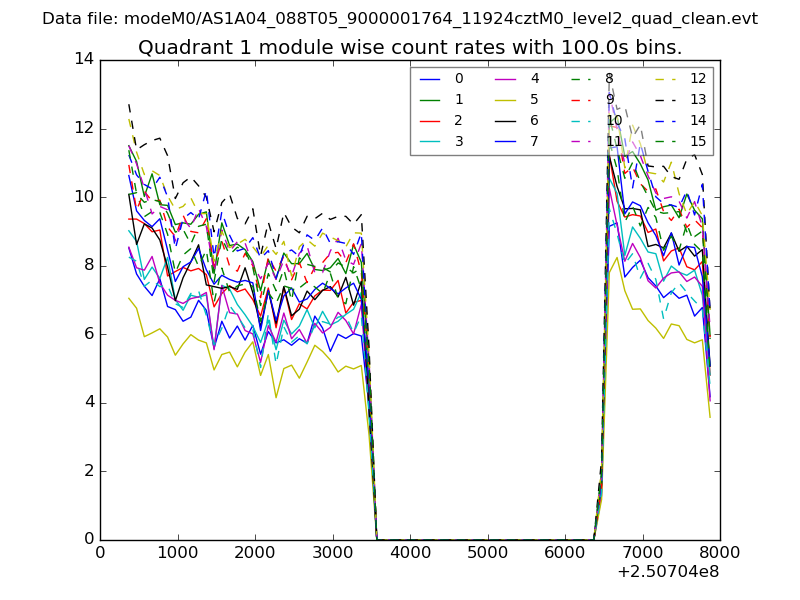
| Module-wise count rates for Quadrant A Data is divided into 100 sec bins |
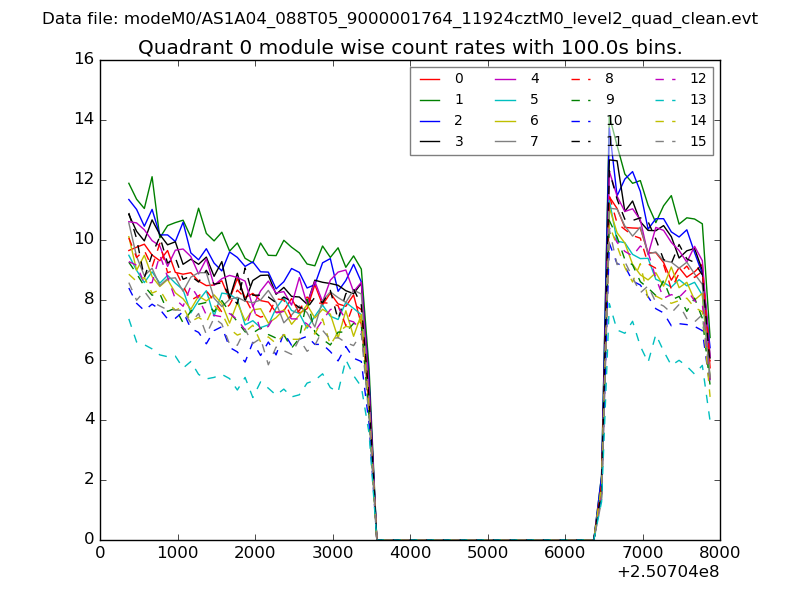 |
 |
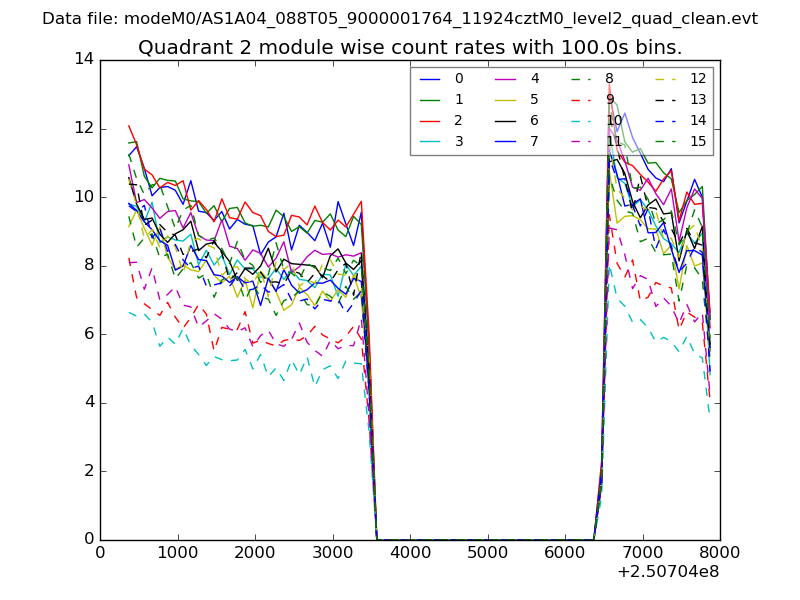
| Module-wise count rates for Quadrant B Data is divided into 100 sec bins |
 |
 |
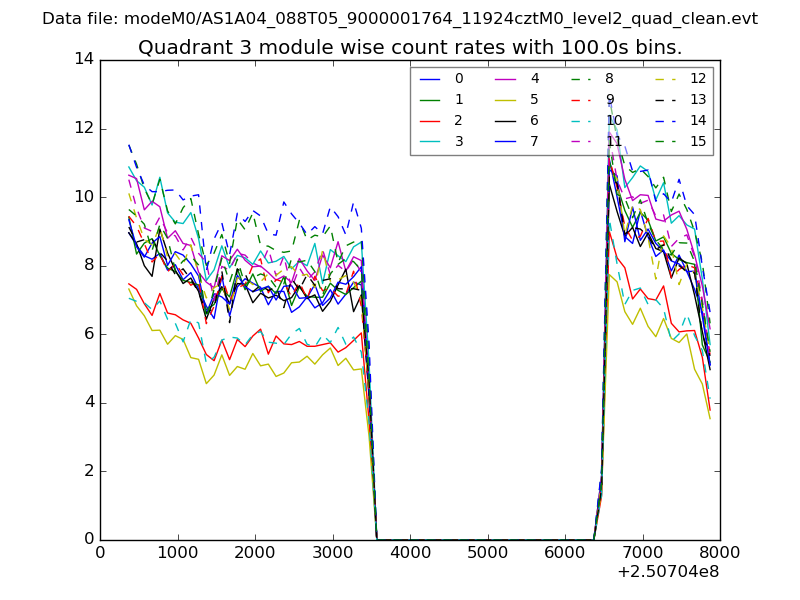
| Module-wise count rates for Quadrant C Data is divided into 100 sec bins |
 |
 |
| Module-wise count rates for Quadrant D Data is divided into 100 sec bins |
 |
 |
| Parameter | Plot |
|---|---|
| CZT HV Monitor | 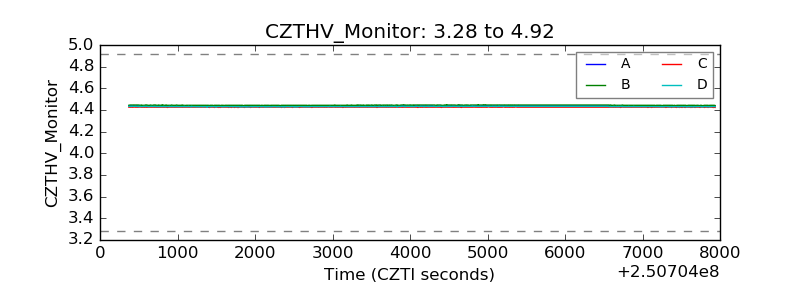 |
| D_VDD | 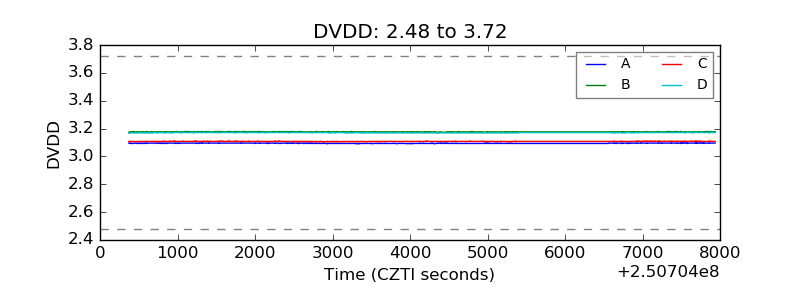 |
| Temperature 1 | 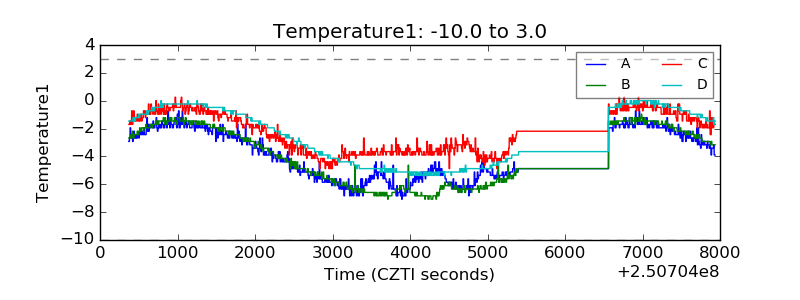 |
| Veto HV Monitor | 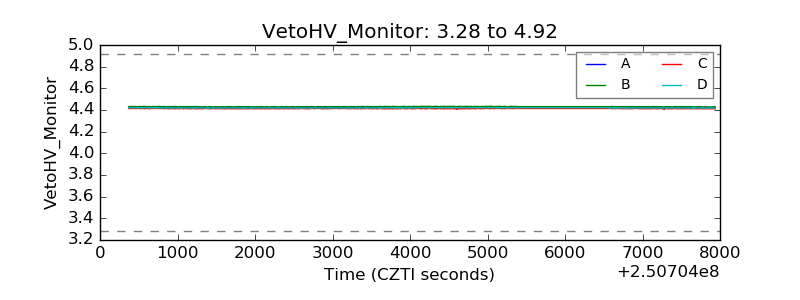 |
| Veto LLD | 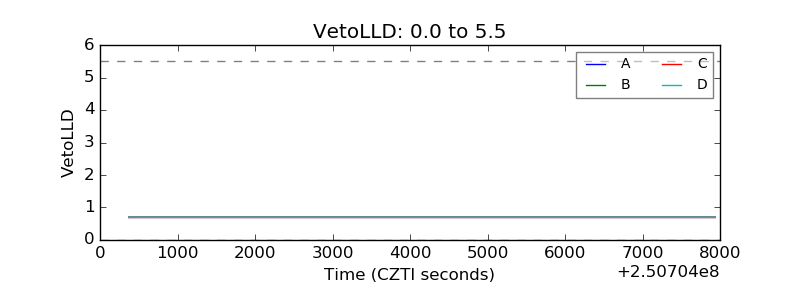 |
| Alpha Counter | 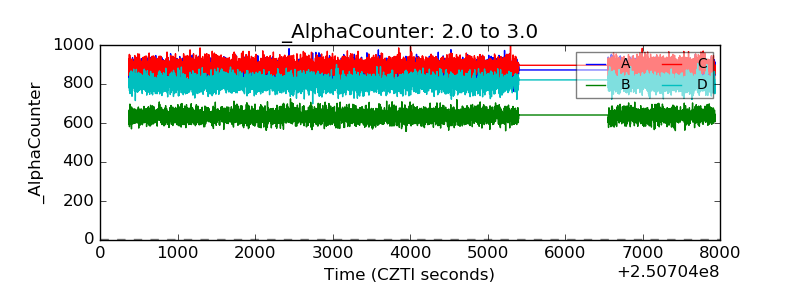 |
| _CPM_Rate | 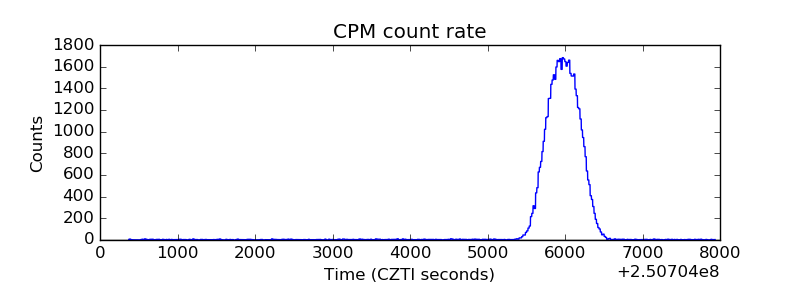 |
| CZT Counter | 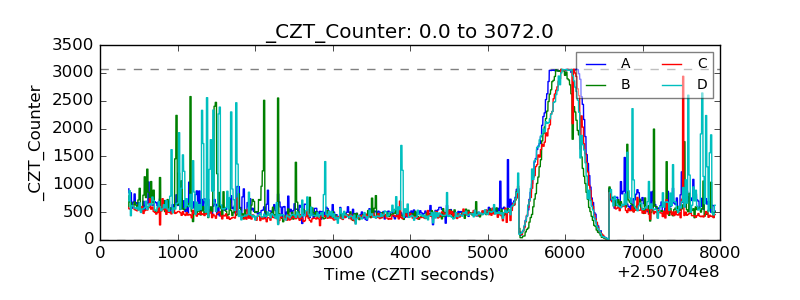 |
| +2.5 Volts monitor | 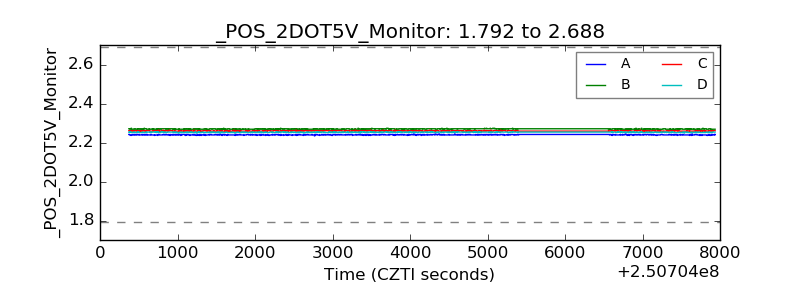 |
| +5 Volts monitor | 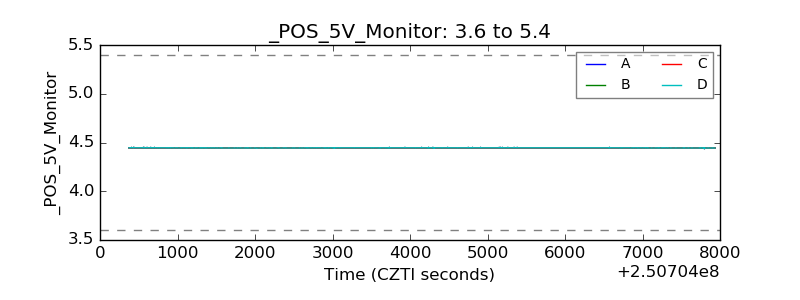 |
| _ROLL_ROT | 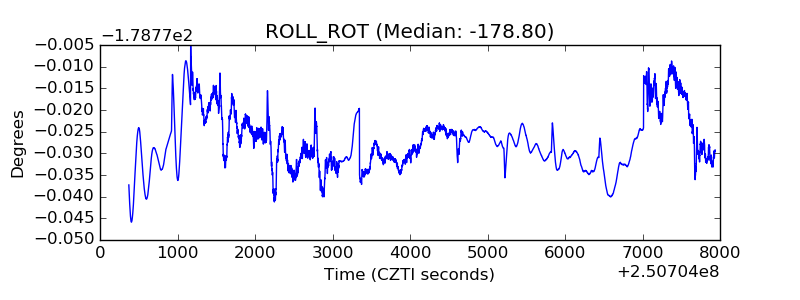 |
| _Roll_DEC | 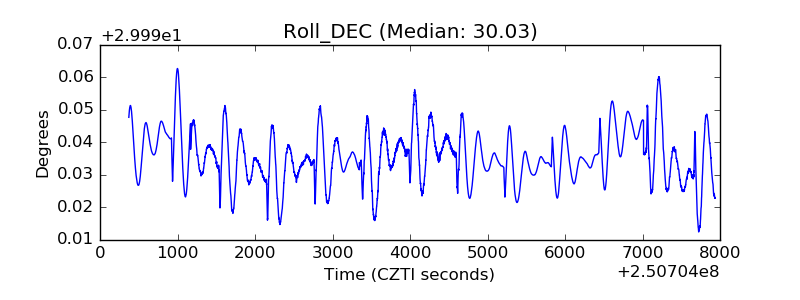 |
| _Roll_RA | 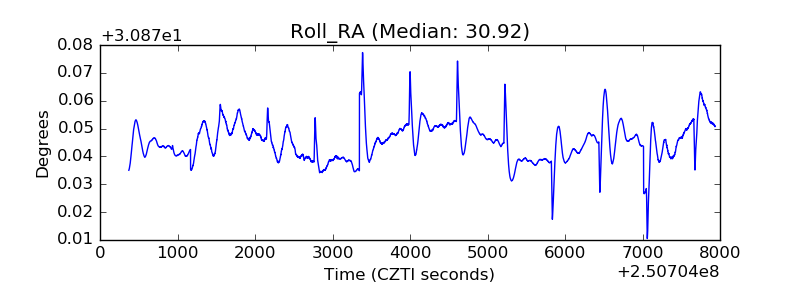 |
| Veto Counter | 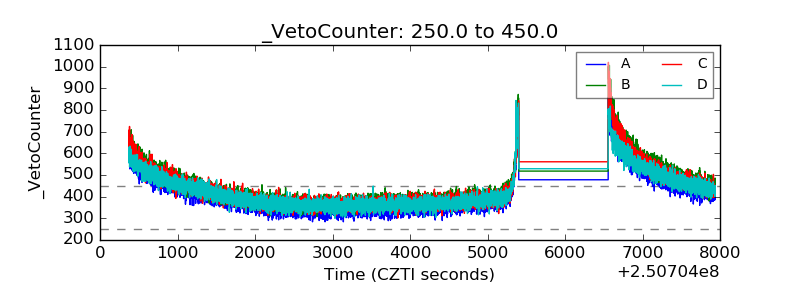 |