| Param | Original file | Final file |
|---|---|---|
| Filename | modeM0/AS1A04_088T05_9000001764_11925cztM0_level2.evt | modeM0/AS1A04_088T05_9000001764_11925cztM0_level2_quad_clean.evt |
| Size (bytes) | 503,000,640 | 93,355,200 |
| Size | 479.7 MB | 89.0 MB |
| Events in quadrant A | 3,771,507 | 604,470 |
| Events in quadrant B | 3,807,115 | 599,494 |
| Events in quadrant C | 3,098,071 | 603,619 |
| Events in quadrant D | 4,122,407 | 572,795 |
| Mode M9 | |||
|---|---|---|---|
| Quadrant | BADHDUFLAG | Total packets | Discarded packets |
| A | 0 | 18 | 0 |
| B | 0 | 18 | 0 |
| C | 0 | 18 | 0 |
| D | 0 | 19 | 0 |
| Mode M0 | |||
|---|---|---|---|
| Quadrant | BADHDUFLAG | Total packets | Discarded packets |
| A | 0 | 15433 | 3 |
| B | 0 | 15491 | 2 |
| C | 0 | 13457 | 2 |
| D | 0 | 16377 | 2 |
| Mode SS | |||
|---|---|---|---|
| Quadrant | BADHDUFLAG | Total packets | Discarded packets |
| A | 0 | 128 | 0 |
| B | 0 | 128 | 0 |
| C | 0 | 128 | 0 |
| D | 0 | 128 | 0 |
| Quadrant | Total seconds | Saturated seconds | Saturation percentage |
|---|---|---|---|
| A | 6407 | 117 | 1.826128% |
| B | 6407 | 211 | 3.293273% |
| C | 6407 | 66 | 1.030123% |
| D | 6407 | 215 | 3.355705% |
Noise dominated data is calculated using 1-second bins in cleaned event files. If a bin has >2000 counts, and if more than 50% of those come from <1% of pixels, then it is considered to be noise-dominated and hence unusable.
| Quadrant | # 1 sec bins | Bins with >0 counts | Bins with >2000 counts | High rate bins dominated by noise | Noise dominated (total time) | Noise dominated (detector-on time) | Marked lightcurve |
|---|---|---|---|---|---|---|---|
| A | 7618 | 6408 | 4 | 4 | 0.05% | 0.06% | 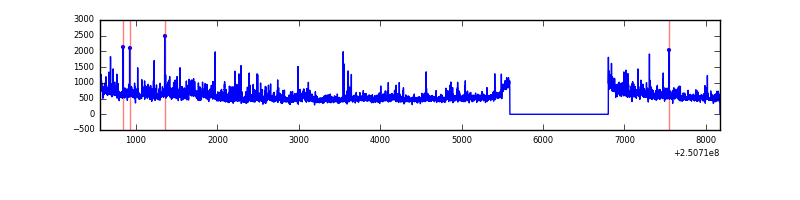 |
| B | 7618 | 6408 | 85 | 85 | 1.12% | 1.33% | 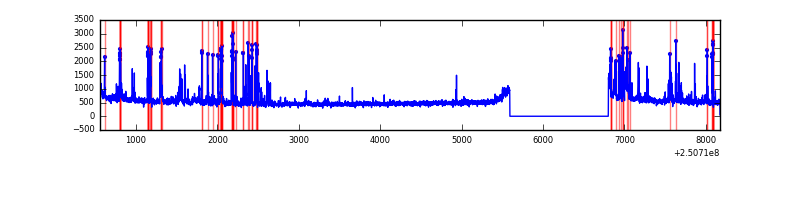 |
| C | 7618 | 6408 | 14 | 14 | 0.18% | 0.22% | 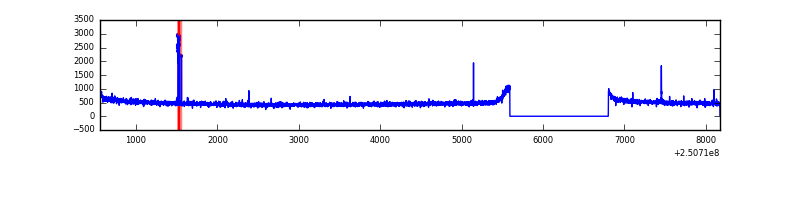 |
| D | 7618 | 6408 | 163 | 163 | 2.14% | 2.54% | 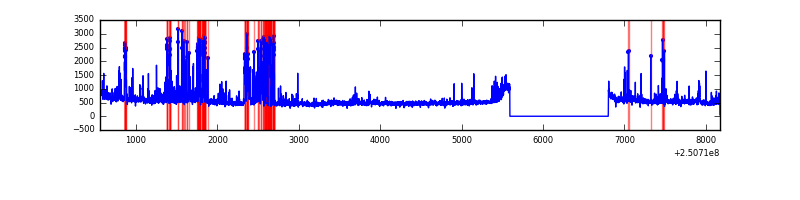 |
Top three noisy pixels from each quadrant. If the there are fewer than three noisy pixels in the level2.evt file, extra rows are filled as -1
| Pixel properties | Quadrant properties | ||||||
|---|---|---|---|---|---|---|---|
| Quadrant | DetID | PixID | Counts | Sigma | Mean | Median | Sigma |
| A | 8 | 15 | 225360 | 1383.12 | 803 | 785 | 162.4 |
| A | 1 | 162 | 161345 | 988.86 | 803 | 785 | 162.4 |
| A | 1 | 178 | 90366 | 551.71 | 803 | 785 | 162.4 |
| B | 4 | 239 | 461399 | 3080.49 | 796 | 778 | 149.5 |
| B | 0 | 85 | 64246 | 424.45 | 796 | 778 | 149.5 |
| B | 15 | 204 | 55971 | 369.11 | 796 | 778 | 149.5 |
| C | 0 | 207 | 47817 | 262.9 | 781 | 787 | 178.9 |
| C | 13 | 61 | 5955 | 28.89 | 781 | 787 | 178.9 |
| C | 14 | 234 | 3618 | 15.83 | 781 | 787 | 178.9 |
| D | 1 | 52 | 673981 | 3651.49 | 777 | 757 | 184.4 |
| D | 8 | 195 | 264297 | 1429.41 | 777 | 757 | 184.4 |
| D | 5 | 222 | 78216 | 420.13 | 777 | 757 | 184.4 |
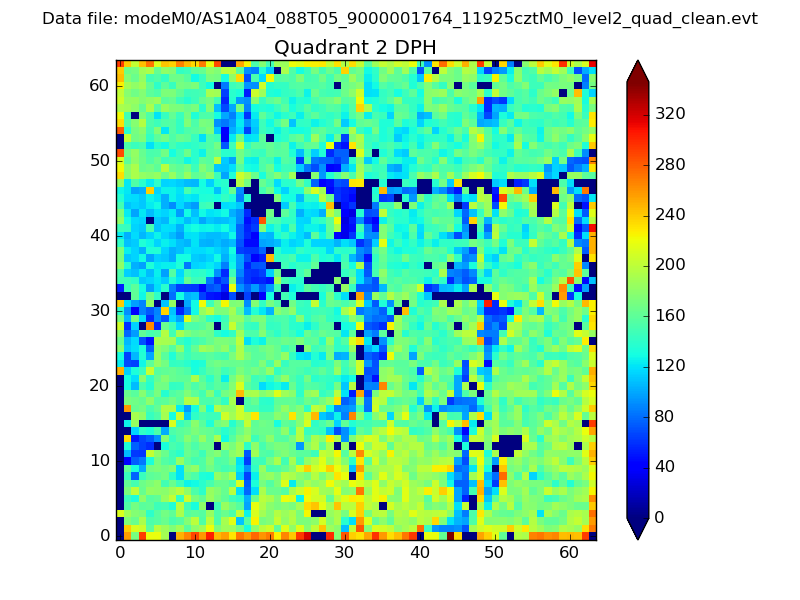
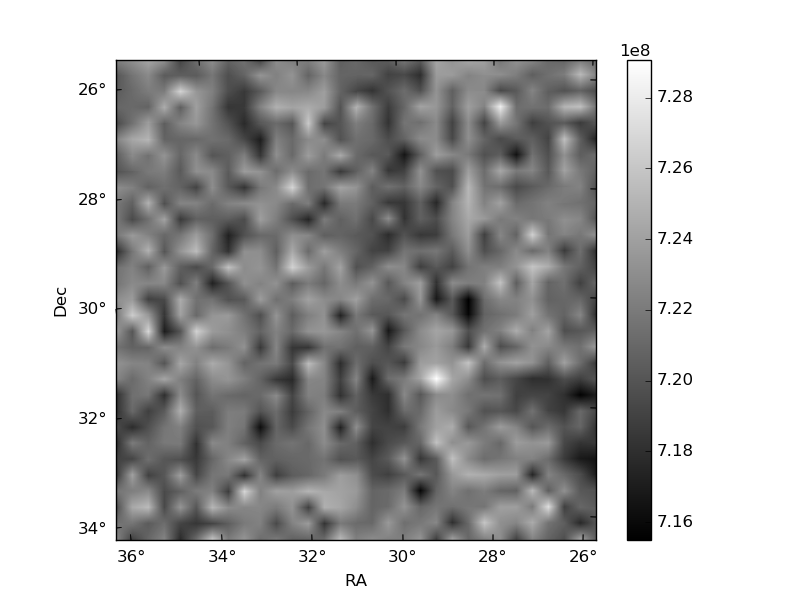
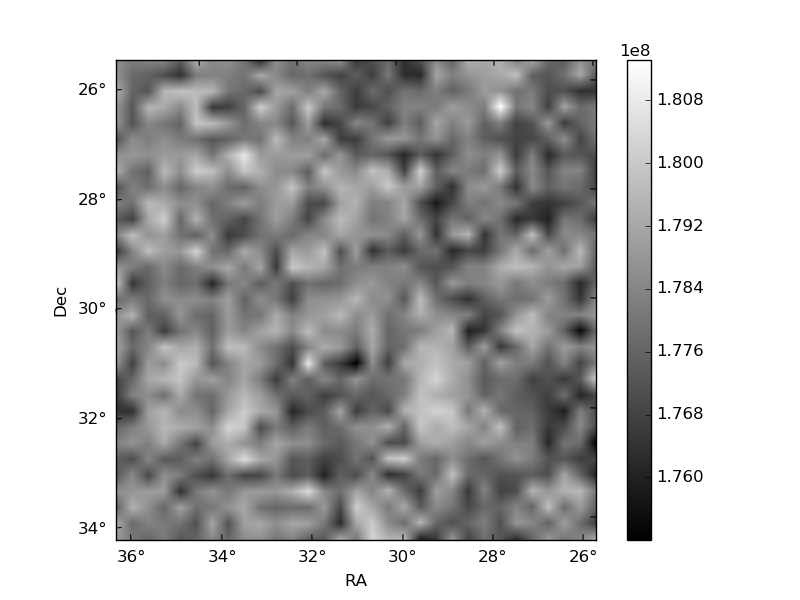
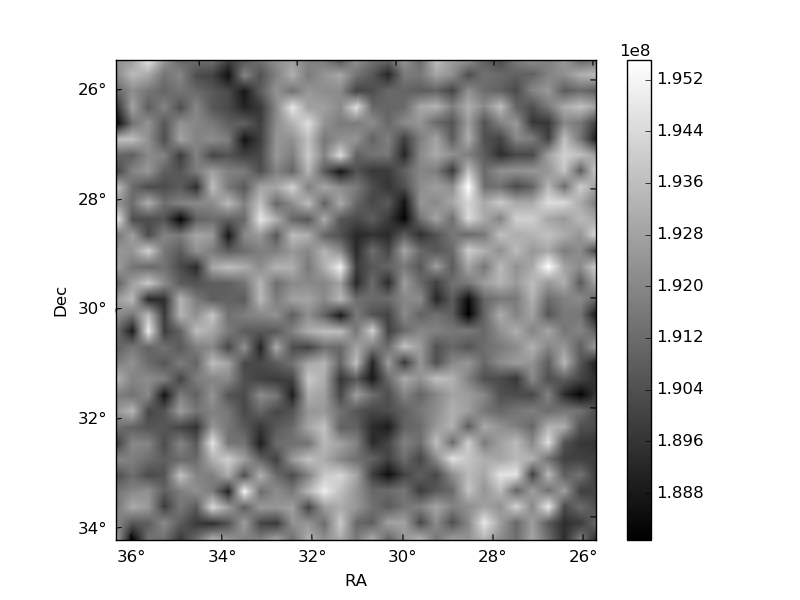
Histogram calculated using DETX and DETY for each event in the final _common_clean file
| Quadrant A | 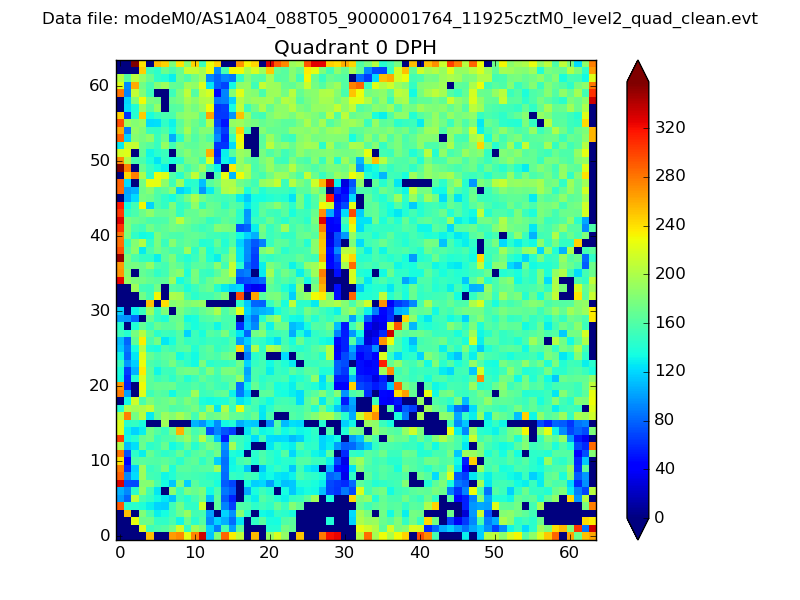 |
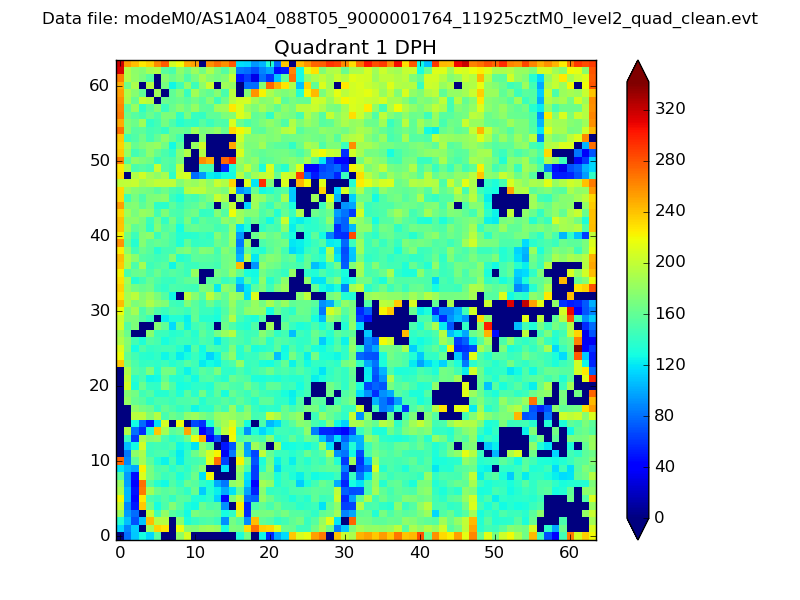 |
Quadrant B |
|---|---|---|---|
| Quadrant D | 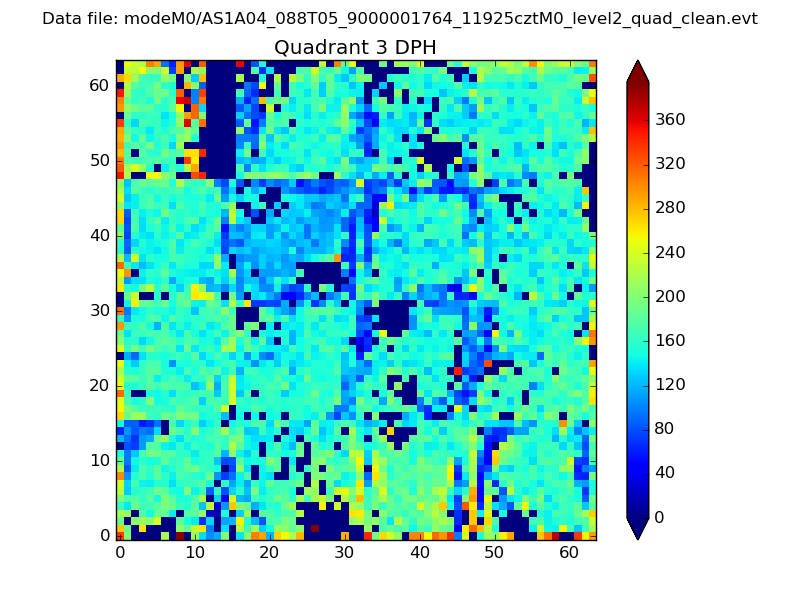 |
 |
Quadrant C |
| Plot type | Count rate plots | Images |
|---|---|---|
| Comparison with Poisson distribution Blue bars denote a histogram of data divided into 1 sec bins. Red curve is a Poisson curve with rate = median count rate of data. |
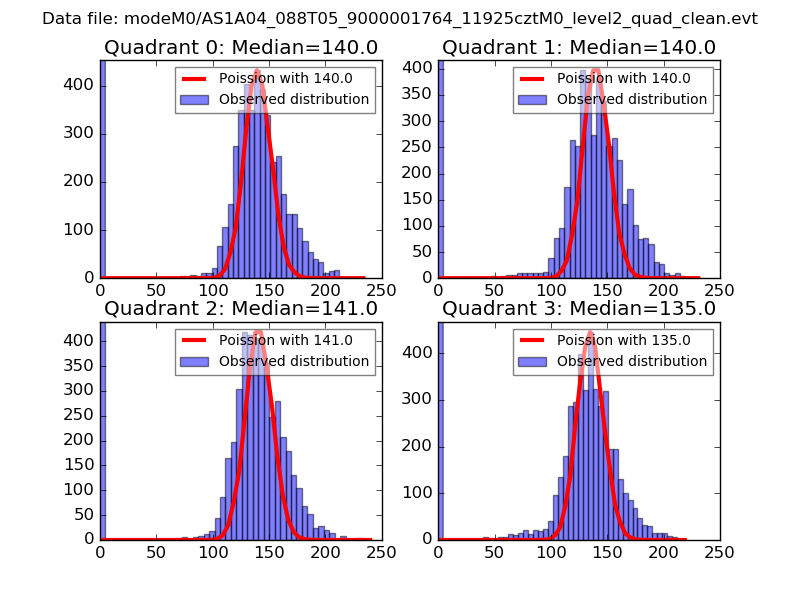 |
 |
| Quadrant-wise count rates Data is divided into 100 sec bins |
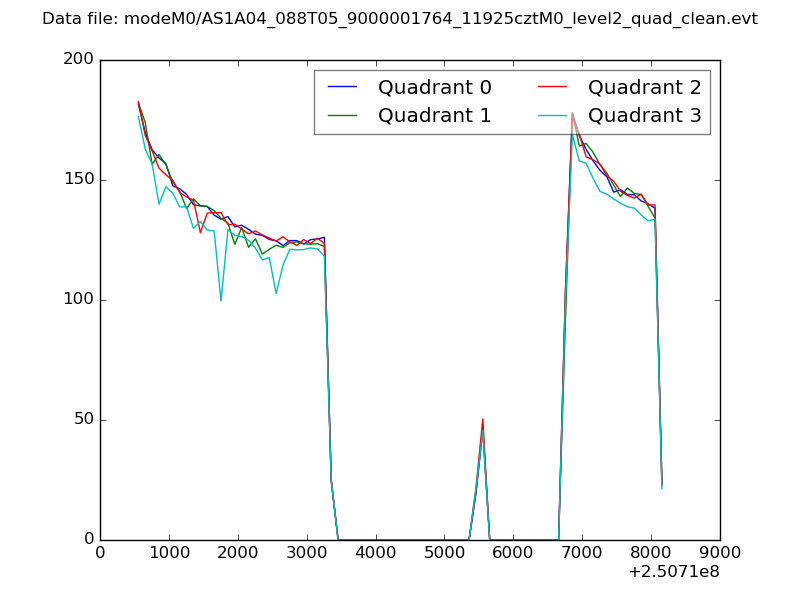 |
|
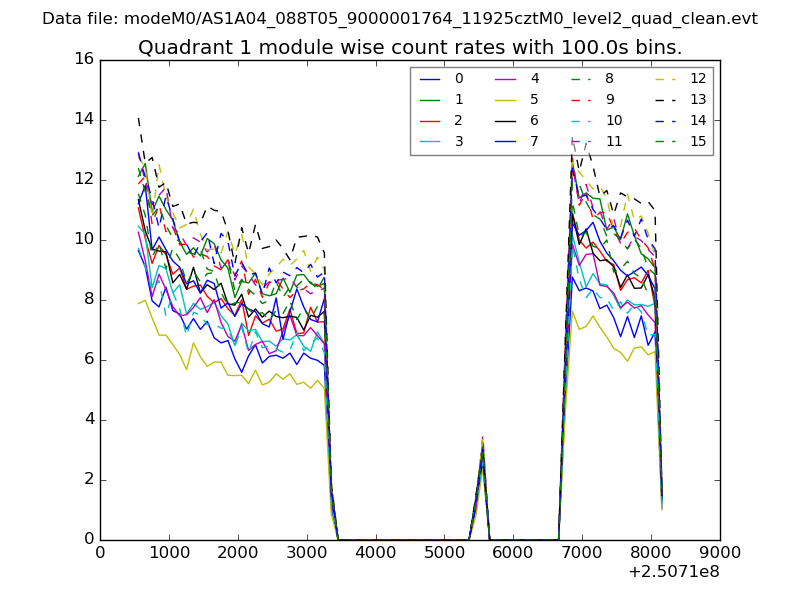
| Module-wise count rates for Quadrant A Data is divided into 100 sec bins |
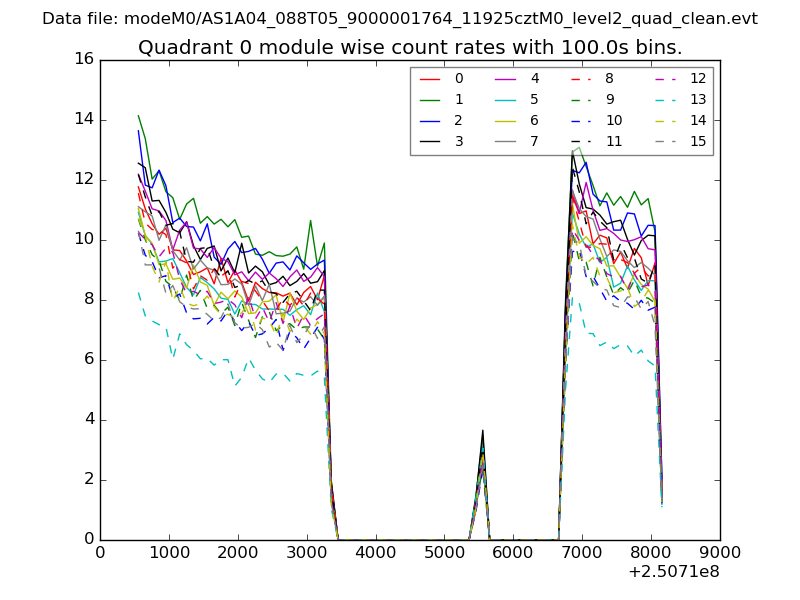 |
 |
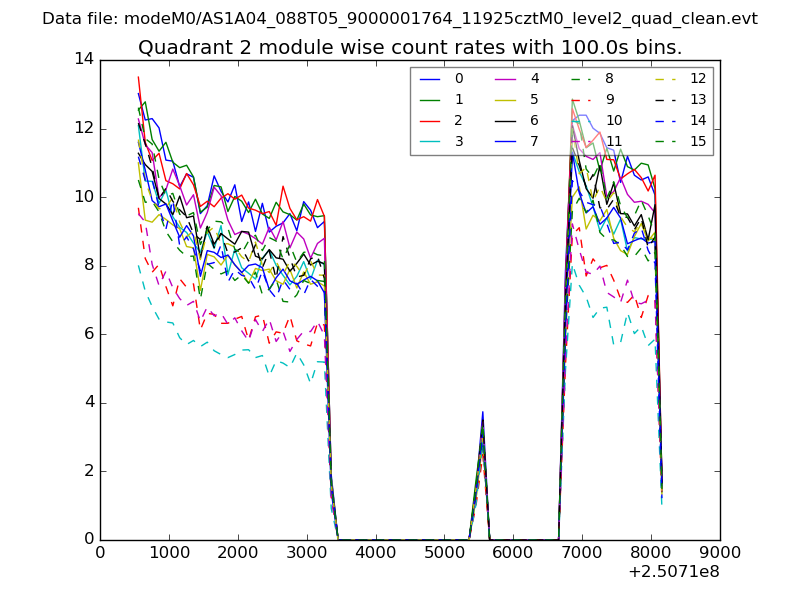
| Module-wise count rates for Quadrant B Data is divided into 100 sec bins |
 |
 |
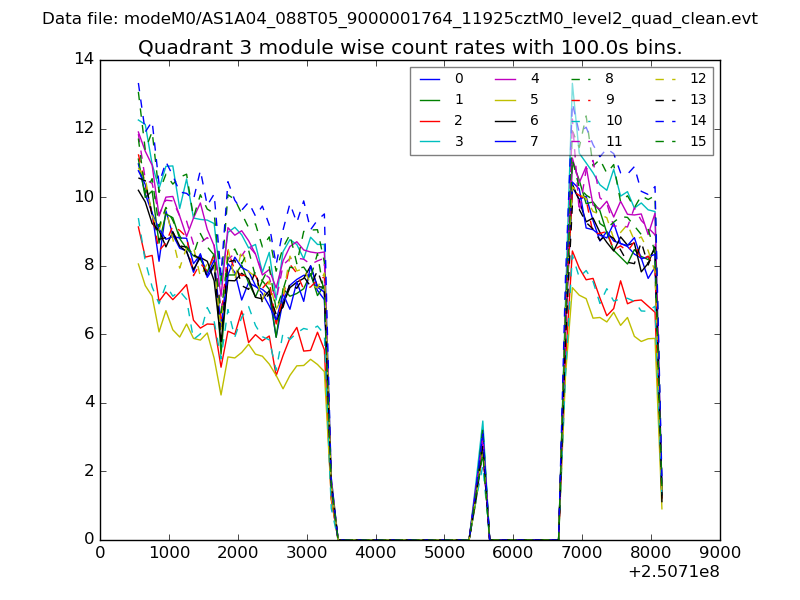
| Module-wise count rates for Quadrant C Data is divided into 100 sec bins |
 |
 |
| Module-wise count rates for Quadrant D Data is divided into 100 sec bins |
 |
 |
| Parameter | Plot |
|---|---|
| CZT HV Monitor |  |
| D_VDD | 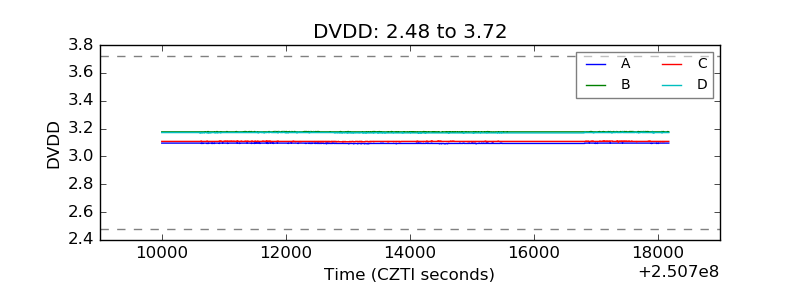 |
| Temperature 1 | 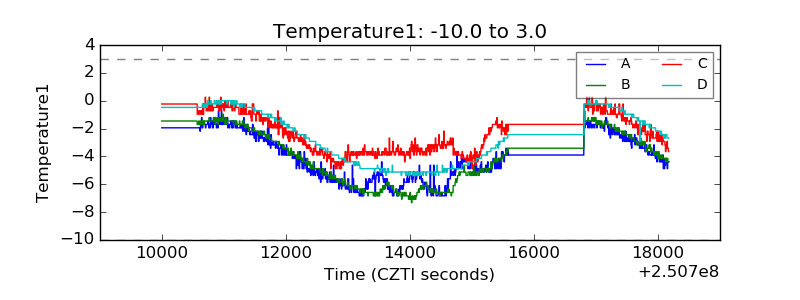 |
| Veto HV Monitor | 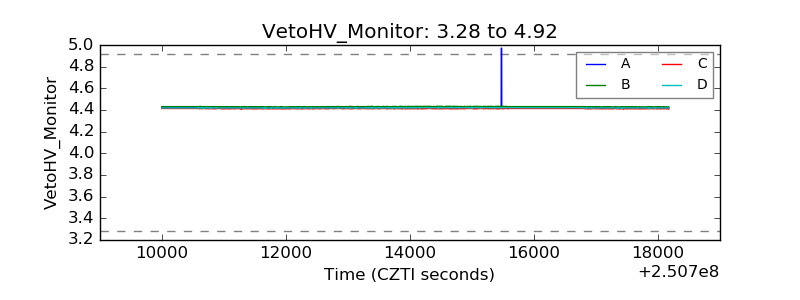 |
| Veto LLD | 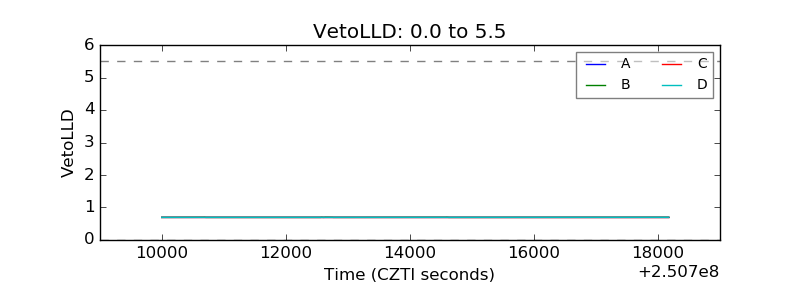 |
| Alpha Counter | 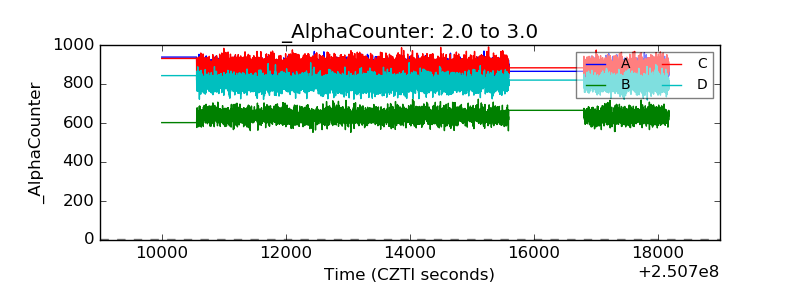 |
| _CPM_Rate | 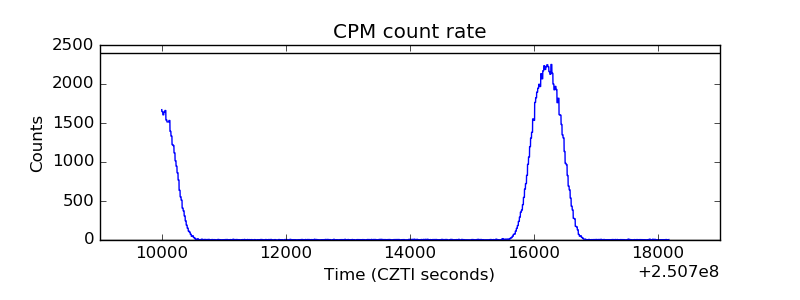 |
| CZT Counter | 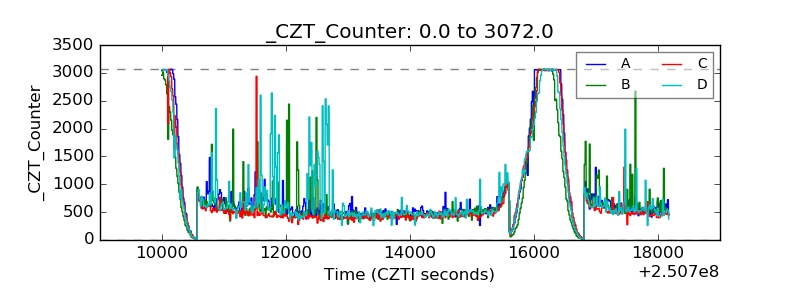 |
| +2.5 Volts monitor |  |
| +5 Volts monitor |  |
| _ROLL_ROT | 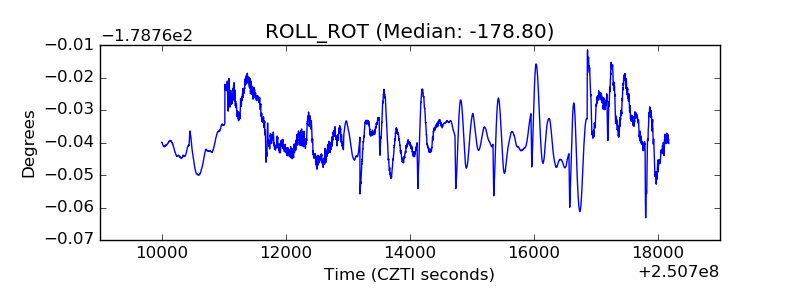 |
| _Roll_DEC | 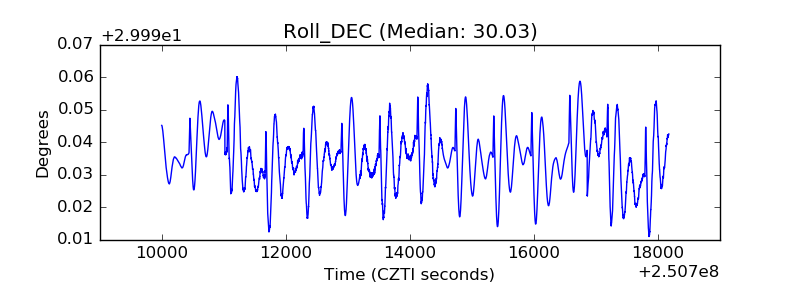 |
| _Roll_RA | 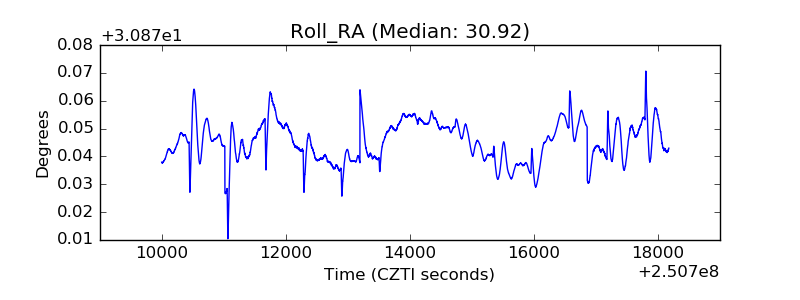 |
| Veto Counter | 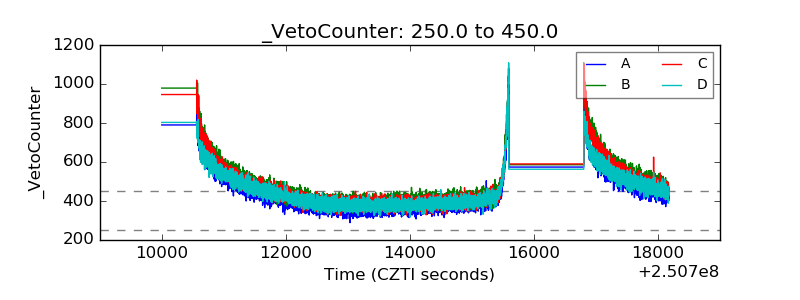 |