| Param | Original file | Final file |
|---|---|---|
| Filename | modeM0/AS1A04_088T05_9000001764_11927cztM0_level2.evt | modeM0/AS1A04_088T05_9000001764_11927cztM0_level2_quad_clean.evt |
| Size (bytes) | 63,529,920 | 17,686,080 |
| Size | 60.6 MB | 16.9 MB |
| Events in quadrant A | 476,527 | 118,821 |
| Events in quadrant B | 461,948 | 121,573 |
| Events in quadrant C | 401,113 | 119,678 |
| Events in quadrant D | 528,932 | 113,887 |
| Mode M9 | |||
|---|---|---|---|
| Quadrant | BADHDUFLAG | Total packets | Discarded packets |
| A | 0 | 8 | 0 |
| B | 0 | 8 | 0 |
| C | 0 | 8 | 0 |
| D | 0 | 9 | 0 |
| Mode M0 | |||
|---|---|---|---|
| Quadrant | BADHDUFLAG | Total packets | Discarded packets |
| A | 0 | 1933 | 1 |
| B | 0 | 1840 | 1 |
| C | 0 | 1628 | 1 |
| D | 0 | 2088 | 1 |
| Mode SS | |||
|---|---|---|---|
| Quadrant | BADHDUFLAG | Total packets | Discarded packets |
| A | 0 | 16 | 0 |
| B | 0 | 16 | 0 |
| C | 0 | 16 | 0 |
| D | 0 | 16 | 0 |
| Quadrant | Total seconds | Saturated seconds | Saturation percentage |
|---|---|---|---|
| A | 765 | 7 | 0.915033% |
| B | 765 | 3 | 0.392157% |
| C | 765 | 1 | 0.130719% |
| D | 765 | 5 | 0.653595% |
Noise dominated data is calculated using 1-second bins in cleaned event files. If a bin has >2000 counts, and if more than 50% of those come from <1% of pixels, then it is considered to be noise-dominated and hence unusable.
| Quadrant | # 1 sec bins | Bins with >0 counts | Bins with >2000 counts | High rate bins dominated by noise | Noise dominated (total time) | Noise dominated (detector-on time) | Marked lightcurve |
|---|---|---|---|---|---|---|---|
| A | 766 | 766 | 2 | 2 | 0.26% | 0.26% | 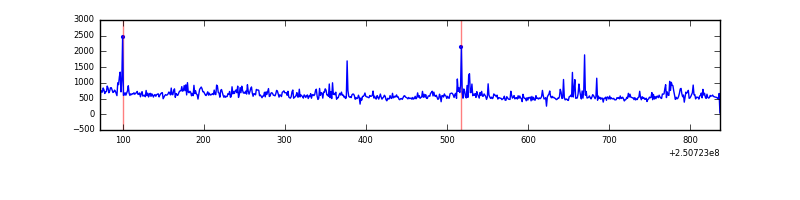 |
| B | 766 | 766 | 2 | 2 | 0.26% | 0.26% | 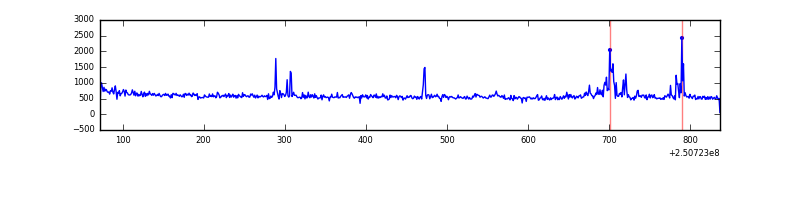 |
| C | 766 | 766 | 0 | 0 | 0.00% | 0.00% |  |
| D | 766 | 766 | 3 | 3 | 0.39% | 0.39% | 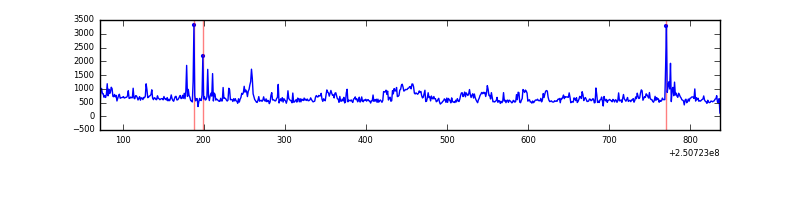 |
Top three noisy pixels from each quadrant. If the there are fewer than three noisy pixels in the level2.evt file, extra rows are filled as -1
| Pixel properties | Quadrant properties | ||||||
|---|---|---|---|---|---|---|---|
| Quadrant | DetID | PixID | Counts | Sigma | Mean | Median | Sigma |
| A | 1 | 162 | 24641 | 1081.69 | 104 | 102 | 22.7 |
| A | 1 | 178 | 13448 | 588.3 | 104 | 102 | 22.7 |
| A | 1 | 161 | 11832 | 517.06 | 104 | 102 | 22.7 |
| B | 4 | 239 | 13124 | 605.57 | 104 | 102 | 21.5 |
| B | 4 | 80 | 13033 | 601.33 | 104 | 102 | 21.5 |
| B | 15 | 204 | 12661 | 584.04 | 104 | 102 | 21.5 |
| C | 0 | 207 | 2936 | 113.31 | 101 | 102 | 25.0 |
| C | 13 | 61 | 752 | 25.99 | 101 | 102 | 25.0 |
| C | 14 | 234 | 636 | 21.35 | 101 | 102 | 25.0 |
| D | 1 | 52 | 38497 | 1472.86 | 102 | 99 | 26.1 |
| D | 8 | 195 | 35843 | 1371.06 | 102 | 99 | 26.1 |
| D | 12 | 6 | 19507 | 744.44 | 102 | 99 | 26.1 |
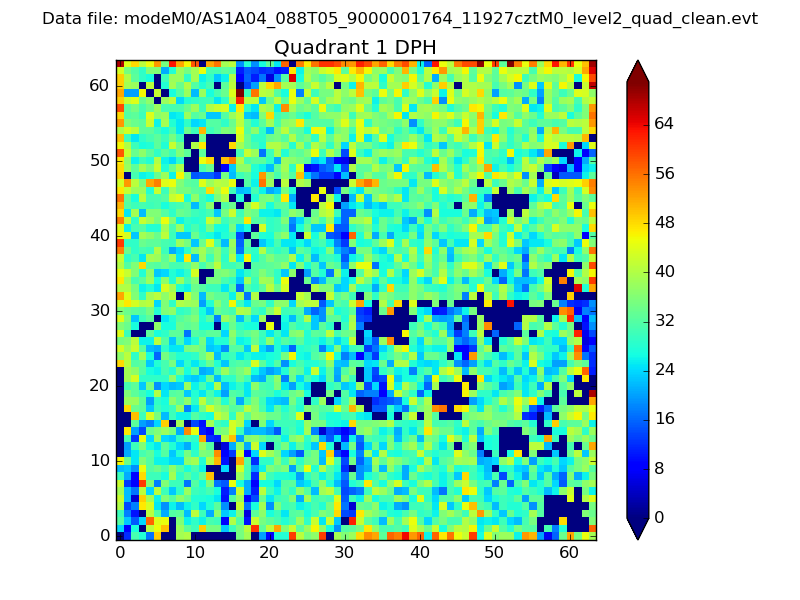
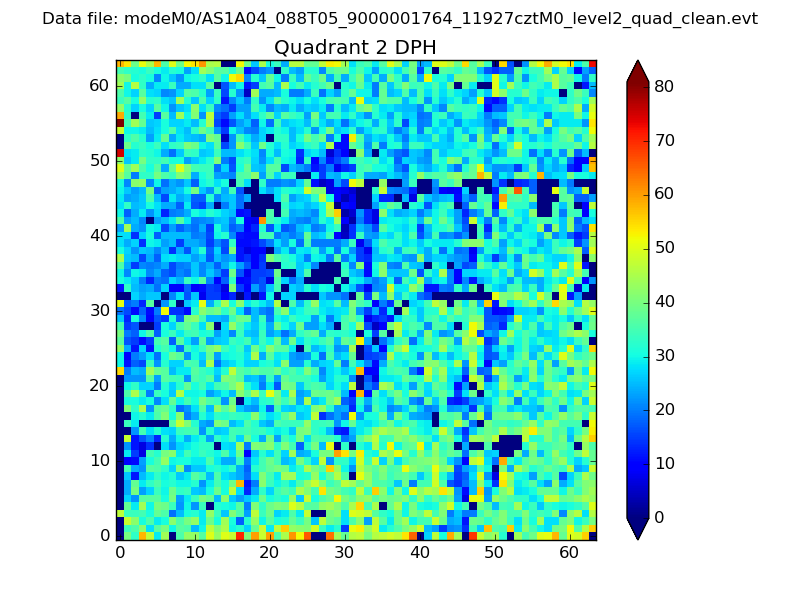
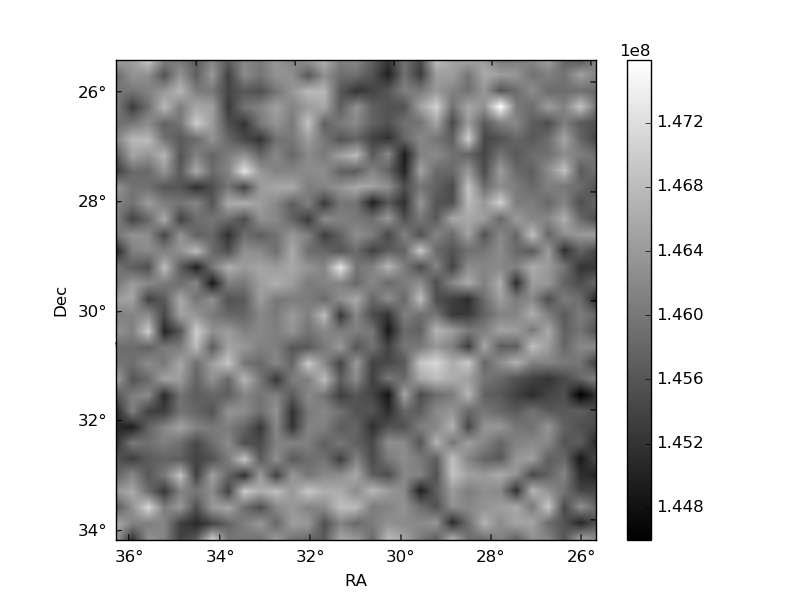
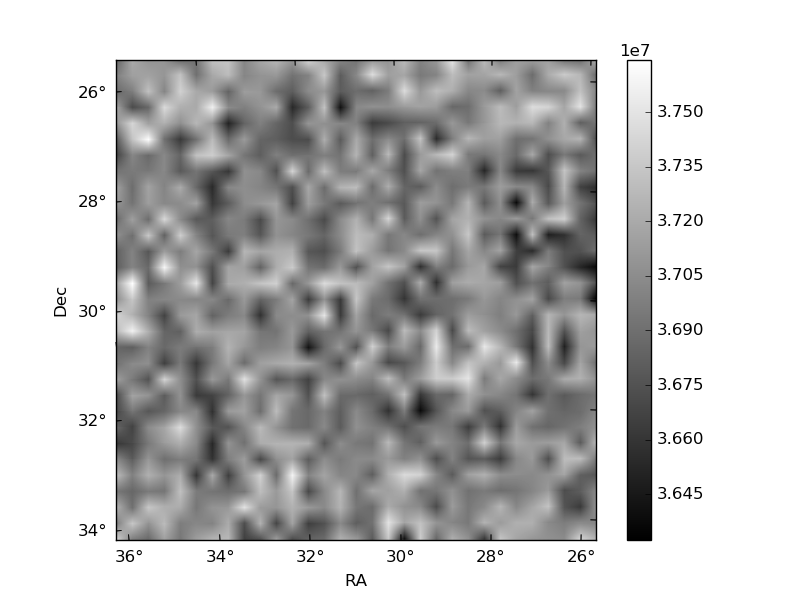
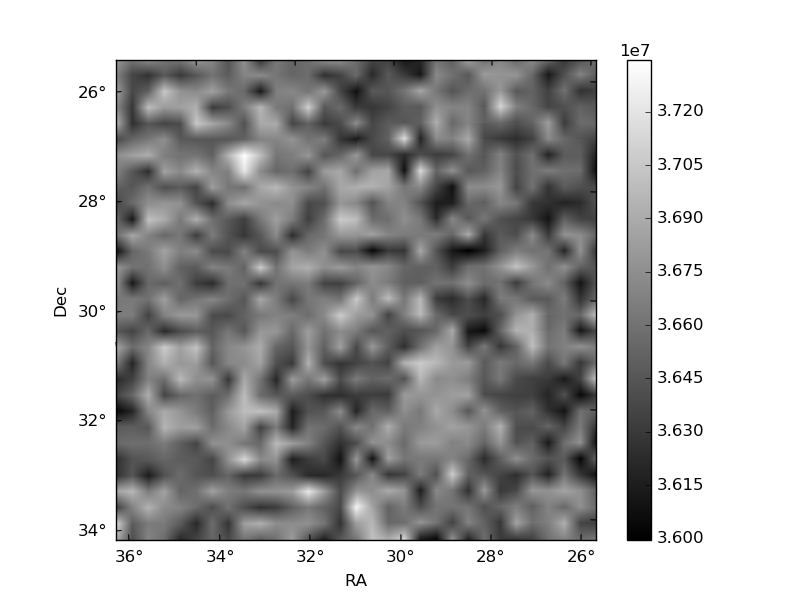
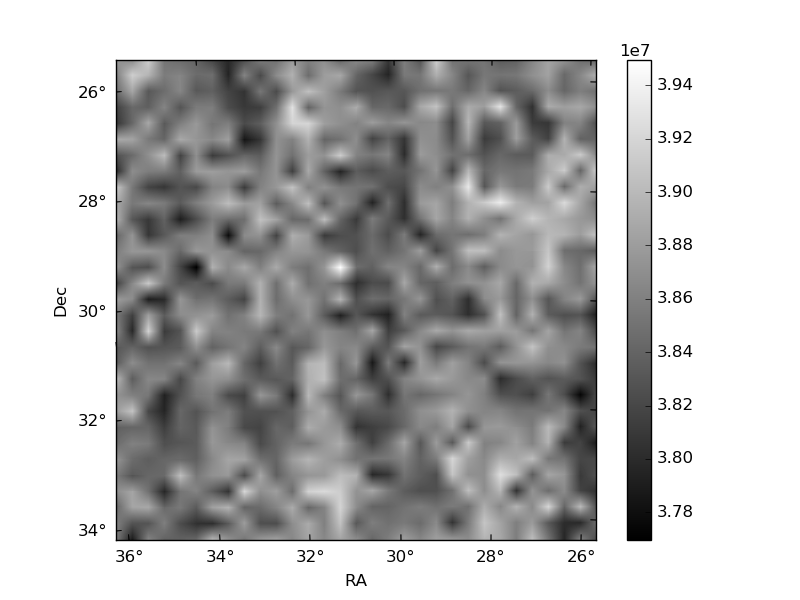
Histogram calculated using DETX and DETY for each event in the final _common_clean file
| Quadrant A | 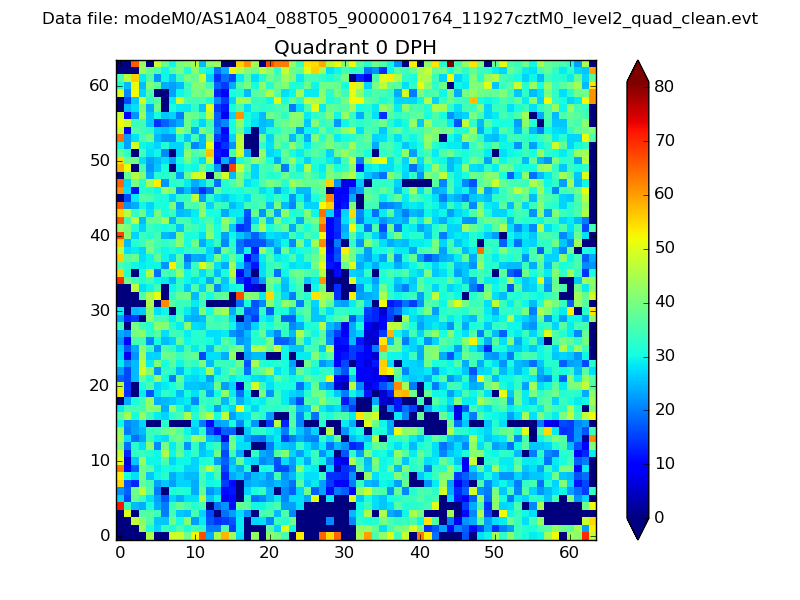 |
 |
Quadrant B |
|---|---|---|---|
| Quadrant D | 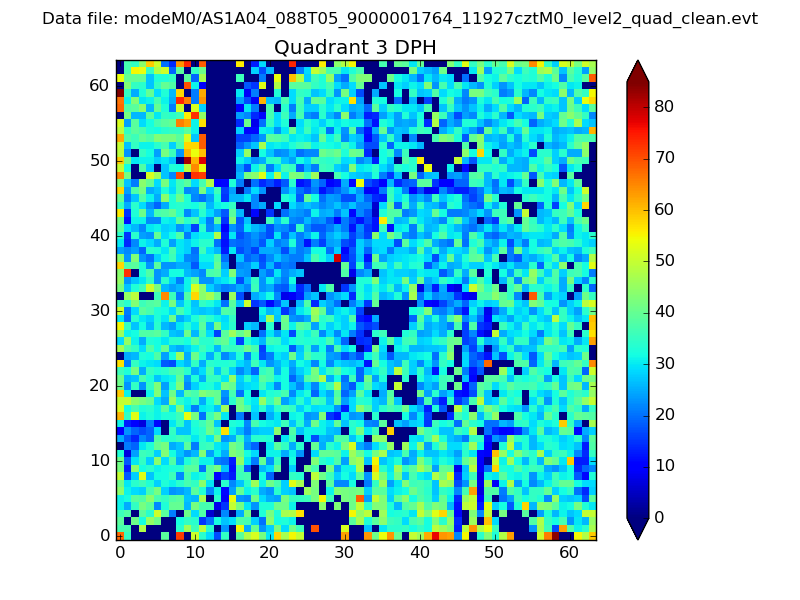 |
 |
Quadrant C |
| Plot type | Count rate plots | Images |
|---|---|---|
| Comparison with Poisson distribution Blue bars denote a histogram of data divided into 1 sec bins. Red curve is a Poisson curve with rate = median count rate of data. |
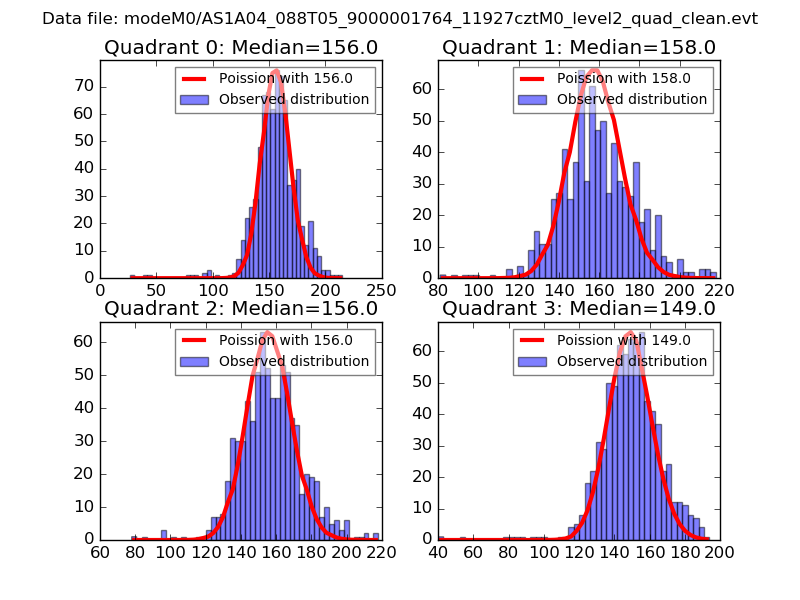 |
 |
| Quadrant-wise count rates Data is divided into 100 sec bins |
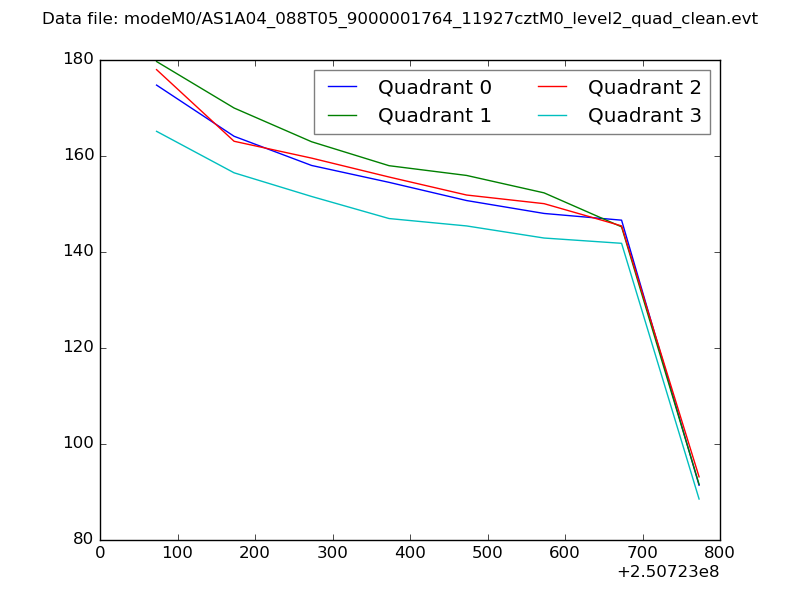 |
|
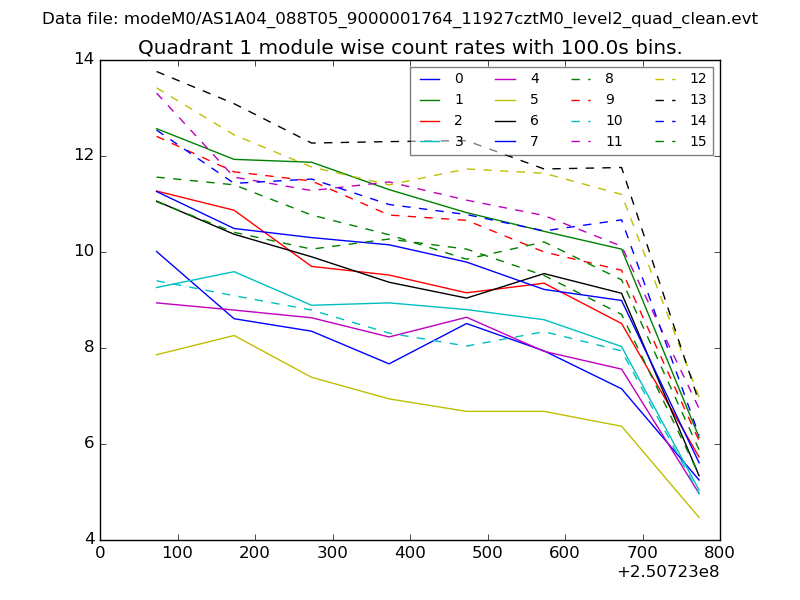
| Module-wise count rates for Quadrant A Data is divided into 100 sec bins |
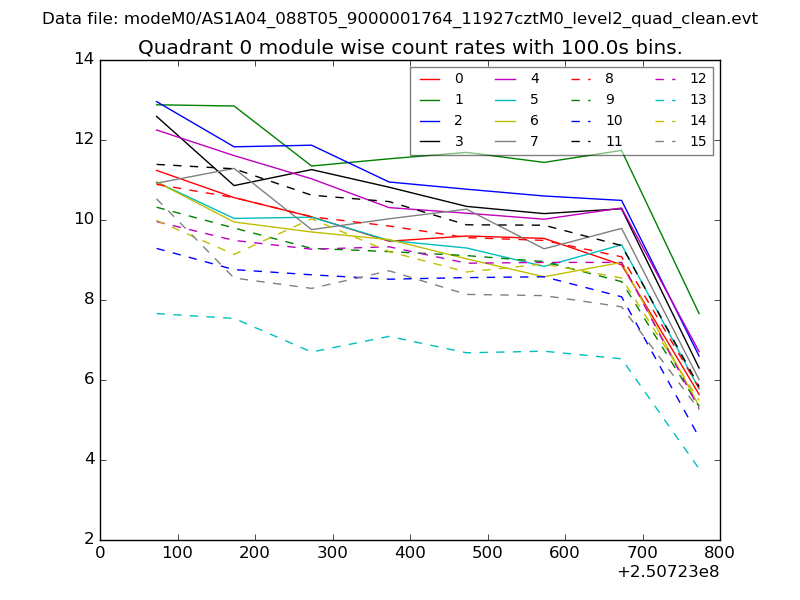 |
 |
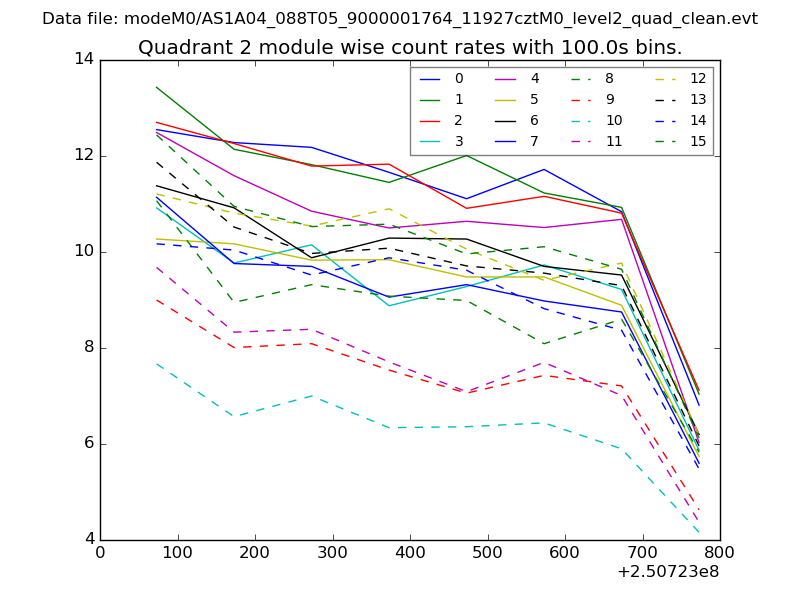
| Module-wise count rates for Quadrant B Data is divided into 100 sec bins |
 |
 |
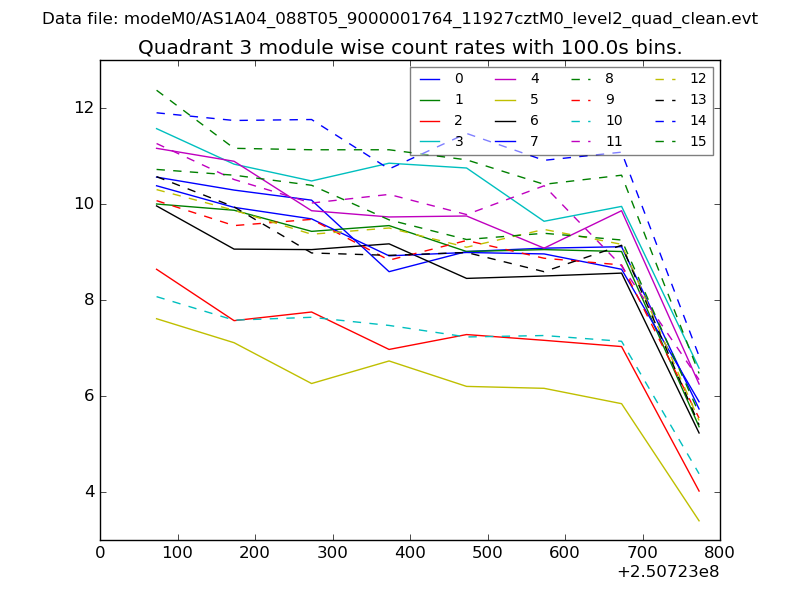
| Module-wise count rates for Quadrant C Data is divided into 100 sec bins |
 |
 |
| Module-wise count rates for Quadrant D Data is divided into 100 sec bins |
 |
 |
| Parameter | Plot |
|---|---|
| CZT HV Monitor | 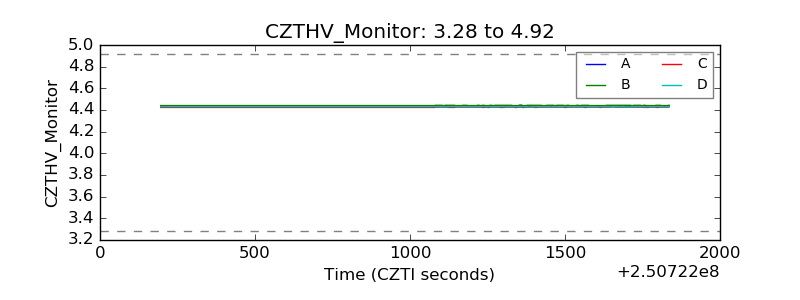 |
| D_VDD | 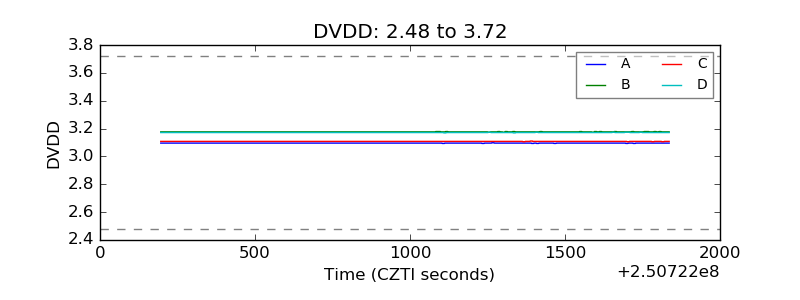 |
| Temperature 1 | 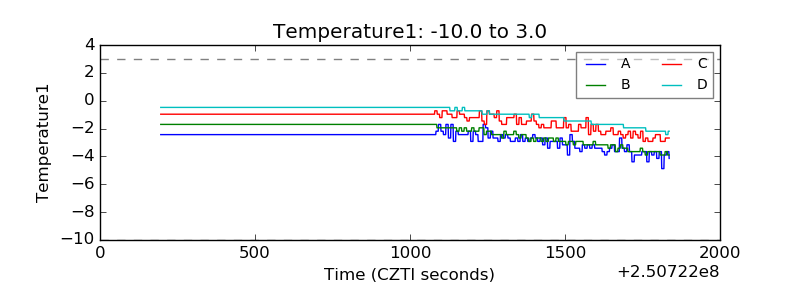 |
| Veto HV Monitor | 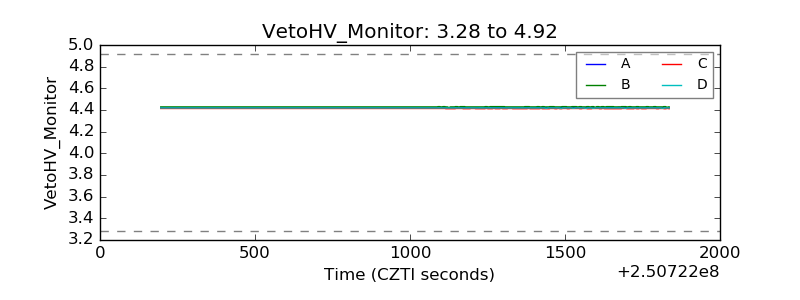 |
| Veto LLD | 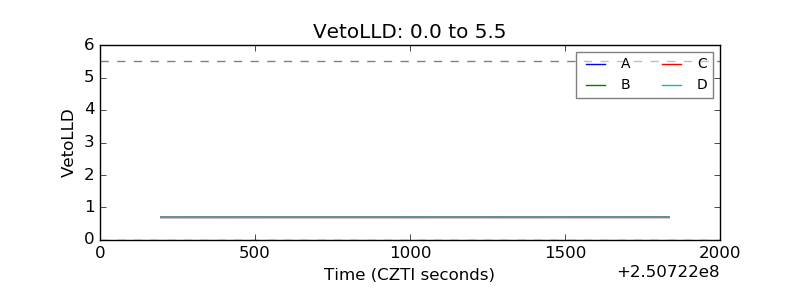 |
| Alpha Counter | 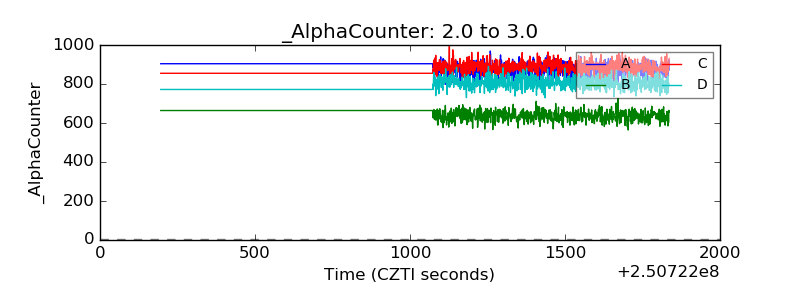 |
| _CPM_Rate | 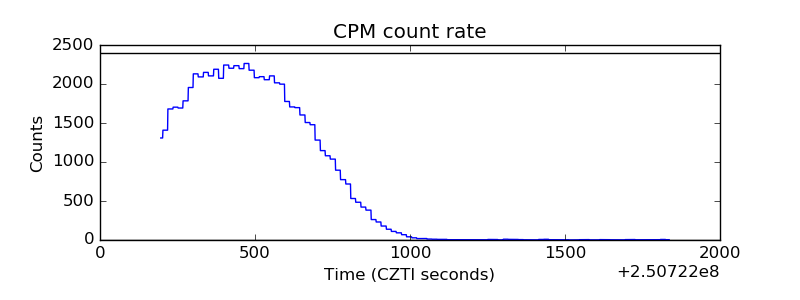 |
| CZT Counter |  |
| +2.5 Volts monitor |  |
| +5 Volts monitor |  |
| _ROLL_ROT | 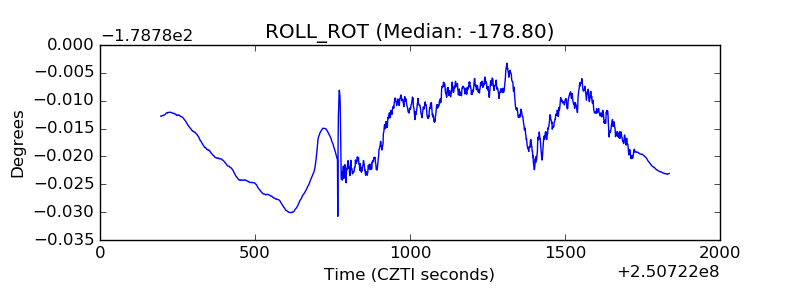 |
| _Roll_DEC | 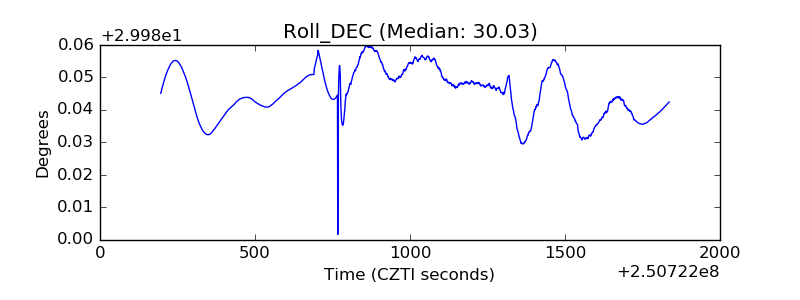 |
| _Roll_RA | 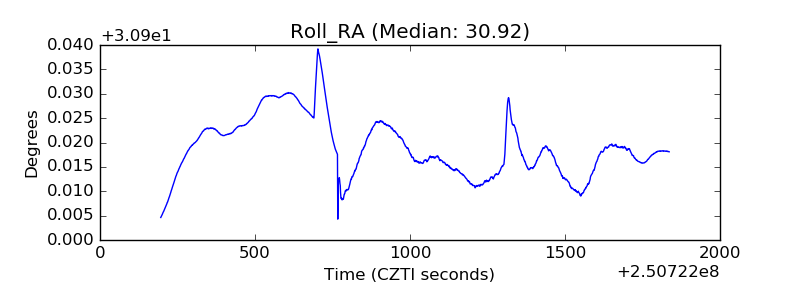 |
| Veto Counter | 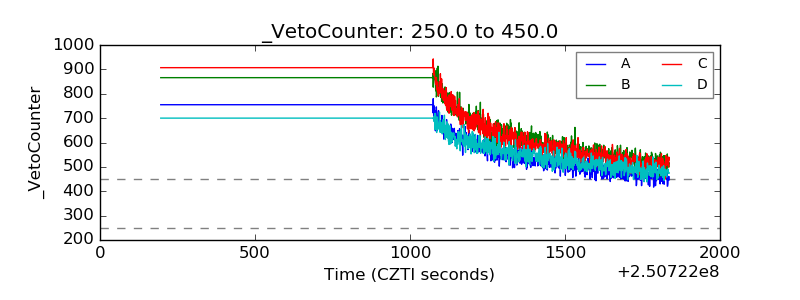 |