| Param | Original file | Final file |
|---|---|---|
| Filename | modeM0/AS1A04_124T01_9000001766cztM0_level2.fits | modeM0/AS1A04_124T01_9000001766cztM0_level2_quad_clean.evt |
| Size (bytes) | 1,762,372,800 | 2,542,711,680 |
| Size | 1.6 GB | 2.4 GB |
| Events in quadrant A | 10,531,102 | 16,822,847 |
| Events in quadrant B | 10,121,296 | 16,625,479 |
| Events in quadrant C | 10,554,212 | 15,933,949 |
| Events in quadrant D | 8,850,788 | 14,328,149 |
| Mode SS | |||
|---|---|---|---|
| Quadrant | BADHDUFLAG | Total packets | Discarded packets |
| A | 0 | 3956 | 0 |
| B | 0 | 3956 | 0 |
| C | 0 | 3956 | 0 |
| D | 0 | 3956 | 0 |
| Mode M9 | |||
|---|---|---|---|
| Quadrant | BADHDUFLAG | Total packets | Discarded packets |
| A | 0 | 281 | 0 |
| B | 0 | 281 | 0 |
| C | 0 | 281 | 0 |
| D | 0 | 281 | 0 |
| Mode M0 | |||
|---|---|---|---|
| Quadrant | BADHDUFLAG | Total packets | Discarded packets |
| A | 0 | 427719 | 0 |
| B | 0 | 482731 | 0 |
| C | 0 | 396443 | 0 |
| D | 0 | 503741 | 0 |
| Quadrant | Total seconds | Saturated seconds | Saturation percentage |
|---|---|---|---|
| A | 194294 | 3268 | 1.681987% |
| B | 194294 | 8649 | 4.451501% |
| C | 194294 | 1116 | 0.574387% |
| D | 194294 | 8437 | 4.342388% |
Noise dominated data is calculated using 1-second bins in cleaned event files. If a bin has >2000 counts, and if more than 50% of those come from <1% of pixels, then it is considered to be noise-dominated and hence unusable.
| Quadrant | # 1 sec bins | Bins with >0 counts | Bins with >2000 counts | High rate bins dominated by noise | Noise dominated (total time) | Noise dominated (detector-on time) | Marked lightcurve |
|---|---|---|---|---|---|---|---|
| A | 222366 | 194262 | 0 | 0 | 0.00% | 0.00% |  |
| B | 222366 | 194203 | 0 | 0 | 0.00% | 0.00% |  |
| C | 222366 | 194277 | 0 | 0 | 0.00% | 0.00% |  |
| D | 222366 | 193963 | 0 | 0 | 0.00% | 0.00% |  |
Top three noisy pixels from each quadrant. If the there are fewer than three noisy pixels in the level2.evt file, extra rows are filled as -1
| Pixel properties | Quadrant properties | ||||||
|---|---|---|---|---|---|---|---|
| Quadrant | DetID | PixID | Counts | Sigma | Mean | Median | Sigma |
| A | 0 | 29 | 10437 | 11.46 | 2746 | 2575 | 685.8 |
| A | 7 | 110 | 8570 | 8.74 | 2746 | 2575 | 685.8 |
| A | 0 | 30 | 7971 | 7.87 | 2746 | 2575 | 685.8 |
| B | 2 | 9 | 8903 | 12.34 | 2674 | 2553 | 514.7 |
| B | 14 | 254 | 6906 | 8.46 | 2674 | 2553 | 514.7 |
| B | 5 | 128 | 6697 | 8.05 | 2674 | 2553 | 514.7 |
| C | 12 | 241 | 7646 | 7.05 | 2789 | 2594 | 716.8 |
| C | 2 | 191 | 7247 | 6.49 | 2789 | 2594 | 716.8 |
| C | 3 | 126 | 6880 | 5.98 | 2789 | 2594 | 716.8 |
| D | 3 | 14 | 6722 | 6.52 | 2530 | 2299 | 677.9 |
| D | 6 | 231 | 6595 | 6.34 | 2530 | 2299 | 677.9 |
| D | 7 | 5 | 6339 | 5.96 | 2530 | 2299 | 677.9 |
Histogram calculated using DETX and DETY for each event in the final _common_clean file
| Quadrant A | 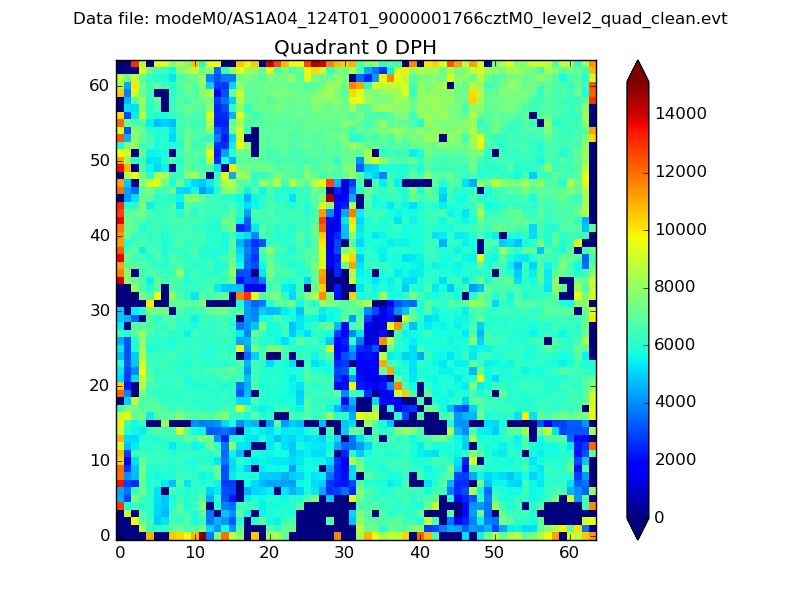 |
 |
Quadrant B |
|---|---|---|---|
| Quadrant D |  |
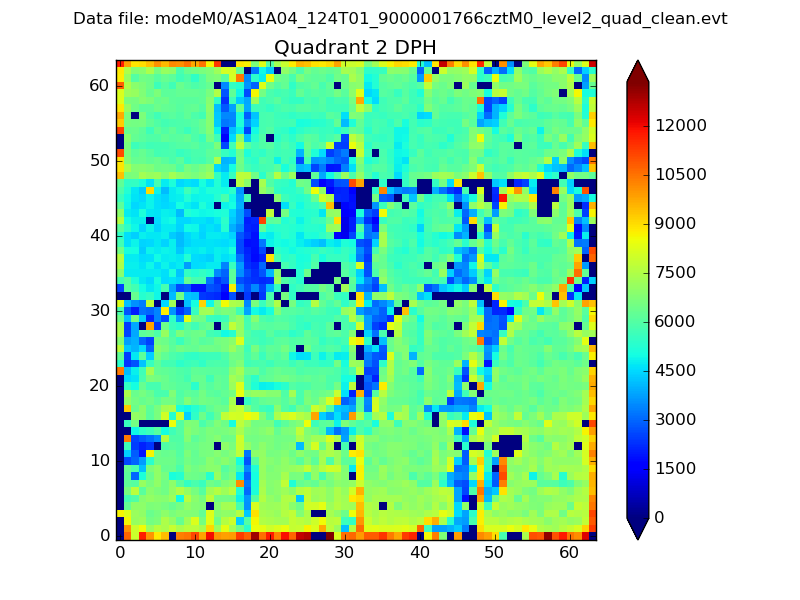 |
Quadrant C |
| Plot type | Count rate plots | Images |
|---|---|---|
| Comparison with Poisson distribution Blue bars denote a histogram of data divided into 1 sec bins. Red curve is a Poisson curve with rate = median count rate of data. |
 |
 |
| Quadrant-wise count rates Data is divided into 100 sec bins |
 |
|
| Module-wise count rates for Quadrant A Data is divided into 100 sec bins |
 |
 |
| Module-wise count rates for Quadrant B Data is divided into 100 sec bins |
 |
 |
| Module-wise count rates for Quadrant C Data is divided into 100 sec bins |
 |
 |
| Module-wise count rates for Quadrant D Data is divided into 100 sec bins |
 |
 |
| Parameter | Plot |
|---|---|
| CZT HV Monitor |  |
| D_VDD |  |
| Temperature 1 |  |
| Veto HV Monitor |  |
| Veto LLD |  |
| Alpha Counter |  |
| _CPM_Rate |  |
| CZT Counter |  |
| +2.5 Volts monitor |  |
| +5 Volts monitor |  |
| _ROLL_ROT | 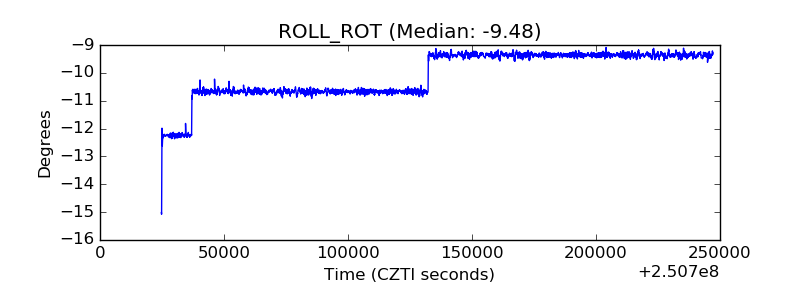 |
| _Roll_DEC |  |
| _Roll_RA |  |
| Veto Counter |  |