| Param | Original file | Final file |
|---|---|---|
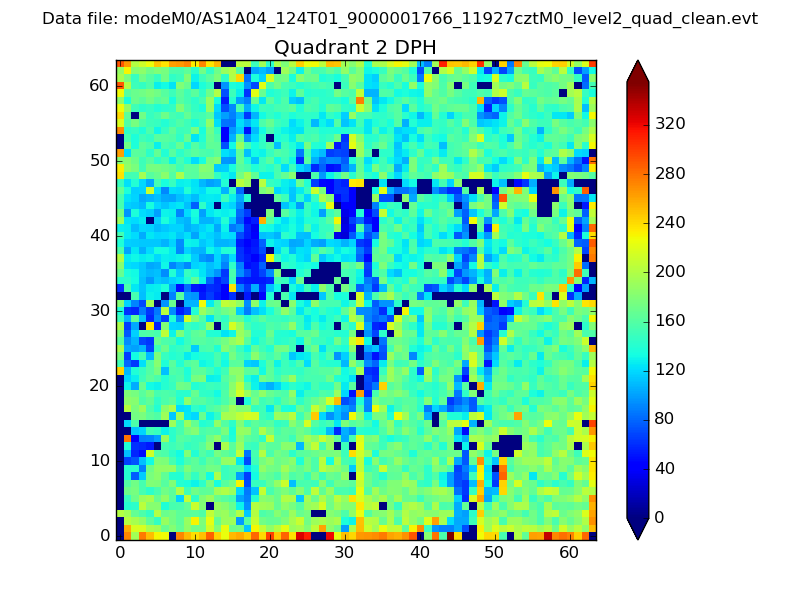
| Filename | modeM0/AS1A04_124T01_9000001766_11927cztM0_level2.evt | modeM0/AS1A04_124T01_9000001766_11927cztM0_level2_quad_clean.evt |
| Size (bytes) | 330,549,120 | 88,335,360 |
| Size | 315.2 MB | 84.2 MB |
| Events in quadrant A | 2,335,482 | 597,026 |
| Events in quadrant B | 2,789,127 | 604,635 |
| Events in quadrant C | 2,016,567 | 592,880 |
| Events in quadrant D | 2,557,862 | 559,313 |
| Mode SS | |||
|---|---|---|---|
| Quadrant | BADHDUFLAG | Total packets | Discarded packets |
| A | 0 | 92 | 0 |
| B | 0 | 92 | 0 |
| C | 0 | 92 | 0 |
| D | 0 | 92 | 0 |
| Mode M9 | |||
|---|---|---|---|
| Quadrant | BADHDUFLAG | Total packets | Discarded packets |
| A | 0 | 14 | 0 |
| B | 0 | 14 | 0 |
| C | 0 | 14 | 0 |
| D | 0 | 14 | 0 |
| Mode M0 | |||
|---|---|---|---|
| Quadrant | BADHDUFLAG | Total packets | Discarded packets |
| A | 0 | 10014 | 2 |
| B | 0 | 11411 | 1 |
| C | 0 | 9370 | 1 |
| D | 0 | 10618 | 1 |
| Quadrant | Total seconds | Saturated seconds | Saturation percentage |
|---|---|---|---|
| A | 4576 | 38 | 0.830420% |
| B | 4576 | 161 | 3.518357% |
| C | 4576 | 21 | 0.458916% |
| D | 4576 | 64 | 1.398601% |
Noise dominated data is calculated using 1-second bins in cleaned event files. If a bin has >2000 counts, and if more than 50% of those come from <1% of pixels, then it is considered to be noise-dominated and hence unusable.
| Quadrant | # 1 sec bins | Bins with >0 counts | Bins with >2000 counts | High rate bins dominated by noise | Noise dominated (total time) | Noise dominated (detector-on time) | Marked lightcurve |
|---|---|---|---|---|---|---|---|
| A | 5922 | 4578 | 0 | 0 | 0.00% | 0.00% | 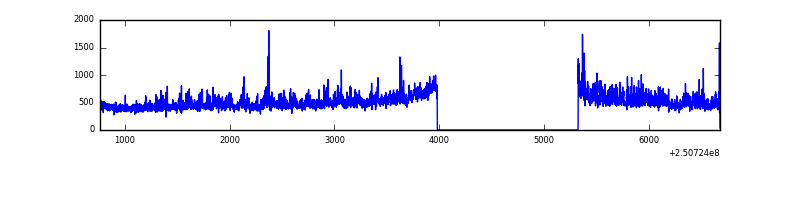 |
| B | 5922 | 4577 | 66 | 66 | 1.11% | 1.44% | 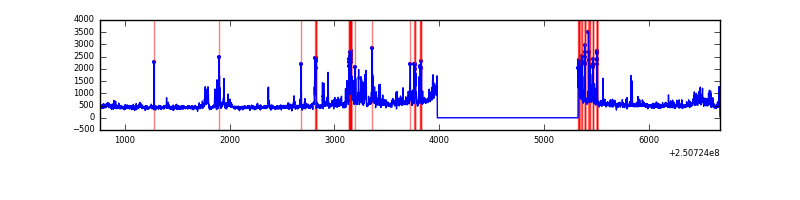 |
| C | 5922 | 4578 | 3 | 3 | 0.05% | 0.07% | 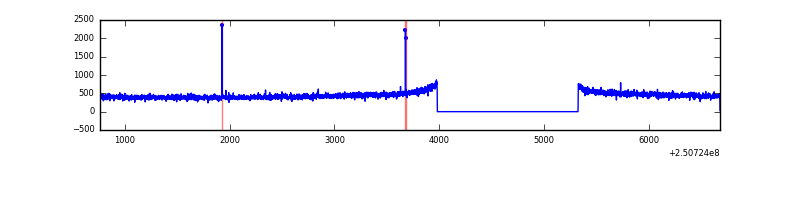 |
| D | 5922 | 4578 | 30 | 30 | 0.51% | 0.66% |  |
Top three noisy pixels from each quadrant. If the there are fewer than three noisy pixels in the level2.evt file, extra rows are filled as -1
| Pixel properties | Quadrant properties | ||||||
|---|---|---|---|---|---|---|---|
| Quadrant | DetID | PixID | Counts | Sigma | Mean | Median | Sigma |
| A | 1 | 162 | 82073 | 747.57 | 533 | 522 | 109.1 |
| A | 8 | 15 | 49310 | 447.24 | 533 | 522 | 109.1 |
| A | 1 | 178 | 44197 | 400.36 | 533 | 522 | 109.1 |
| B | 3 | 64 | 374846 | 3740.98 | 531 | 519 | 100.1 |
| B | 4 | 239 | 189802 | 1891.67 | 531 | 519 | 100.1 |
| B | 15 | 185 | 86435 | 858.63 | 531 | 519 | 100.1 |
| C | 14 | 234 | 7906 | 62.77 | 514 | 516 | 117.7 |
| C | 14 | 238 | 5342 | 40.99 | 514 | 516 | 117.7 |
| C | 13 | 61 | 3821 | 28.07 | 514 | 516 | 117.7 |
| D | 8 | 195 | 288893 | 2403.54 | 505 | 492 | 120.0 |
| D | 1 | 52 | 129097 | 1071.8 | 505 | 492 | 120.0 |
| D | 13 | 104 | 70077 | 579.92 | 505 | 492 | 120.0 |
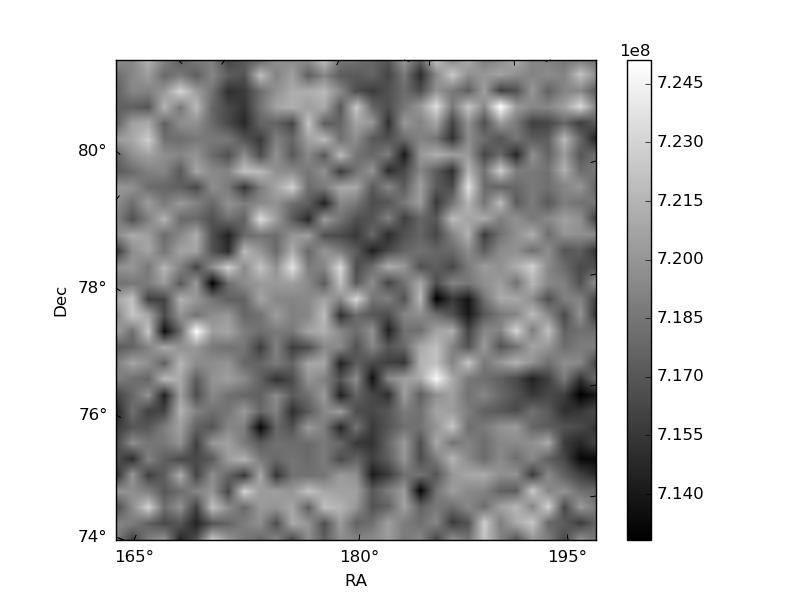
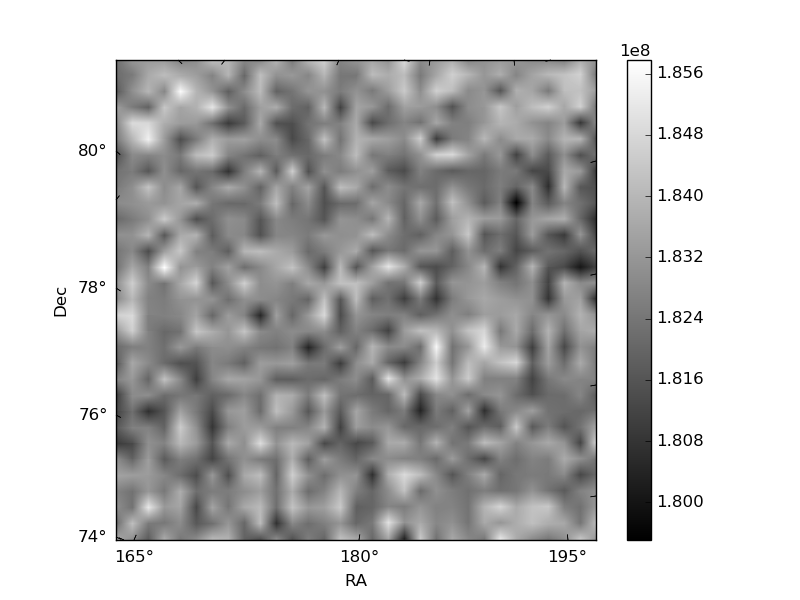
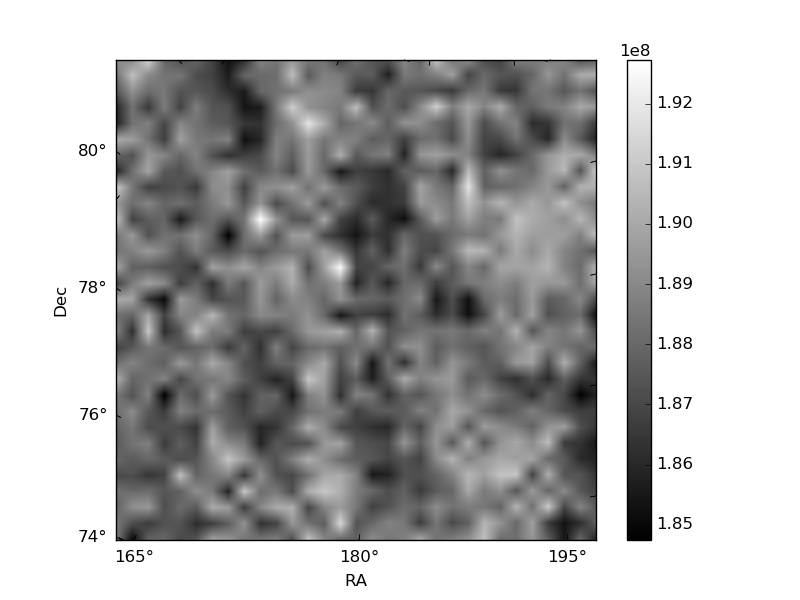
Histogram calculated using DETX and DETY for each event in the final _common_clean file
| Quadrant A |  |
 |
Quadrant B |
|---|---|---|---|
| Quadrant D |  |
 |
Quadrant C |
| Plot type | Count rate plots | Images |
|---|---|---|
| Comparison with Poisson distribution Blue bars denote a histogram of data divided into 1 sec bins. Red curve is a Poisson curve with rate = median count rate of data. |
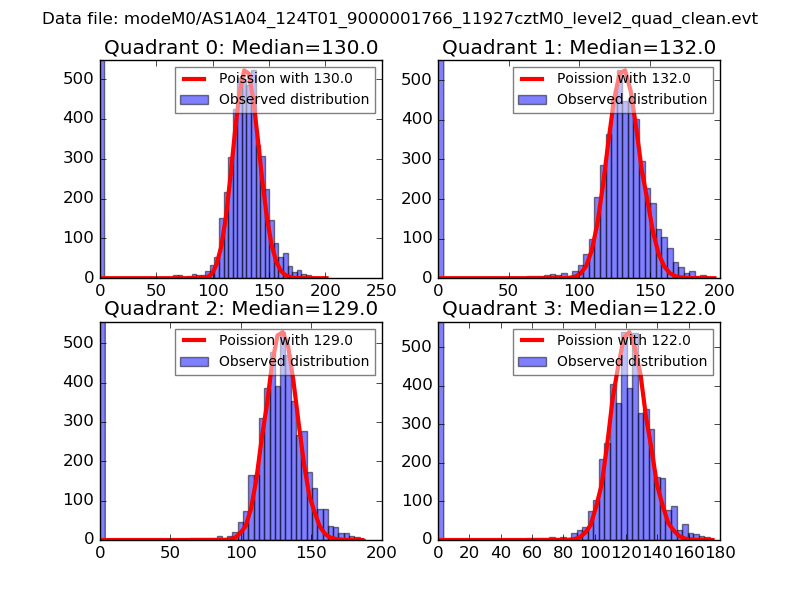 |
 |
| Quadrant-wise count rates Data is divided into 100 sec bins |
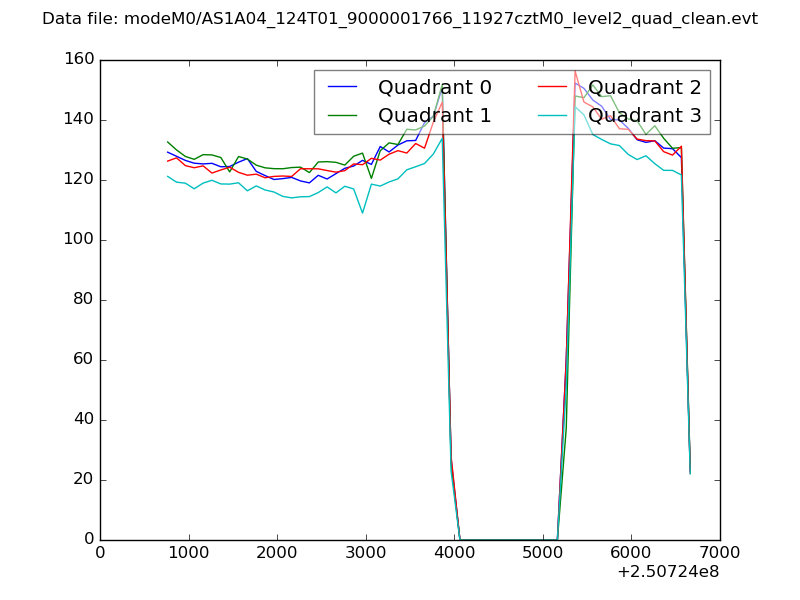 |
|
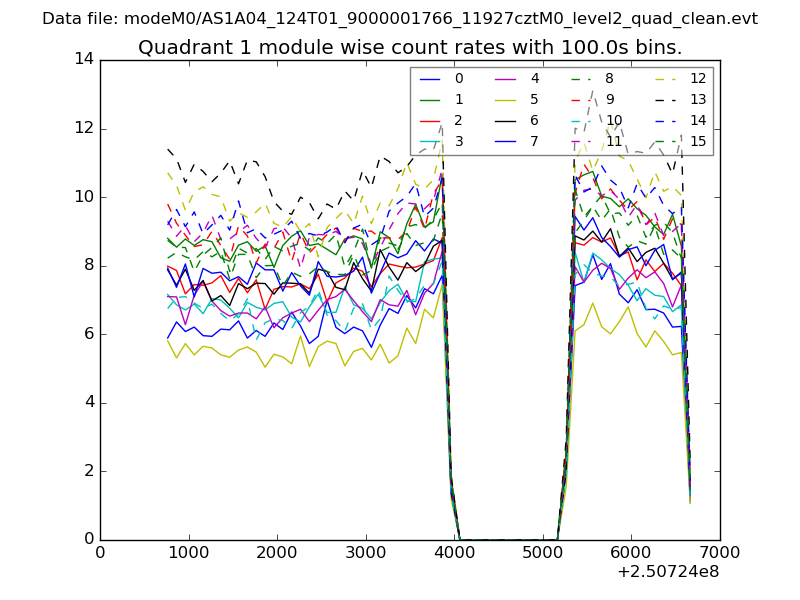
| Module-wise count rates for Quadrant A Data is divided into 100 sec bins |
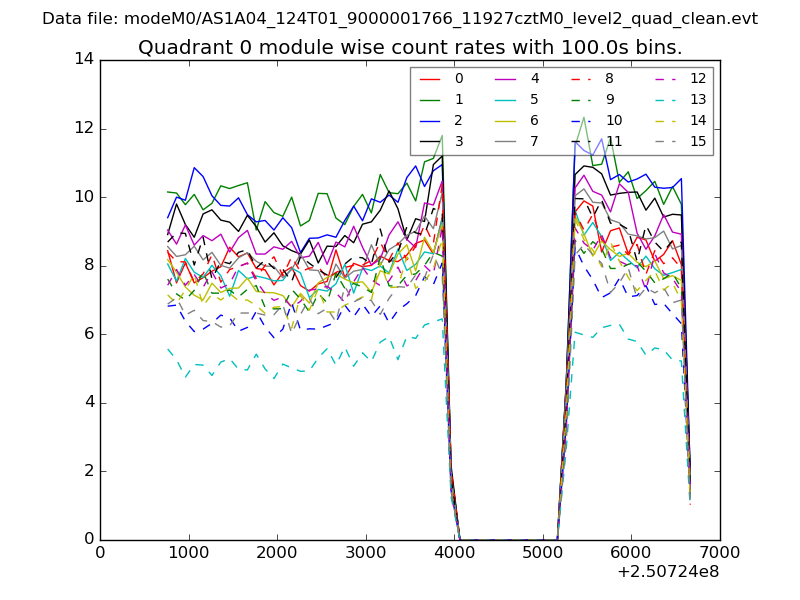 |
 |
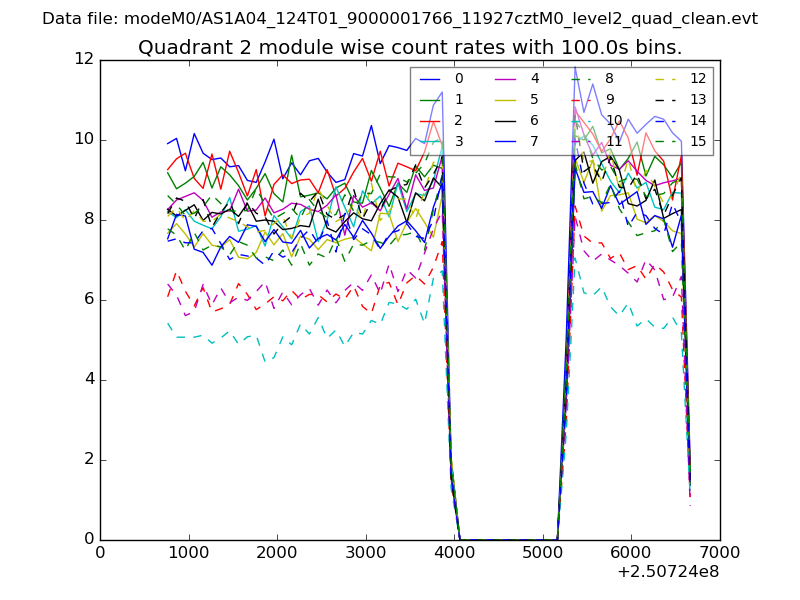
| Module-wise count rates for Quadrant B Data is divided into 100 sec bins |
 |
 |
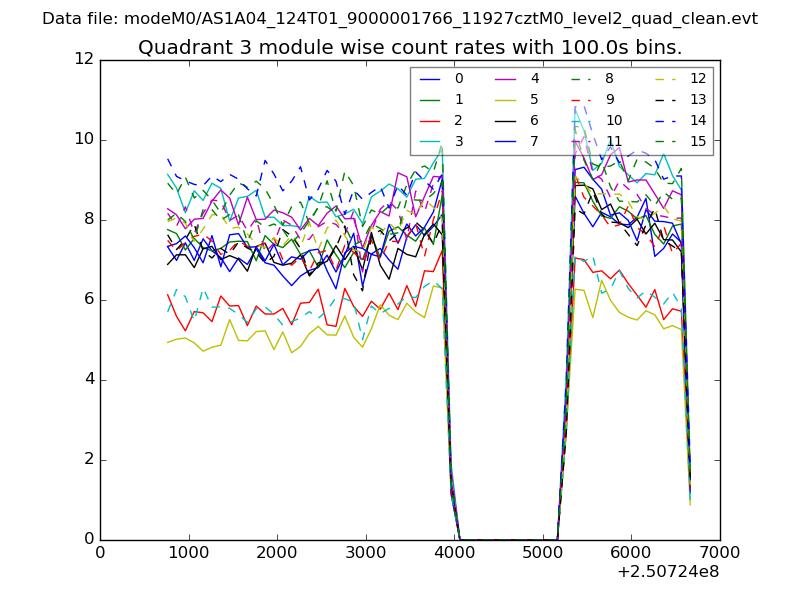
| Module-wise count rates for Quadrant C Data is divided into 100 sec bins |
 |
 |
| Module-wise count rates for Quadrant D Data is divided into 100 sec bins |
 |
 |
| Parameter | Plot |
|---|---|
| CZT HV Monitor | 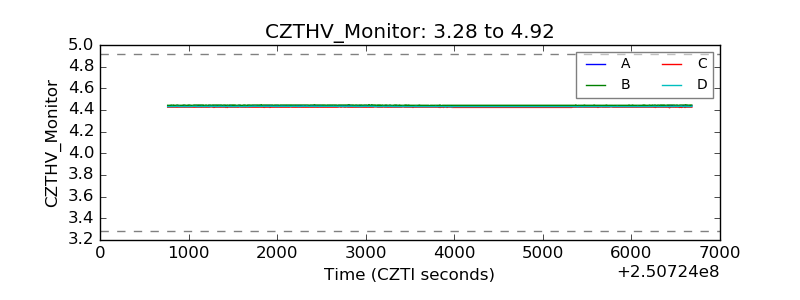 |
| D_VDD | 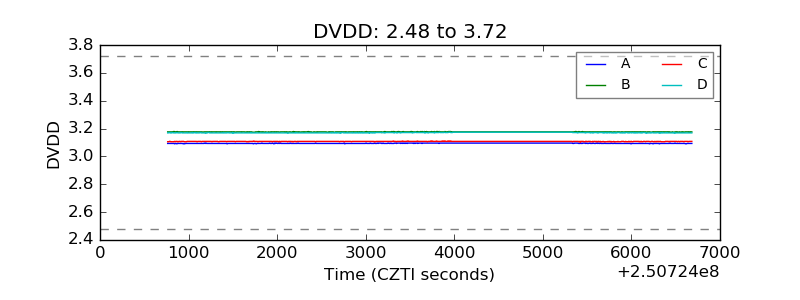 |
| Temperature 1 | 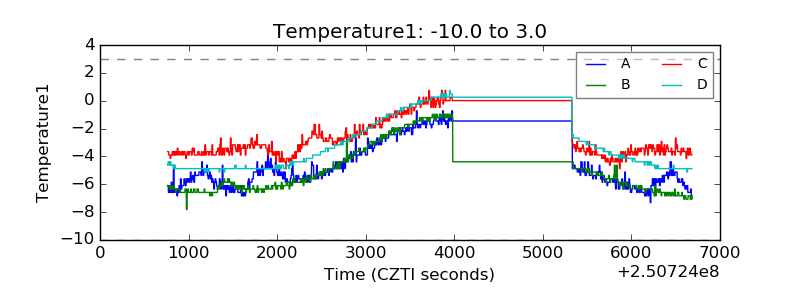 |
| Veto HV Monitor | 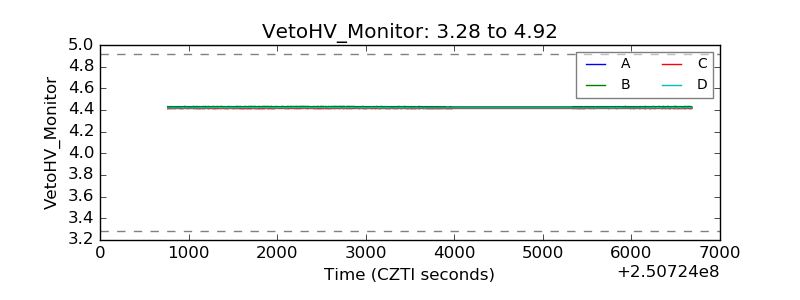 |
| Veto LLD | 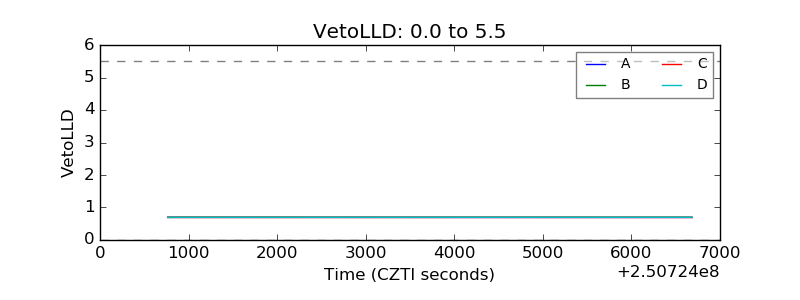 |
| Alpha Counter | 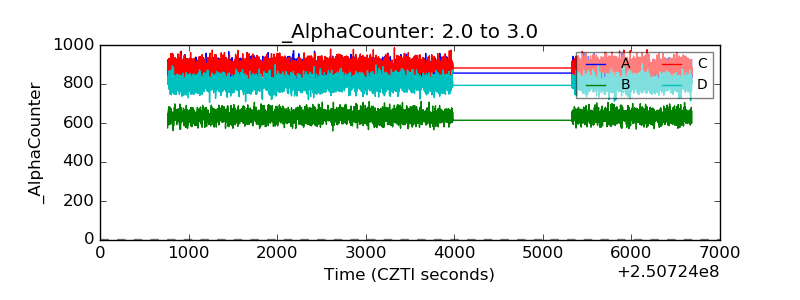 |
| _CPM_Rate | 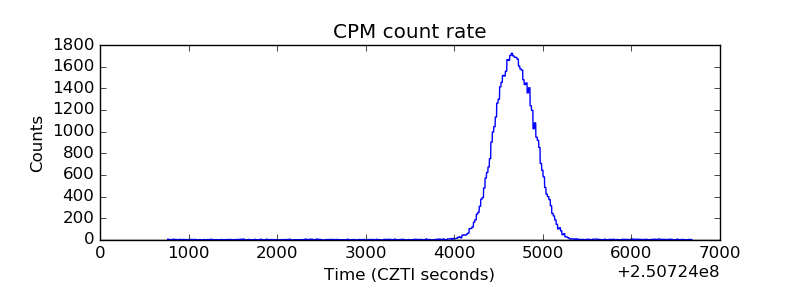 |
| CZT Counter |  |
| +2.5 Volts monitor |  |
| +5 Volts monitor |  |
| _ROLL_ROT | 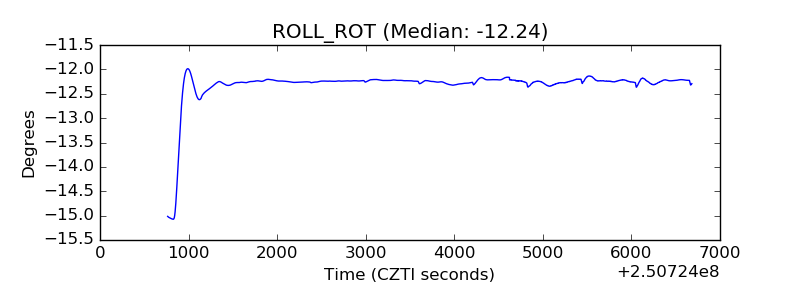 |
| _Roll_DEC | 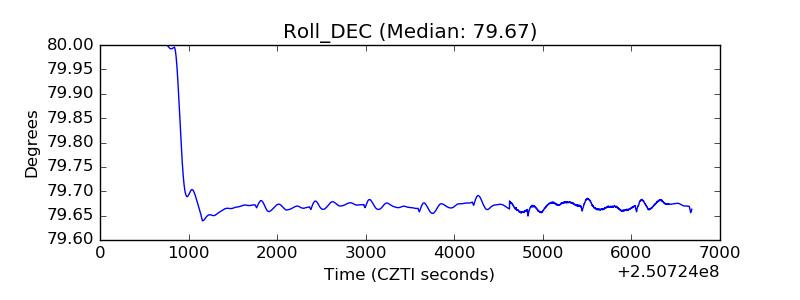 |
| _Roll_RA | 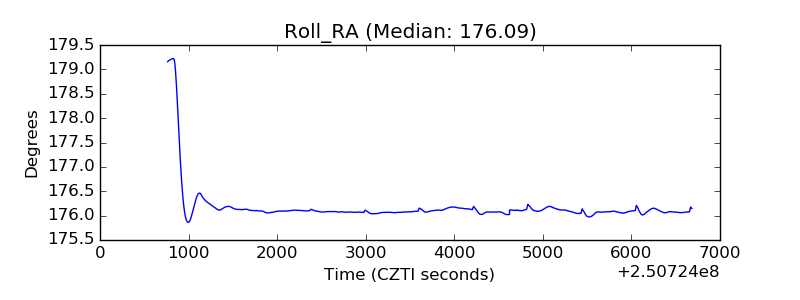 |
| Veto Counter | 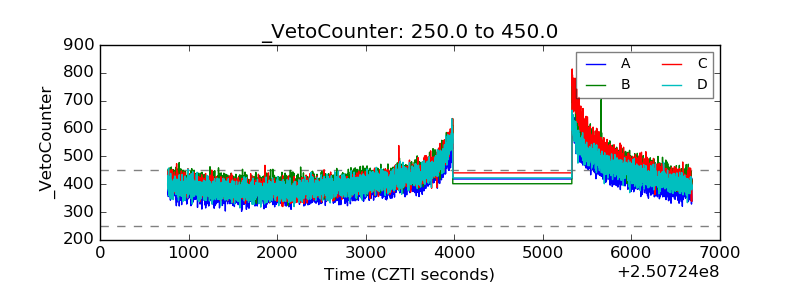 |