| Param | Original file | Final file |
|---|---|---|
| Filename | modeM0/AS1A04_124T01_9000001766_11928cztM0_level2.evt | modeM0/AS1A04_124T01_9000001766_11928cztM0_level2_quad_clean.evt |
| Size (bytes) | 469,100,160 | 125,400,960 |
| Size | 447.4 MB | 119.6 MB |
| Events in quadrant A | 3,431,882 | 845,370 |
| Events in quadrant B | 3,943,737 | 853,446 |
| Events in quadrant C | 2,885,667 | 843,351 |
| Events in quadrant D | 3,497,367 | 796,006 |
| Mode SS | |||
|---|---|---|---|
| Quadrant | BADHDUFLAG | Total packets | Discarded packets |
| A | 0 | 134 | 0 |
| B | 0 | 134 | 0 |
| C | 0 | 134 | 0 |
| D | 0 | 134 | 0 |
| Mode M9 | |||
|---|---|---|---|
| Quadrant | BADHDUFLAG | Total packets | Discarded packets |
| A | 0 | 20 | 0 |
| B | 0 | 20 | 0 |
| C | 0 | 20 | 0 |
| D | 0 | 21 | 0 |
| Mode M0 | |||
|---|---|---|---|
| Quadrant | BADHDUFLAG | Total packets | Discarded packets |
| A | 0 | 14518 | 3 |
| B | 0 | 16222 | 2 |
| C | 0 | 13415 | 2 |
| D | 0 | 15016 | 2 |
| Quadrant | Total seconds | Saturated seconds | Saturation percentage |
|---|---|---|---|
| A | 6596 | 47 | 0.712553% |
| B | 6596 | 251 | 3.805337% |
| C | 6596 | 8 | 0.121286% |
| D | 6596 | 105 | 1.591874% |
Noise dominated data is calculated using 1-second bins in cleaned event files. If a bin has >2000 counts, and if more than 50% of those come from <1% of pixels, then it is considered to be noise-dominated and hence unusable.
| Quadrant | # 1 sec bins | Bins with >0 counts | Bins with >2000 counts | High rate bins dominated by noise | Noise dominated (total time) | Noise dominated (detector-on time) | Marked lightcurve |
|---|---|---|---|---|---|---|---|
| A | 7812 | 6598 | 3 | 3 | 0.04% | 0.05% |  |
| B | 7812 | 6598 | 135 | 135 | 1.73% | 2.05% |  |
| C | 7812 | 6598 | 0 | 0 | 0.00% | 0.00% | 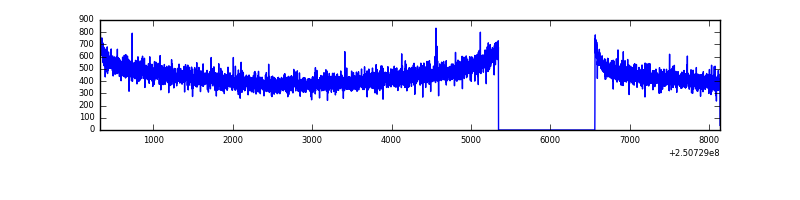 |
| D | 7812 | 6598 | 81 | 81 | 1.04% | 1.23% | 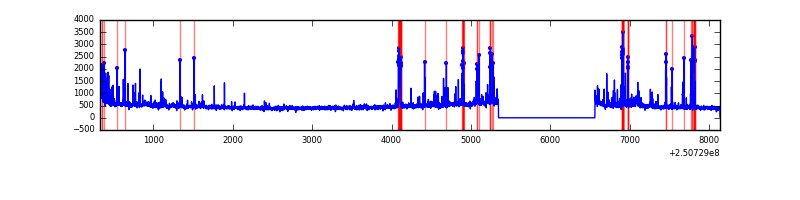 |
Top three noisy pixels from each quadrant. If the there are fewer than three noisy pixels in the level2.evt file, extra rows are filled as -1
| Pixel properties | Quadrant properties | ||||||
|---|---|---|---|---|---|---|---|
| Quadrant | DetID | PixID | Counts | Sigma | Mean | Median | Sigma |
| A | 1 | 162 | 138948 | 901.44 | 758 | 743 | 153.3 |
| A | 7 | 144 | 108948 | 705.76 | 758 | 743 | 153.3 |
| A | 1 | 178 | 74786 | 482.94 | 758 | 743 | 153.3 |
| B | 4 | 239 | 477659 | 3352.77 | 755 | 735 | 142.2 |
| B | 3 | 64 | 301921 | 2117.33 | 755 | 735 | 142.2 |
| B | 15 | 185 | 86278 | 601.37 | 755 | 735 | 142.2 |
| C | 14 | 238 | 7769 | 41.94 | 737 | 741 | 167.6 |
| C | 13 | 61 | 5387 | 27.72 | 737 | 741 | 167.6 |
| C | 12 | 4 | 2459 | 10.25 | 737 | 741 | 167.6 |
| D | 8 | 195 | 233068 | 1359.76 | 720 | 699 | 170.9 |
| D | 1 | 52 | 210712 | 1228.94 | 720 | 699 | 170.9 |
| D | 13 | 104 | 114947 | 668.55 | 720 | 699 | 170.9 |
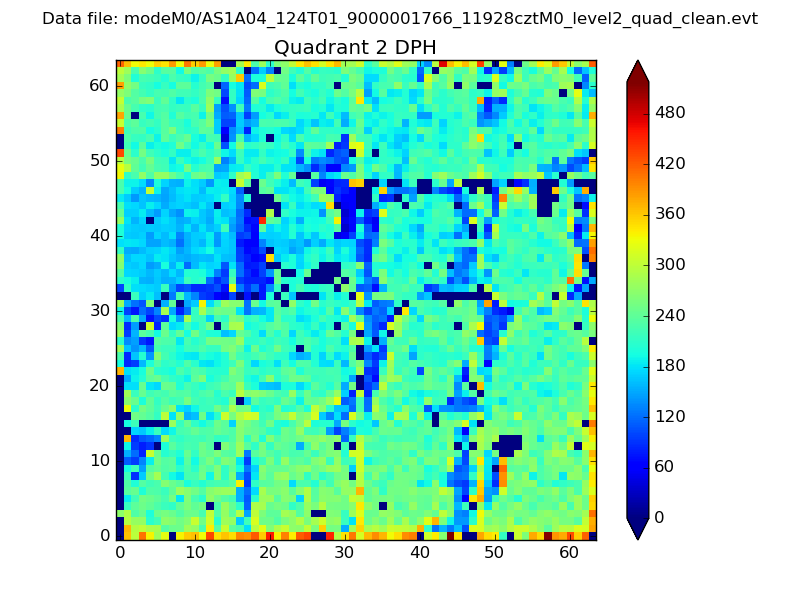
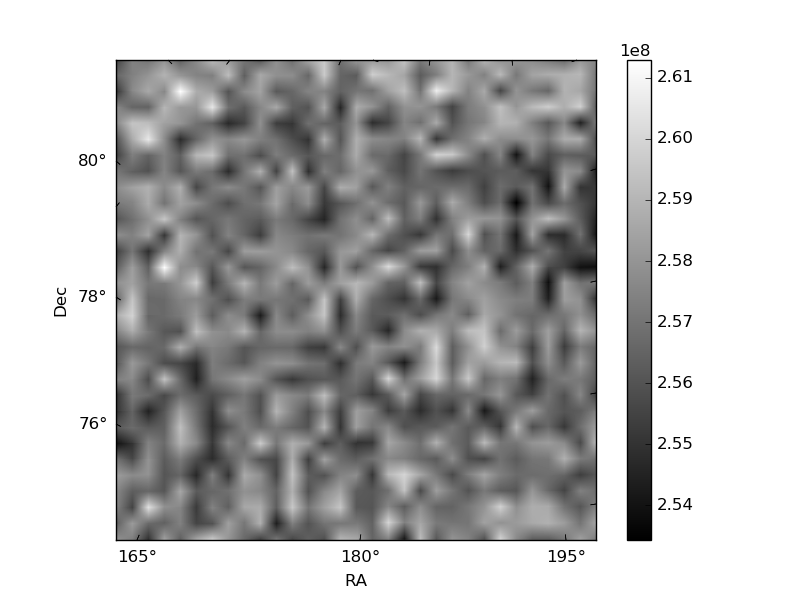
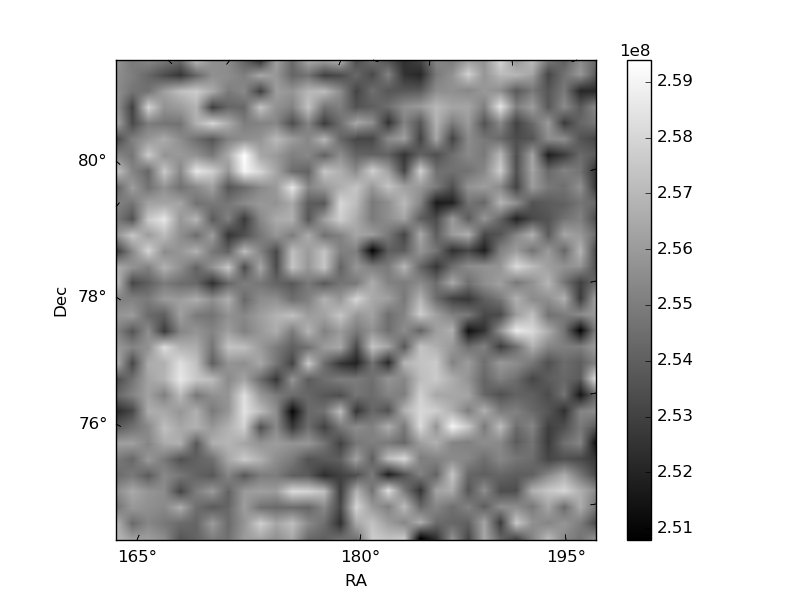
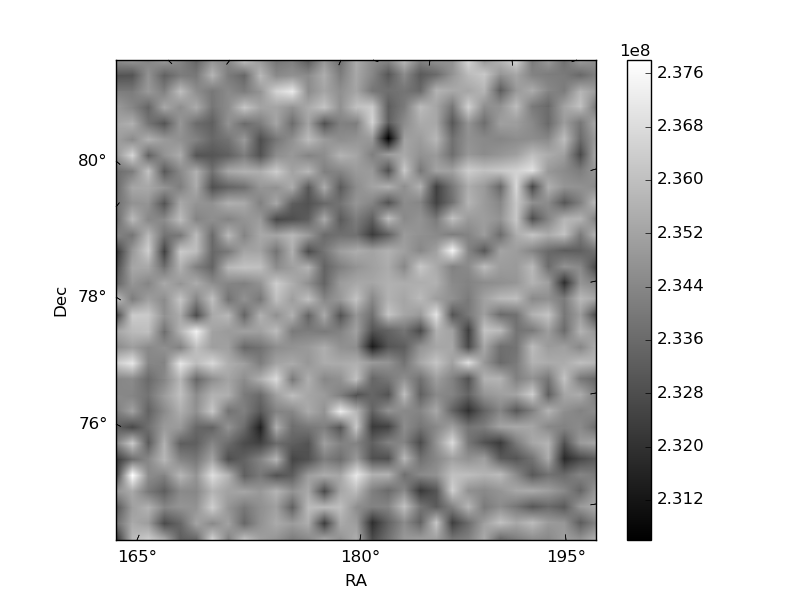
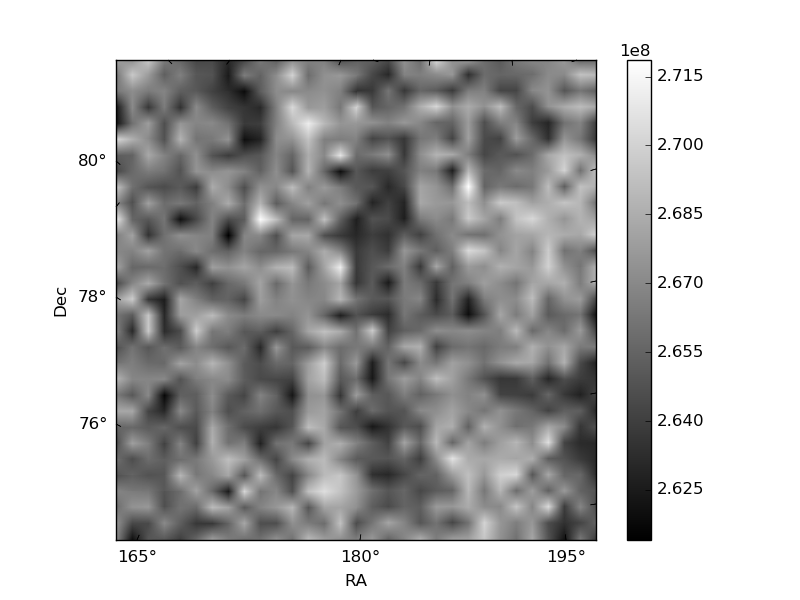
Histogram calculated using DETX and DETY for each event in the final _common_clean file
| Quadrant A | 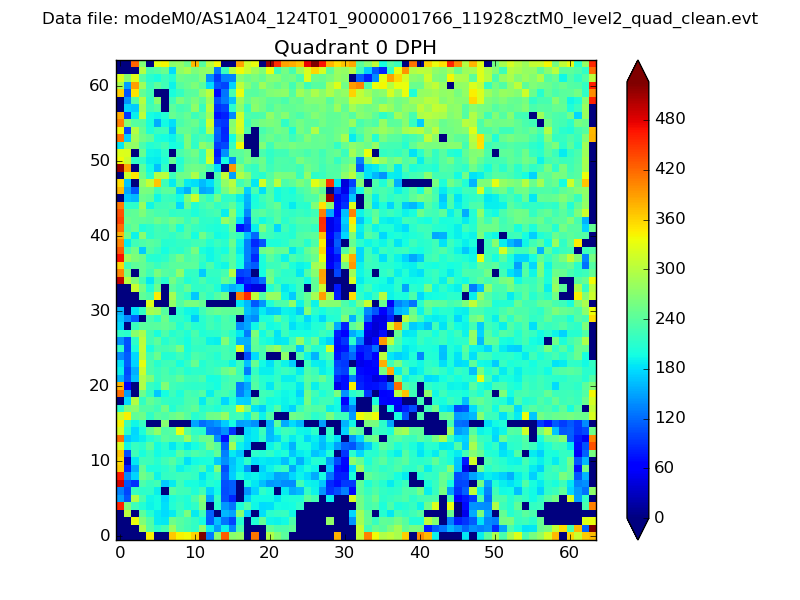 |
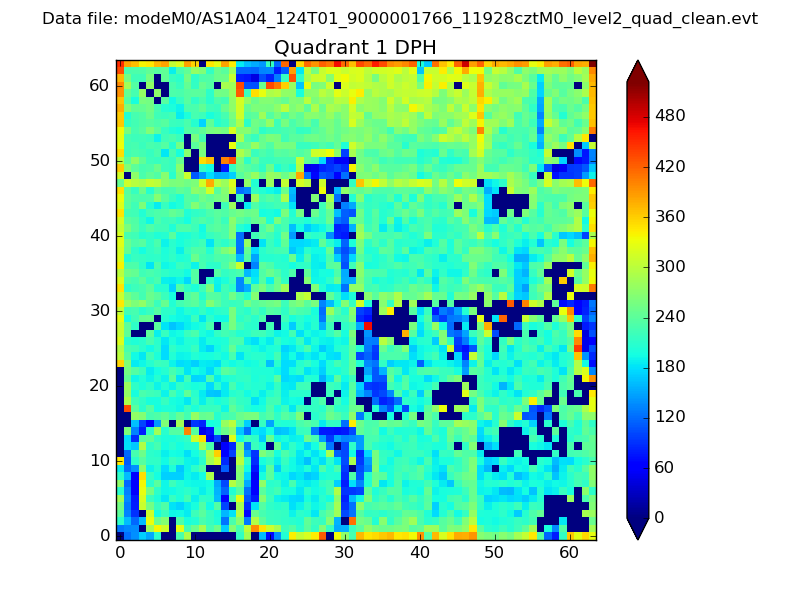 |
Quadrant B |
|---|---|---|---|
| Quadrant D | 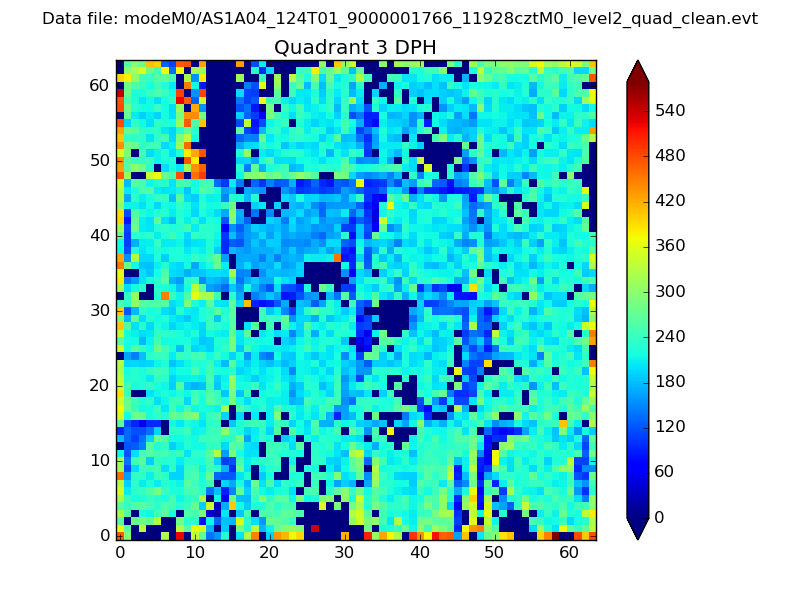 |
 |
Quadrant C |
| Plot type | Count rate plots | Images |
|---|---|---|
| Comparison with Poisson distribution Blue bars denote a histogram of data divided into 1 sec bins. Red curve is a Poisson curve with rate = median count rate of data. |
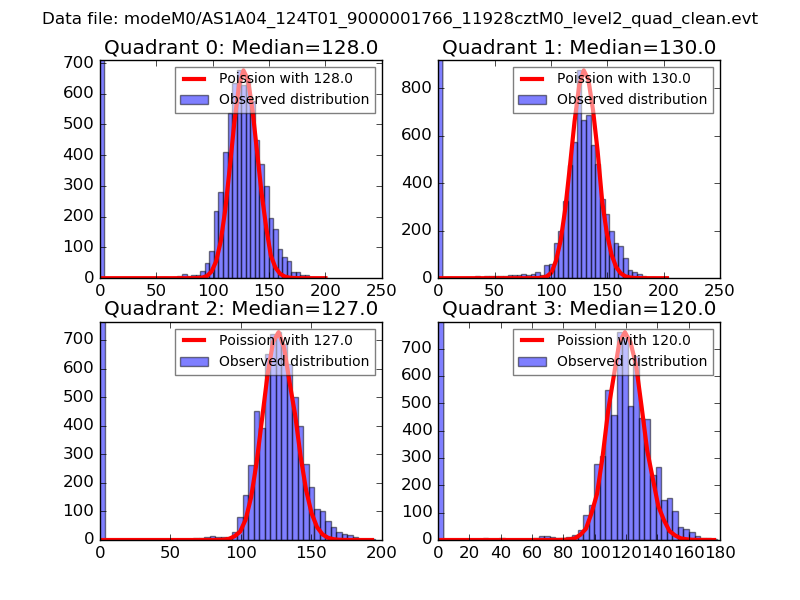 |
 |
| Quadrant-wise count rates Data is divided into 100 sec bins |
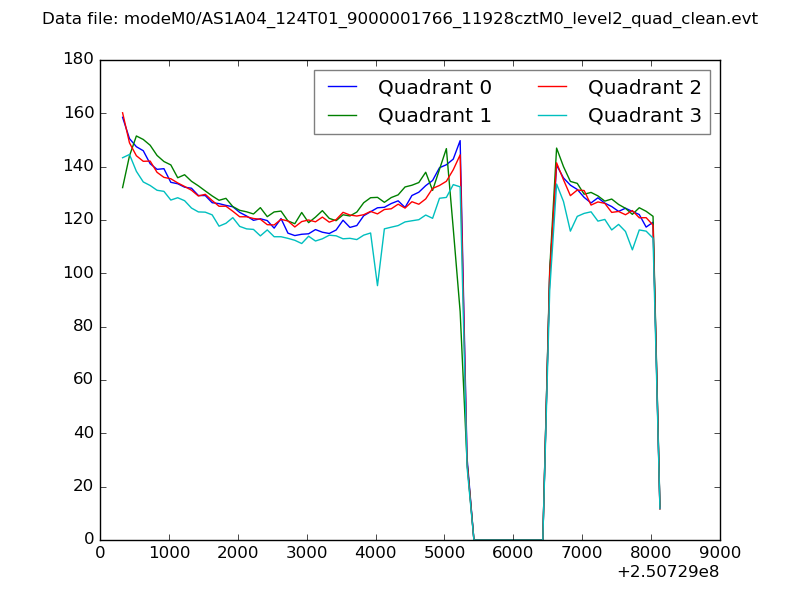 |
|
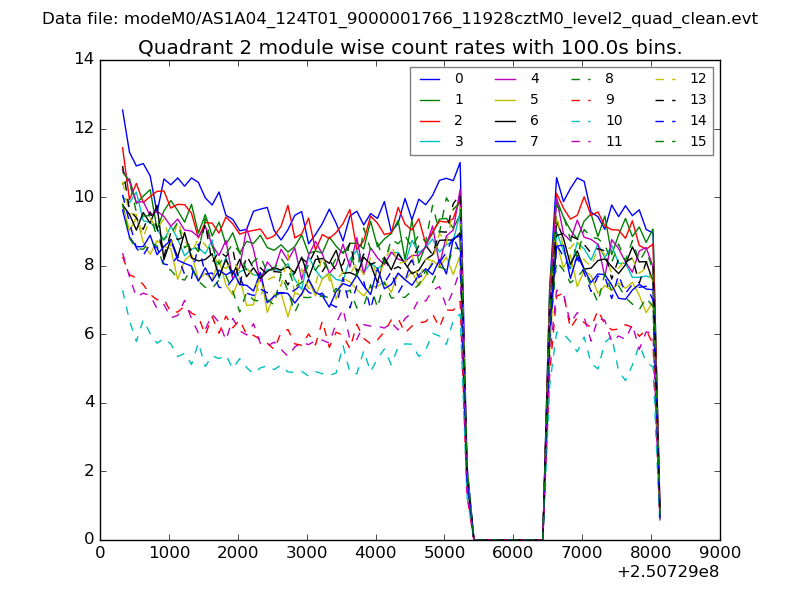
| Module-wise count rates for Quadrant A Data is divided into 100 sec bins |
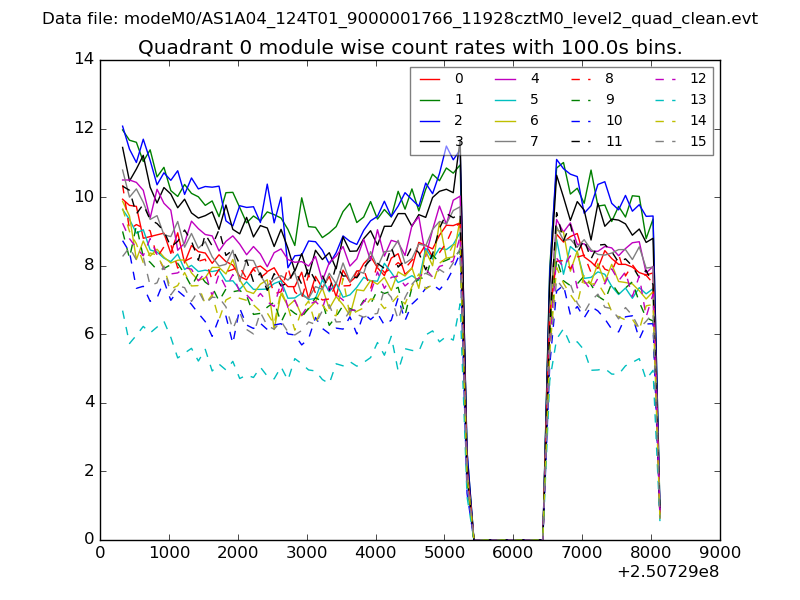 |
 |
| Module-wise count rates for Quadrant B Data is divided into 100 sec bins |
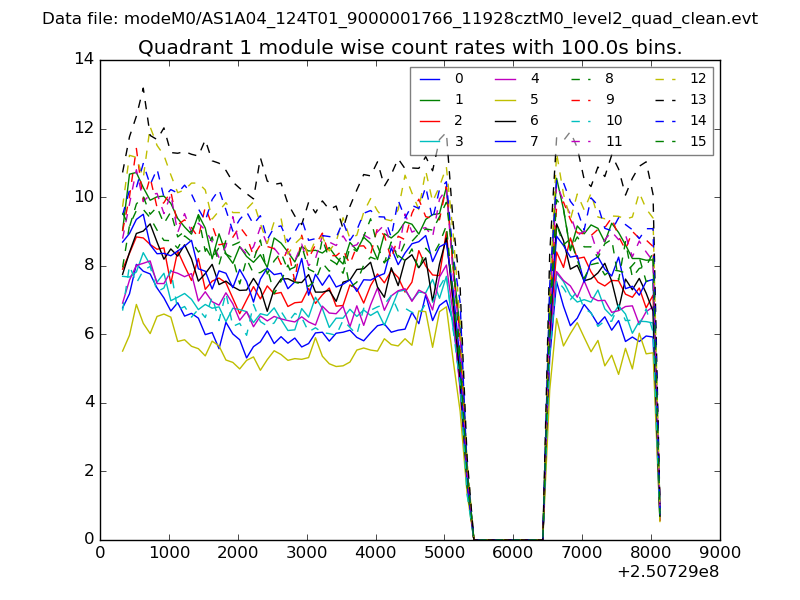 |
 |
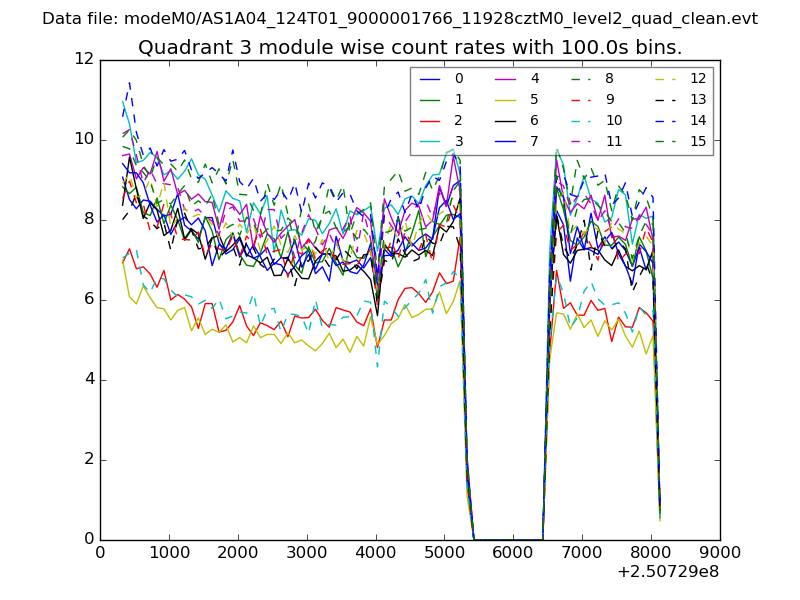
| Module-wise count rates for Quadrant C Data is divided into 100 sec bins |
 |
 |
| Module-wise count rates for Quadrant D Data is divided into 100 sec bins |
 |
 |
| Parameter | Plot |
|---|---|
| CZT HV Monitor | 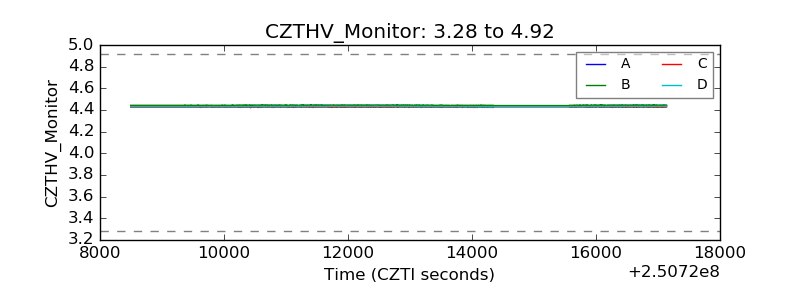 |
| D_VDD |  |
| Temperature 1 | 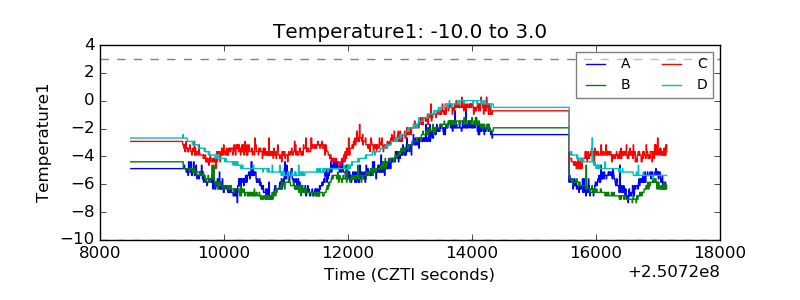 |
| Veto HV Monitor |  |
| Veto LLD | 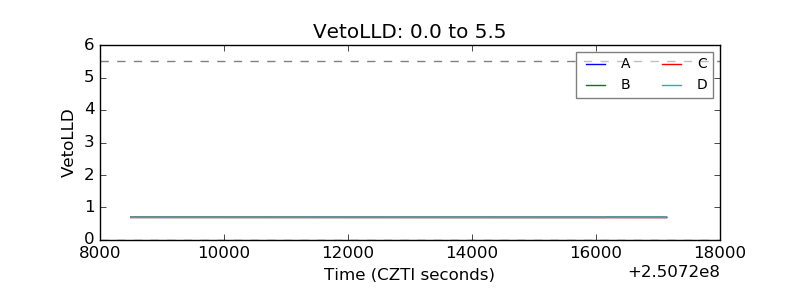 |
| Alpha Counter | 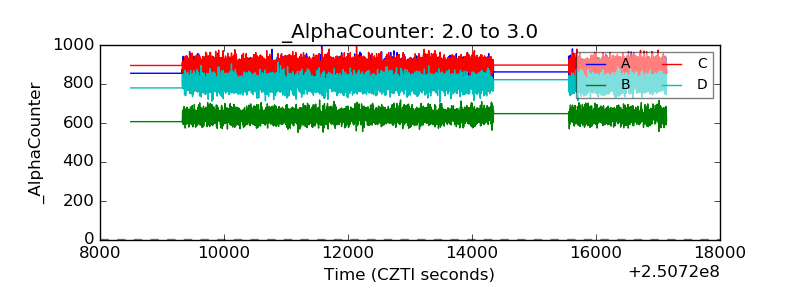 |
| _CPM_Rate | 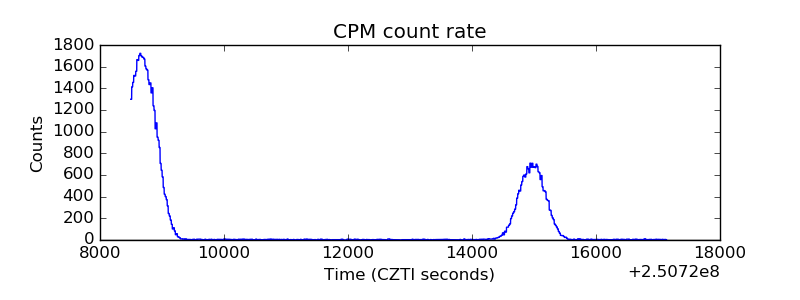 |
| CZT Counter | 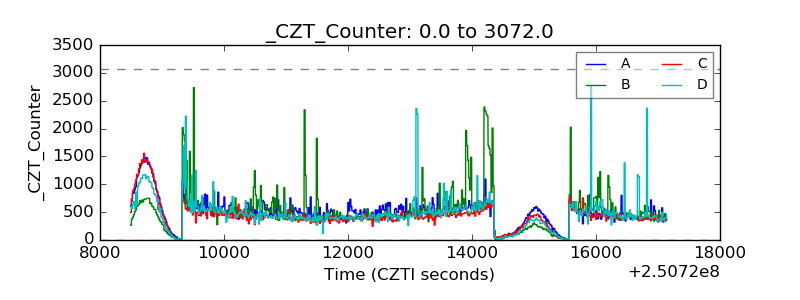 |
| +2.5 Volts monitor |  |
| +5 Volts monitor |  |
| _ROLL_ROT | 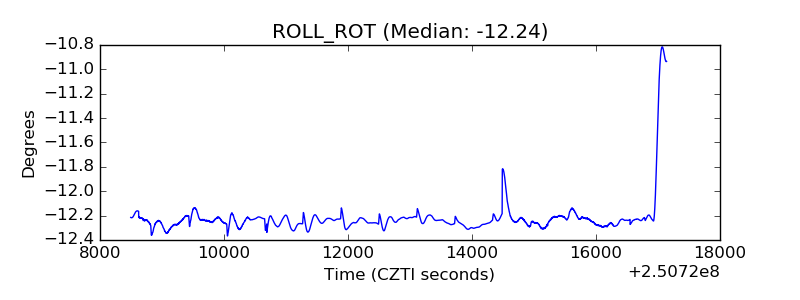 |
| _Roll_DEC | 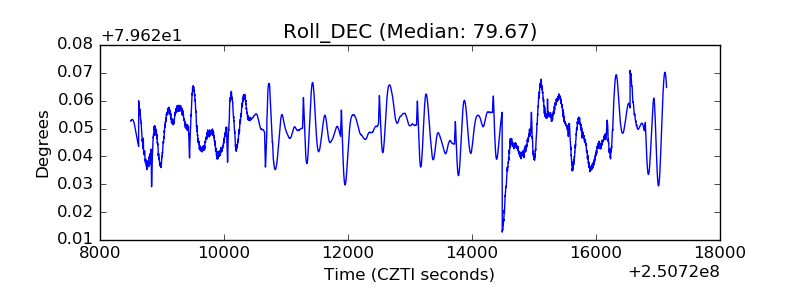 |
| _Roll_RA | 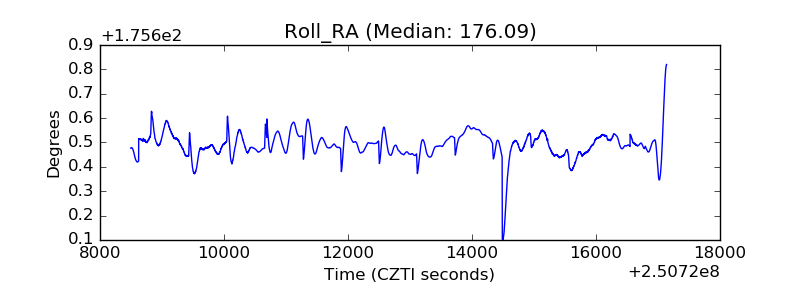 |
| Veto Counter | 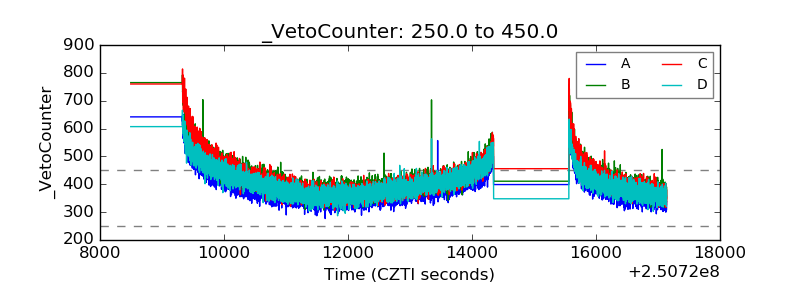 |