| Param | Original file | Final file |
|---|---|---|
| Filename | modeM0/AS1A04_124T01_9000001766_11929cztM0_level2.evt | modeM0/AS1A04_124T01_9000001766_11929cztM0_level2_quad_clean.evt |
| Size (bytes) | 466,384,320 | 128,062,080 |
| Size | 444.8 MB | 122.1 MB |
| Events in quadrant A | 3,282,925 | 863,554 |
| Events in quadrant B | 3,881,093 | 873,115 |
| Events in quadrant C | 2,962,917 | 848,526 |
| Events in quadrant D | 3,528,374 | 812,611 |
| Mode SS | |||
|---|---|---|---|
| Quadrant | BADHDUFLAG | Total packets | Discarded packets |
| A | 0 | 140 | 0 |
| B | 0 | 140 | 0 |
| C | 0 | 140 | 0 |
| D | 0 | 140 | 0 |
| Mode M9 | |||
|---|---|---|---|
| Quadrant | BADHDUFLAG | Total packets | Discarded packets |
| A | 0 | 20 | 0 |
| B | 0 | 20 | 0 |
| C | 0 | 20 | 0 |
| D | 0 | 20 | 0 |
| Mode M0 | |||
|---|---|---|---|
| Quadrant | BADHDUFLAG | Total packets | Discarded packets |
| A | 0 | 14620 | 3 |
| B | 0 | 16333 | 2 |
| C | 0 | 14053 | 2 |
| D | 0 | 15330 | 2 |
| Quadrant | Total seconds | Saturated seconds | Saturation percentage |
|---|---|---|---|
| A | 6904 | 33 | 0.477984% |
| B | 6904 | 169 | 2.447856% |
| C | 6904 | 14 | 0.202781% |
| D | 6904 | 51 | 0.738702% |
Noise dominated data is calculated using 1-second bins in cleaned event files. If a bin has >2000 counts, and if more than 50% of those come from <1% of pixels, then it is considered to be noise-dominated and hence unusable.
| Quadrant | # 1 sec bins | Bins with >0 counts | Bins with >2000 counts | High rate bins dominated by noise | Noise dominated (total time) | Noise dominated (detector-on time) | Marked lightcurve |
|---|---|---|---|---|---|---|---|
| A | 7780 | 6906 | 5 | 5 | 0.06% | 0.07% | 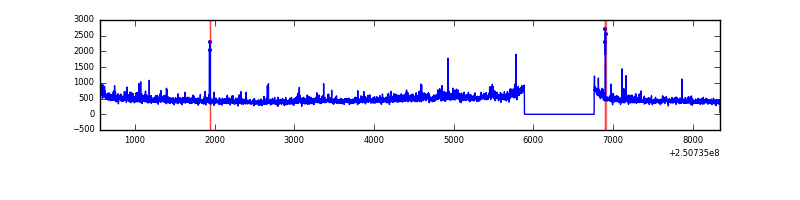 |
| B | 7780 | 6906 | 80 | 80 | 1.03% | 1.16% | 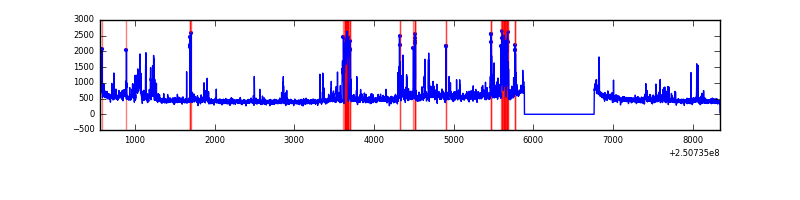 |
| C | 7780 | 6906 | 0 | 0 | 0.00% | 0.00% | 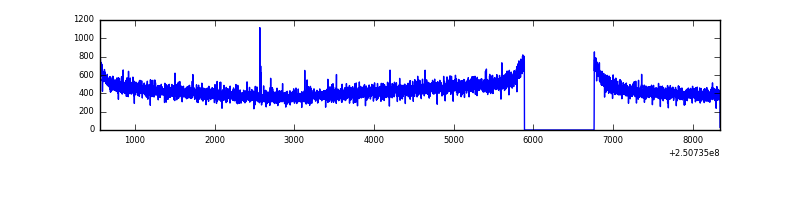 |
| D | 7780 | 6906 | 39 | 39 | 0.50% | 0.56% | 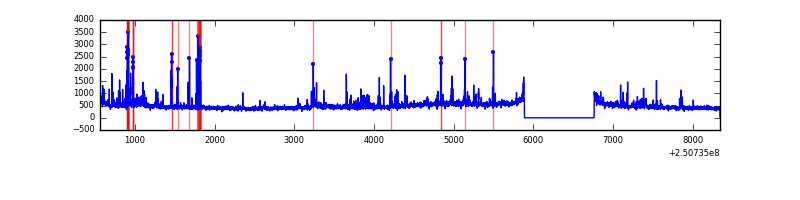 |
Top three noisy pixels from each quadrant. If the there are fewer than three noisy pixels in the level2.evt file, extra rows are filled as -1
| Pixel properties | Quadrant properties | ||||||
|---|---|---|---|---|---|---|---|
| Quadrant | DetID | PixID | Counts | Sigma | Mean | Median | Sigma |
| A | 1 | 162 | 81760 | 513.68 | 784 | 769 | 157.7 |
| A | 1 | 178 | 36608 | 227.31 | 784 | 769 | 157.7 |
| A | 1 | 161 | 31907 | 197.49 | 784 | 769 | 157.7 |
| B | 4 | 239 | 275267 | 1838.38 | 789 | 769 | 149.3 |
| B | 0 | 85 | 168032 | 1120.2 | 789 | 769 | 149.3 |
| B | 3 | 64 | 111321 | 740.4 | 789 | 769 | 149.3 |
| C | 13 | 61 | 5654 | 28.09 | 759 | 761 | 174.2 |
| C | 12 | 4 | 2769 | 11.53 | 759 | 761 | 174.2 |
| C | 14 | 234 | 2086 | 7.61 | 759 | 761 | 174.2 |
| D | 8 | 195 | 274176 | 1535.03 | 750 | 729 | 178.1 |
| D | 1 | 52 | 209317 | 1170.93 | 750 | 729 | 178.1 |
| D | 13 | 104 | 49538 | 274.0 | 750 | 729 | 178.1 |
Histogram calculated using DETX and DETY for each event in the final _common_clean file
| Quadrant A | 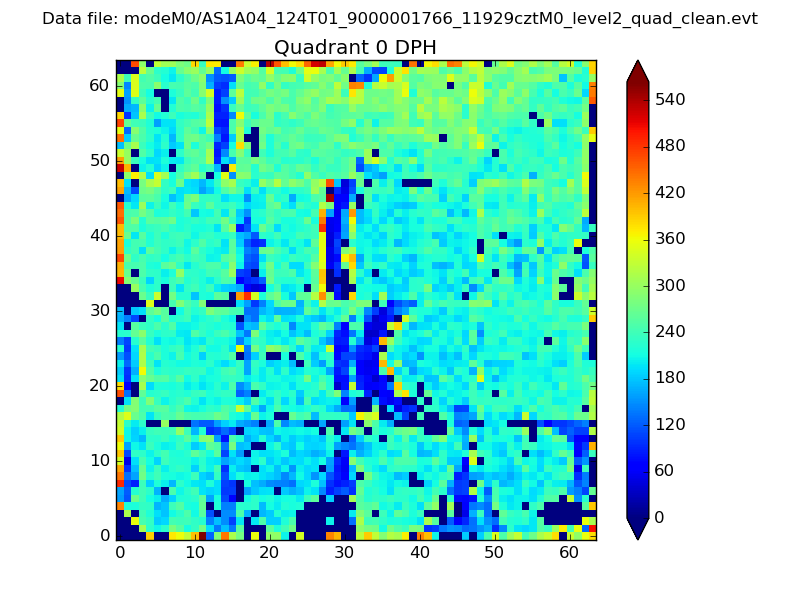 |
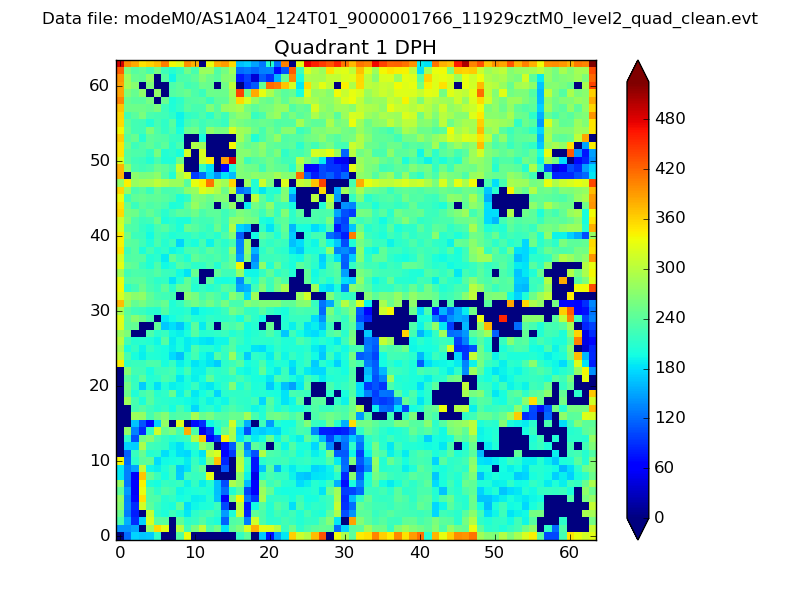 |
Quadrant B |
|---|---|---|---|
| Quadrant D | 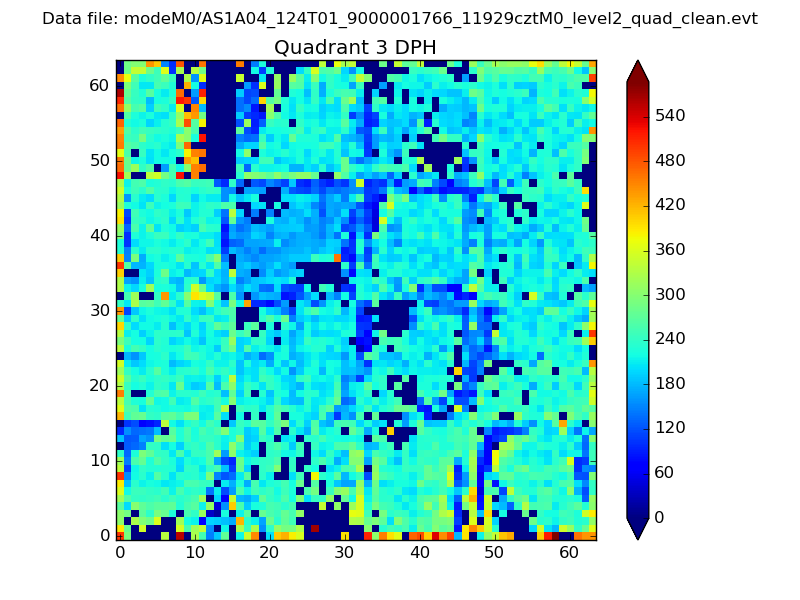 |
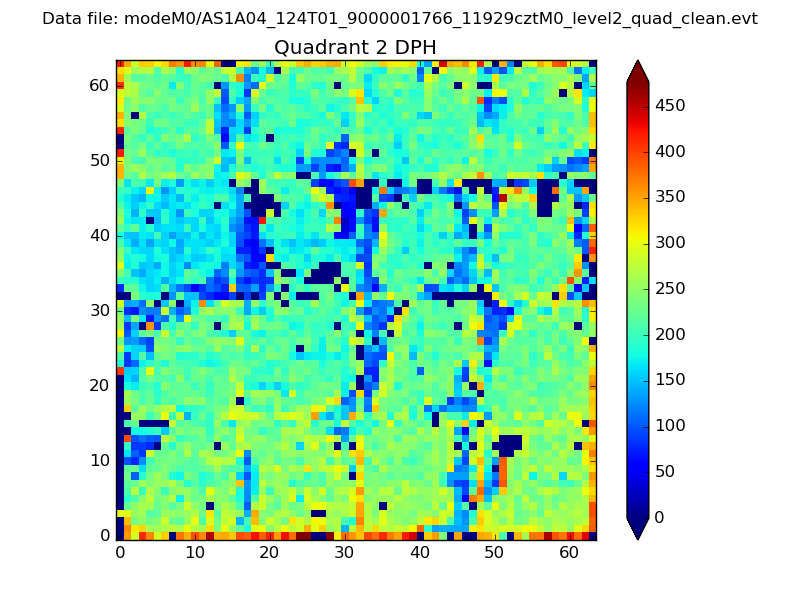 |
Quadrant C |
| Plot type | Count rate plots | Images |
|---|---|---|
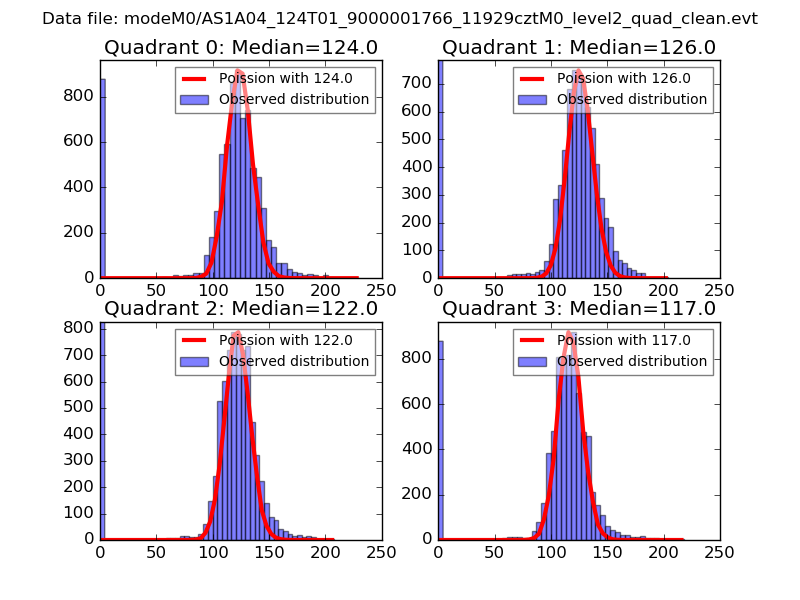
| Comparison with Poisson distribution Blue bars denote a histogram of data divided into 1 sec bins. Red curve is a Poisson curve with rate = median count rate of data. |
 |
 |
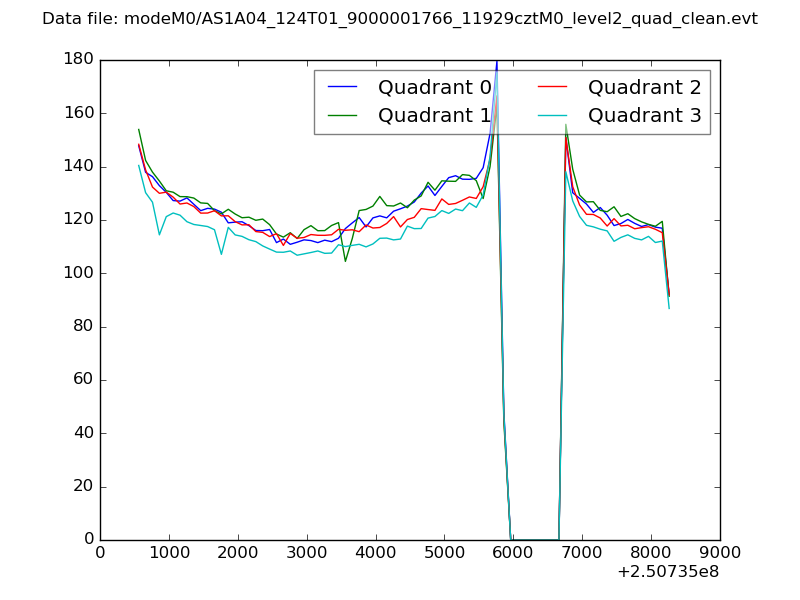
| Quadrant-wise count rates Data is divided into 100 sec bins |
 |
|
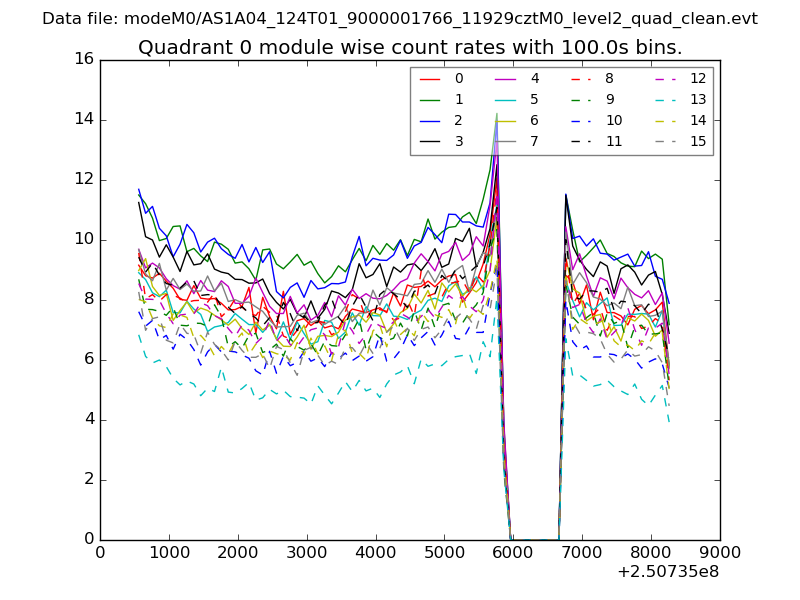
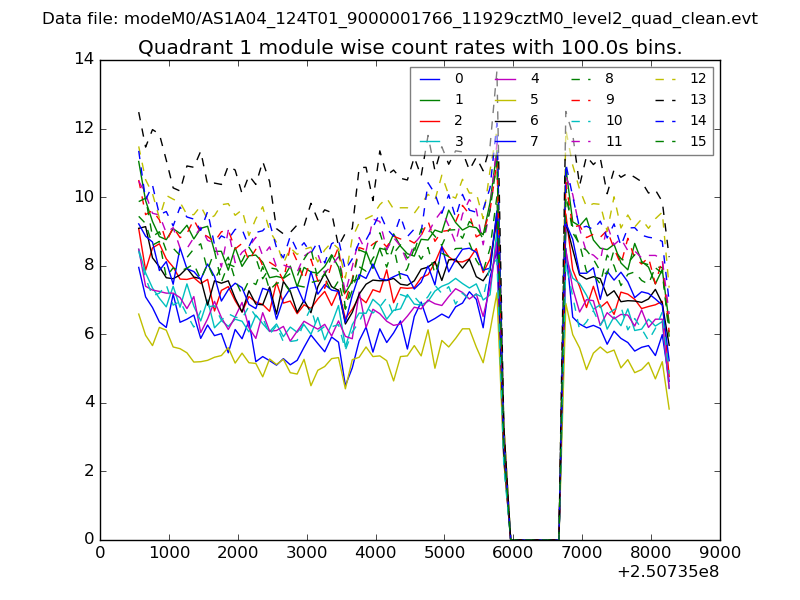
| Module-wise count rates for Quadrant A Data is divided into 100 sec bins |
 |
 |
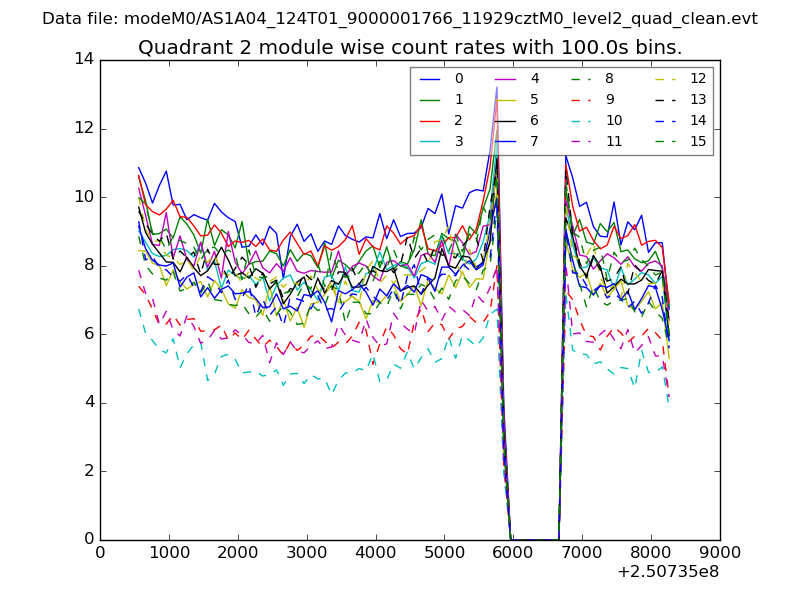
| Module-wise count rates for Quadrant B Data is divided into 100 sec bins |
 |
 |
| Module-wise count rates for Quadrant C Data is divided into 100 sec bins |
 |
 |
| Module-wise count rates for Quadrant D Data is divided into 100 sec bins |
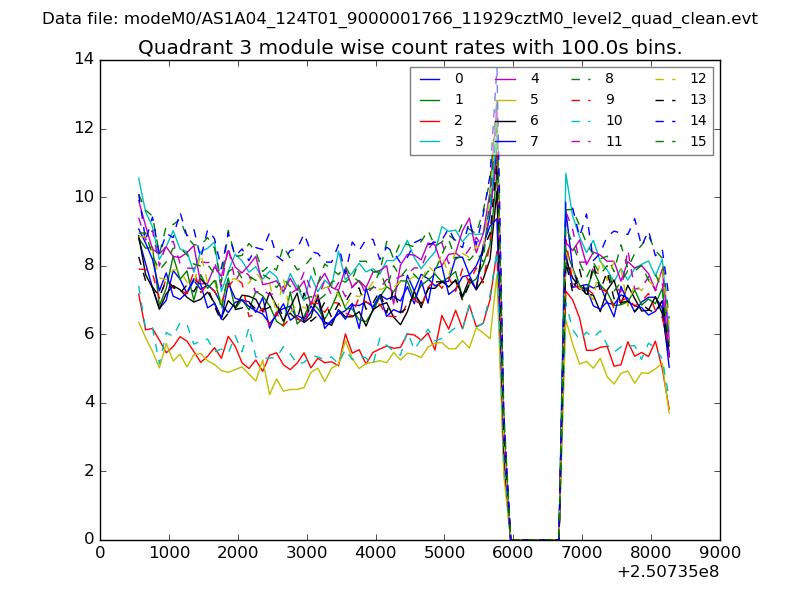 |
 |
| Parameter | Plot |
|---|---|
| CZT HV Monitor | 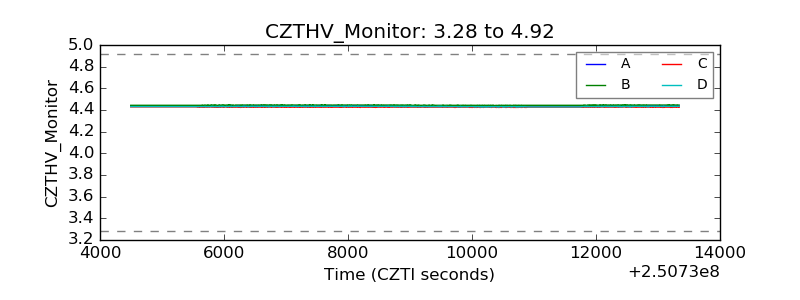 |
| D_VDD | 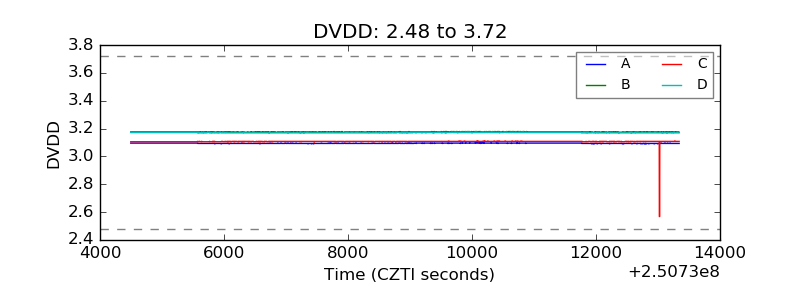 |
| Temperature 1 | 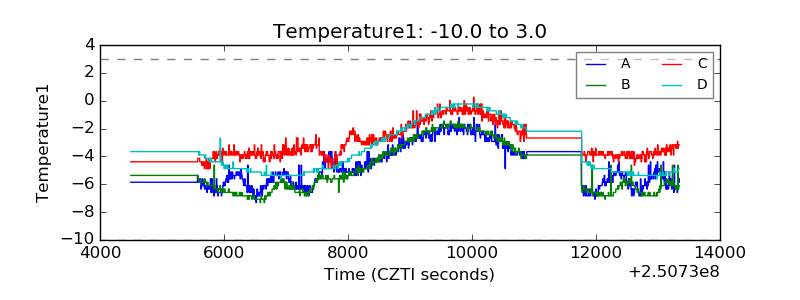 |
| Veto HV Monitor | 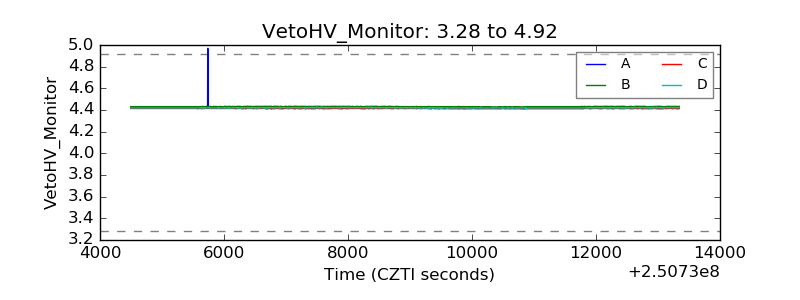 |
| Veto LLD | 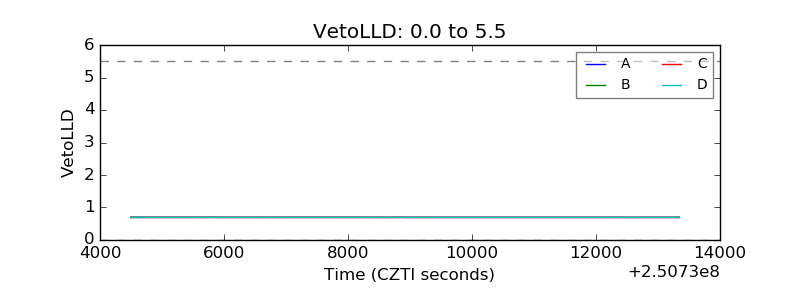 |
| Alpha Counter | 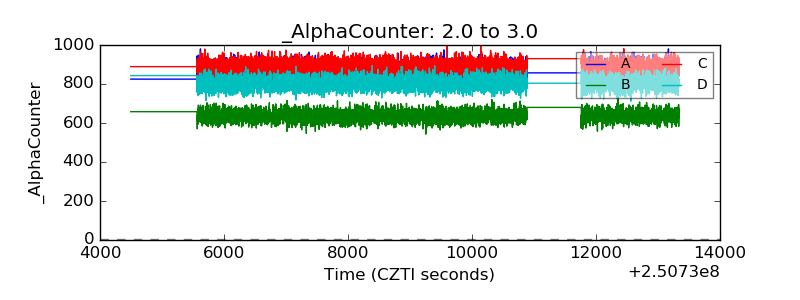 |
| _CPM_Rate | 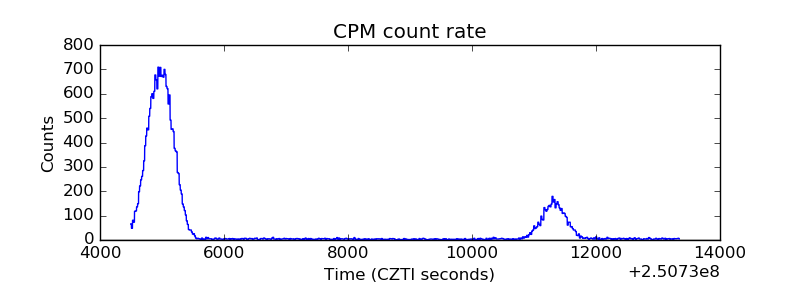 |
| CZT Counter | 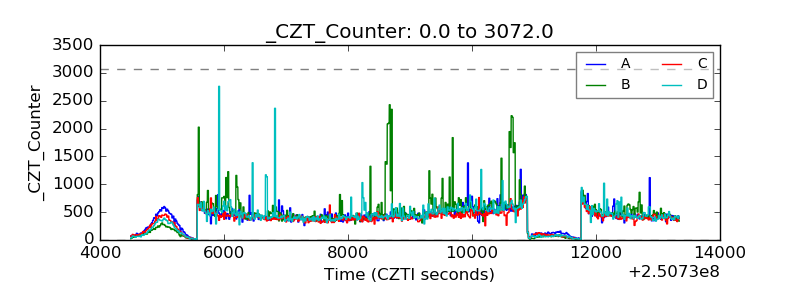 |
| +2.5 Volts monitor |  |
| +5 Volts monitor |  |
| _ROLL_ROT | 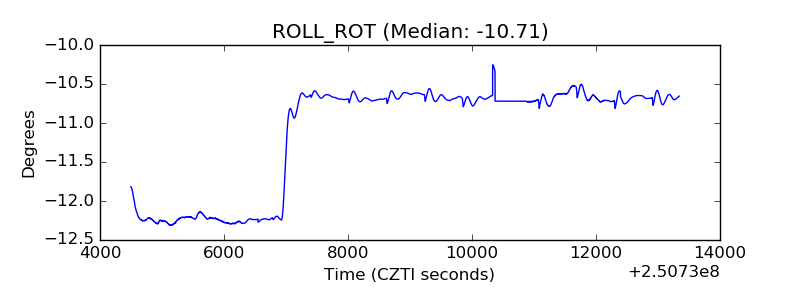 |
| _Roll_DEC | 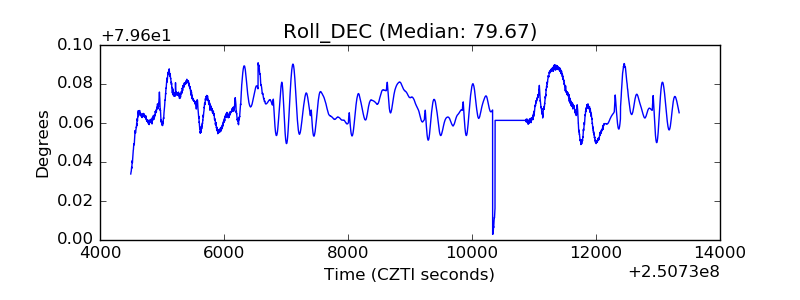 |
| _Roll_RA | 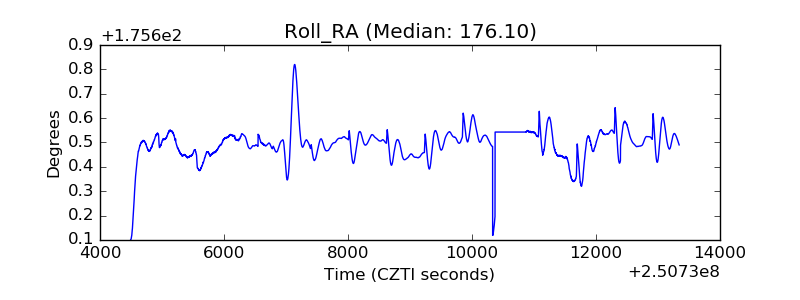 |
| Veto Counter | 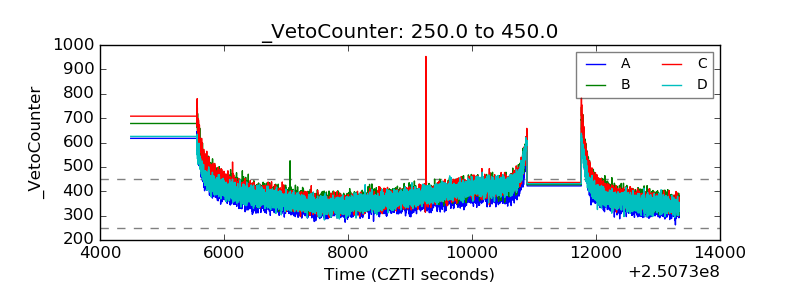 |