| Param | Original file | Final file |
|---|---|---|
| Filename | modeM0/AS1A04_124T01_9000001766_11930cztM0_level2.evt | modeM0/AS1A04_124T01_9000001766_11930cztM0_level2_quad_clean.evt |
| Size (bytes) | 491,054,400 | 133,499,520 |
| Size | 468.3 MB | 127.3 MB |
| Events in quadrant A | 3,502,886 | 895,701 |
| Events in quadrant B | 4,035,627 | 904,601 |
| Events in quadrant C | 3,161,922 | 883,886 |
| Events in quadrant D | 3,671,037 | 846,993 |
| Mode SS | |||
|---|---|---|---|
| Quadrant | BADHDUFLAG | Total packets | Discarded packets |
| A | 0 | 150 | 0 |
| B | 0 | 150 | 0 |
| C | 0 | 150 | 0 |
| D | 0 | 150 | 0 |
| Mode M9 | |||
|---|---|---|---|
| Quadrant | BADHDUFLAG | Total packets | Discarded packets |
| A | 0 | 14 | 0 |
| B | 0 | 14 | 0 |
| C | 0 | 14 | 0 |
| D | 0 | 14 | 0 |
| Mode M0 | |||
|---|---|---|---|
| Quadrant | BADHDUFLAG | Total packets | Discarded packets |
| A | 0 | 15542 | 3 |
| B | 0 | 17101 | 2 |
| C | 0 | 15018 | 2 |
| D | 0 | 16153 | 2 |
| Quadrant | Total seconds | Saturated seconds | Saturation percentage |
|---|---|---|---|
| A | 7364 | 73 | 0.991309% |
| B | 7364 | 245 | 3.326996% |
| C | 7364 | 19 | 0.258012% |
| D | 7364 | 60 | 0.814775% |
Noise dominated data is calculated using 1-second bins in cleaned event files. If a bin has >2000 counts, and if more than 50% of those come from <1% of pixels, then it is considered to be noise-dominated and hence unusable.
| Quadrant | # 1 sec bins | Bins with >0 counts | Bins with >2000 counts | High rate bins dominated by noise | Noise dominated (total time) | Noise dominated (detector-on time) | Marked lightcurve |
|---|---|---|---|---|---|---|---|
| A | 8715 | 7367 | 8 | 8 | 0.09% | 0.11% |  |
| B | 8715 | 7367 | 93 | 93 | 1.07% | 1.26% | 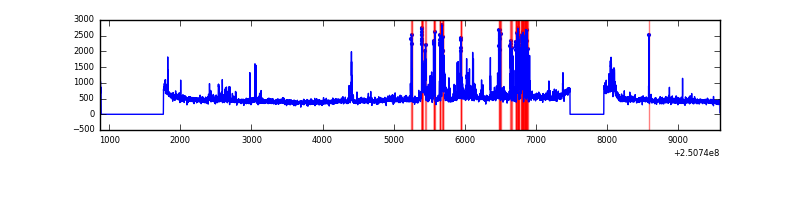 |
| C | 8715 | 7367 | 0 | 0 | 0.00% | 0.00% | 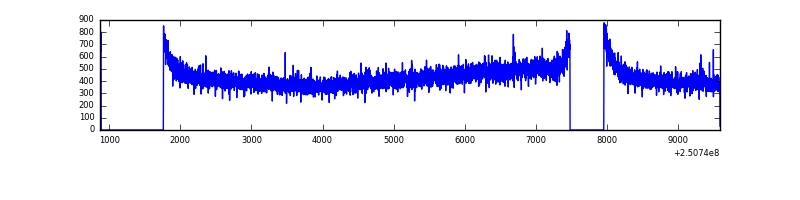 |
| D | 8715 | 7367 | 35 | 35 | 0.40% | 0.48% | 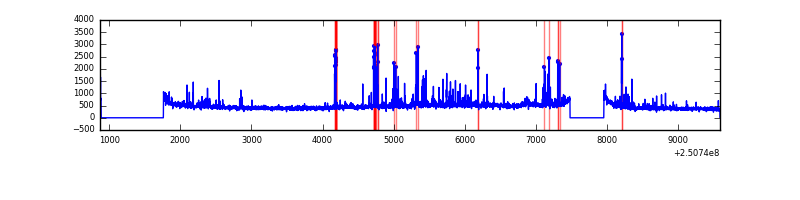 |
Top three noisy pixels from each quadrant. If the there are fewer than three noisy pixels in the level2.evt file, extra rows are filled as -1
| Pixel properties | Quadrant properties | ||||||
|---|---|---|---|---|---|---|---|
| Quadrant | DetID | PixID | Counts | Sigma | Mean | Median | Sigma |
| A | 1 | 162 | 75408 | 436.86 | 838 | 818 | 170.7 |
| A | 8 | 15 | 52714 | 303.94 | 838 | 818 | 170.7 |
| A | 1 | 178 | 33847 | 193.44 | 838 | 818 | 170.7 |
| B | 4 | 239 | 542254 | 3397.67 | 841 | 822 | 159.4 |
| B | 15 | 204 | 83947 | 521.64 | 841 | 822 | 159.4 |
| B | 3 | 64 | 42695 | 262.77 | 841 | 822 | 159.4 |
| C | 13 | 61 | 6005 | 27.72 | 810 | 811 | 187.4 |
| C | 14 | 234 | 3132 | 12.39 | 810 | 811 | 187.4 |
| C | 12 | 4 | 2072 | 6.73 | 810 | 811 | 187.4 |
| D | 8 | 195 | 240396 | 1262.97 | 803 | 777 | 189.7 |
| D | 1 | 52 | 111510 | 583.65 | 803 | 777 | 189.7 |
| D | 13 | 104 | 64819 | 337.55 | 803 | 777 | 189.7 |
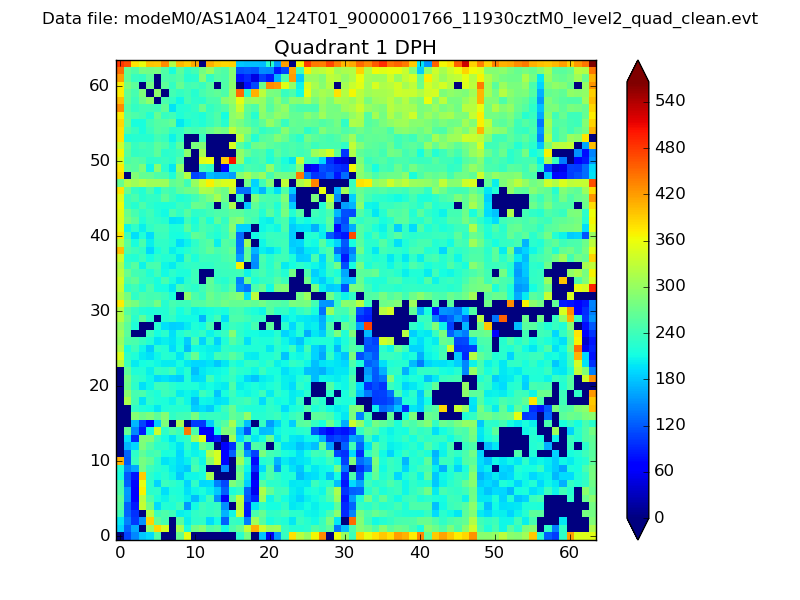
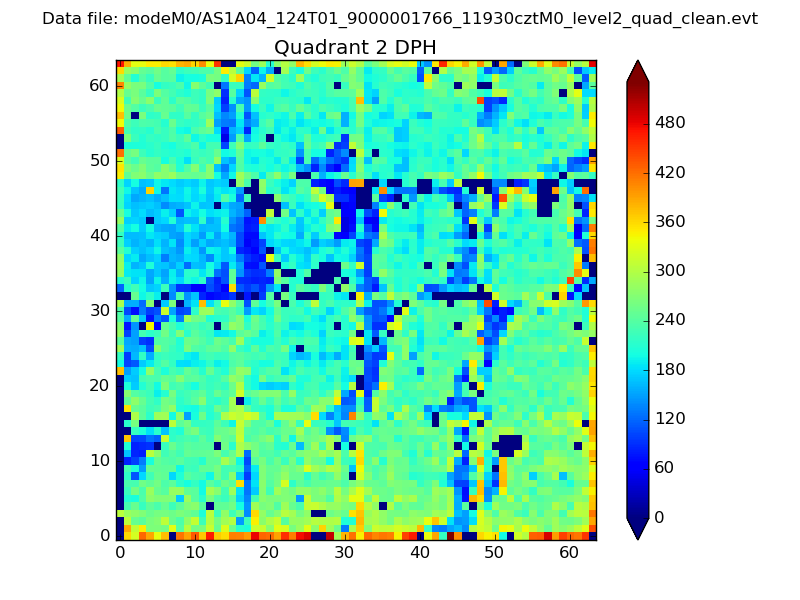
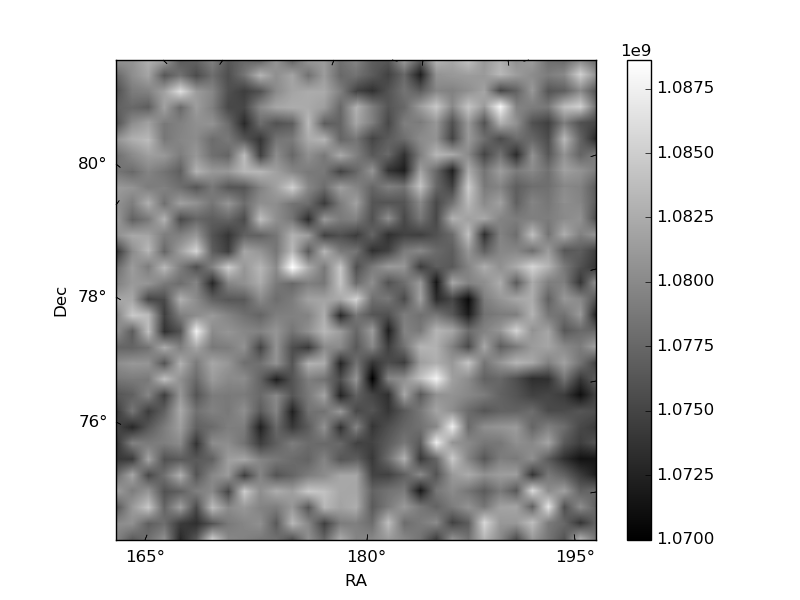
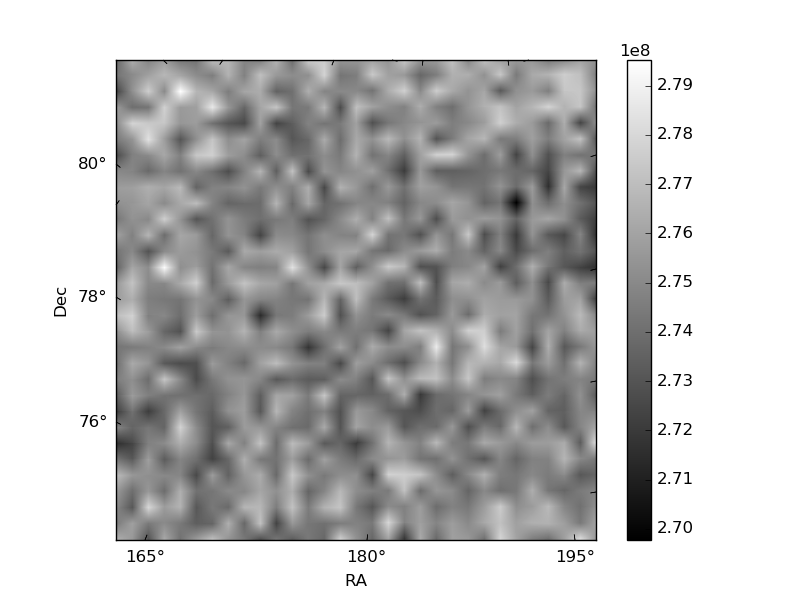
Histogram calculated using DETX and DETY for each event in the final _common_clean file
| Quadrant A | 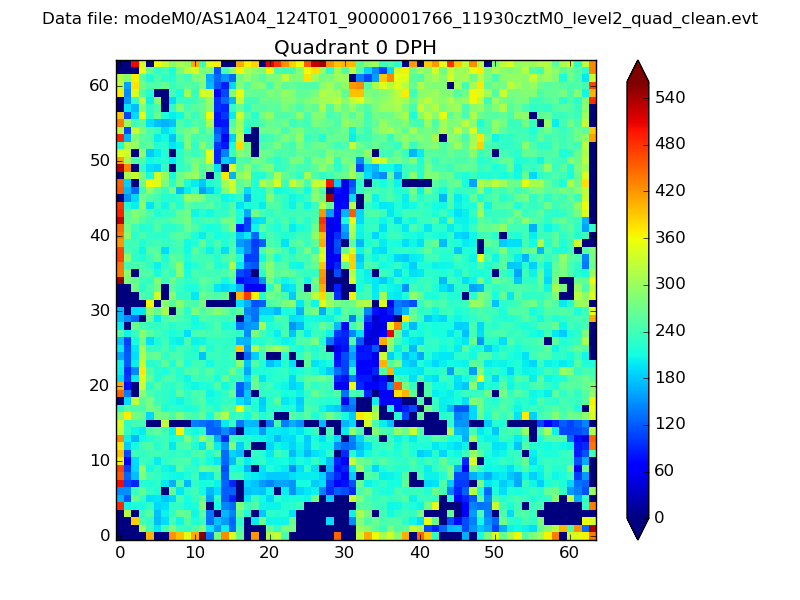 |
 |
Quadrant B |
|---|---|---|---|
| Quadrant D | 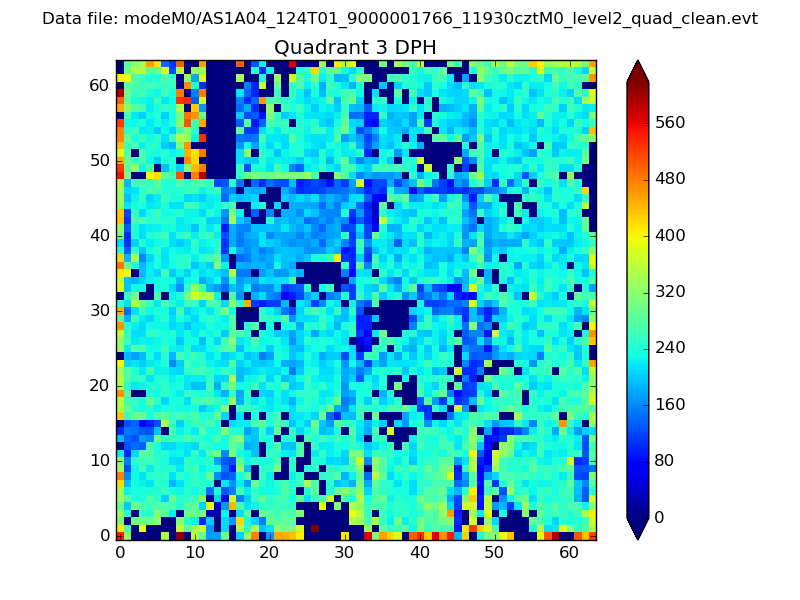 |
 |
Quadrant C |
| Plot type | Count rate plots | Images |
|---|---|---|
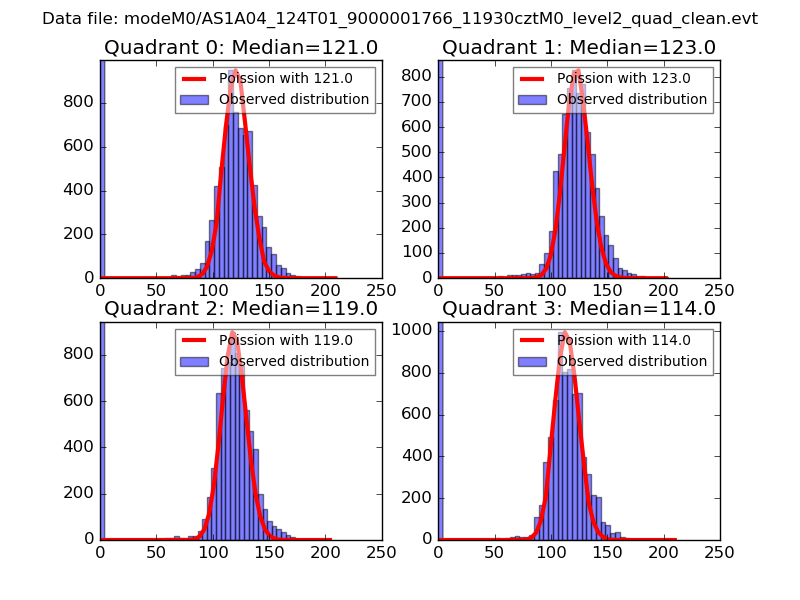
| Comparison with Poisson distribution Blue bars denote a histogram of data divided into 1 sec bins. Red curve is a Poisson curve with rate = median count rate of data. |
 |
 |
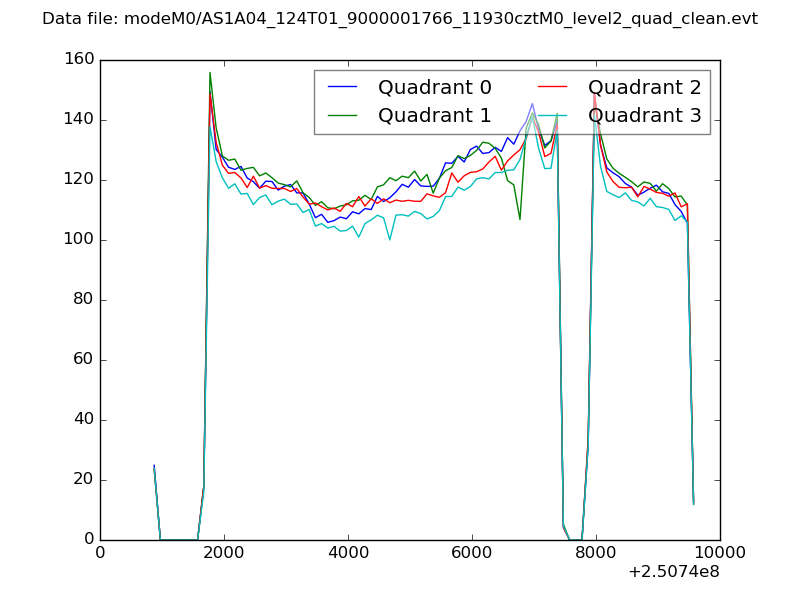
| Quadrant-wise count rates Data is divided into 100 sec bins |
 |
|
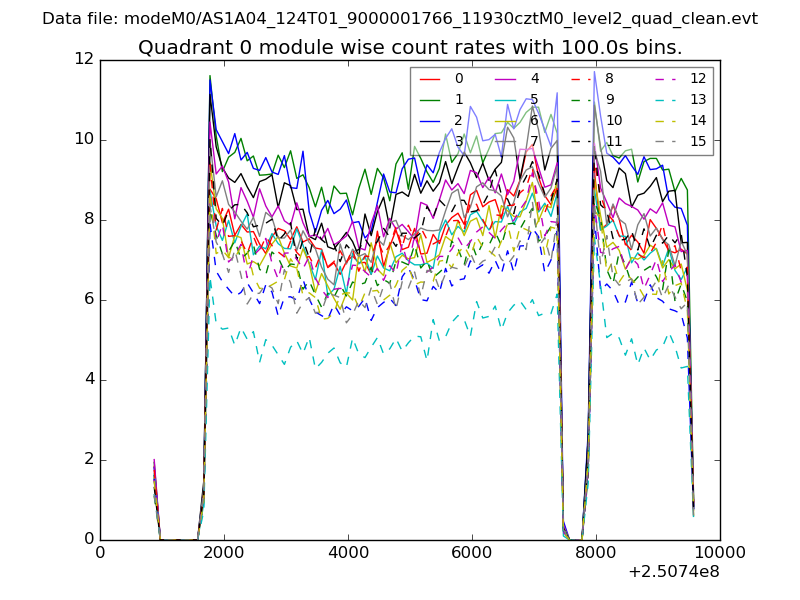
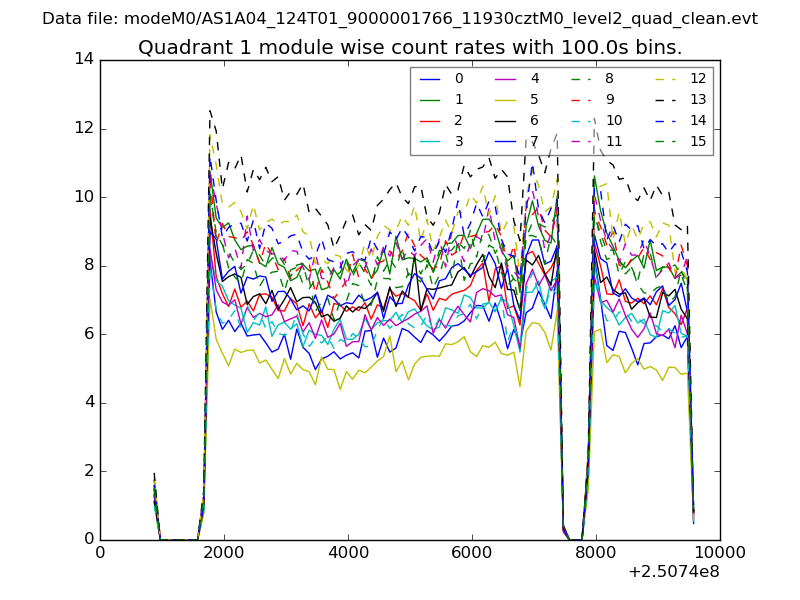
| Module-wise count rates for Quadrant A Data is divided into 100 sec bins |
 |
 |
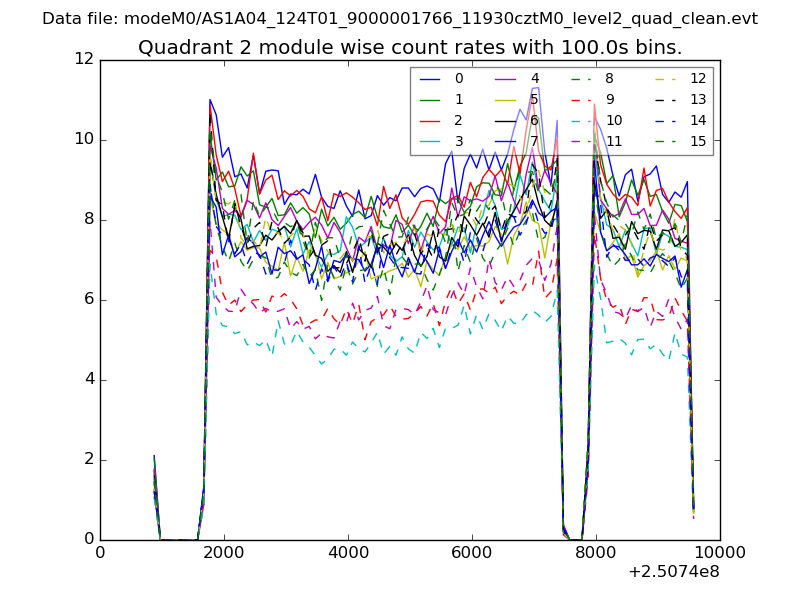
| Module-wise count rates for Quadrant B Data is divided into 100 sec bins |
 |
 |
| Module-wise count rates for Quadrant C Data is divided into 100 sec bins |
 |
 |
| Module-wise count rates for Quadrant D Data is divided into 100 sec bins |
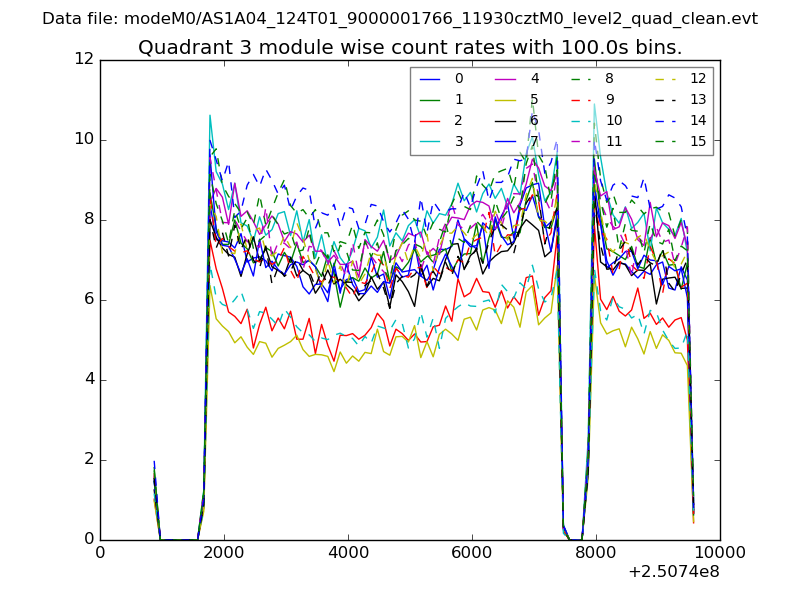 |
 |
| Parameter | Plot |
|---|---|
| CZT HV Monitor | 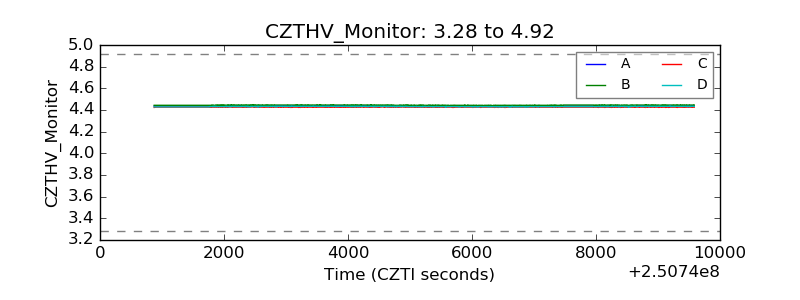 |
| D_VDD | 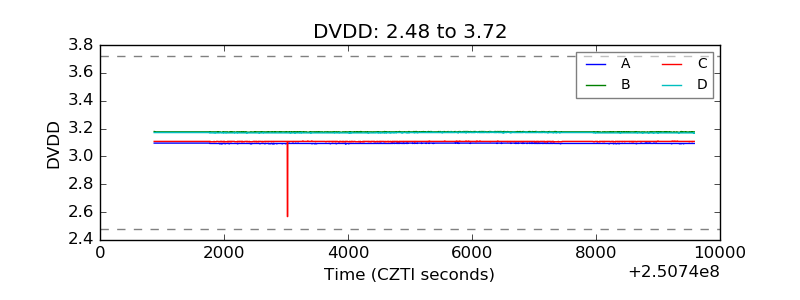 |
| Temperature 1 | 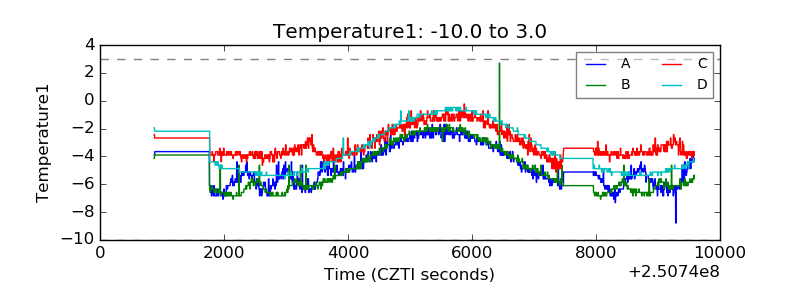 |
| Veto HV Monitor | 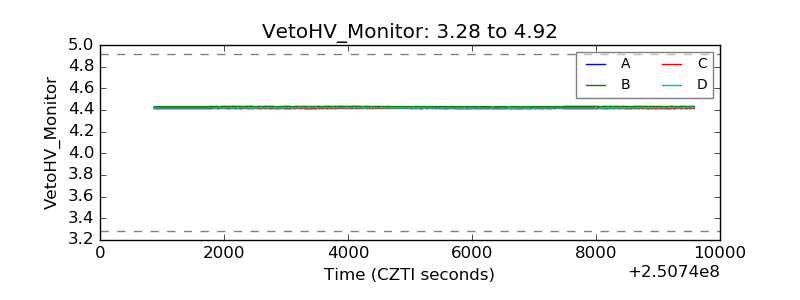 |
| Veto LLD | 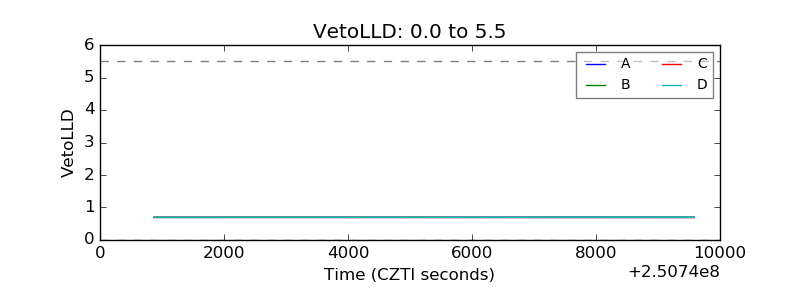 |
| Alpha Counter | 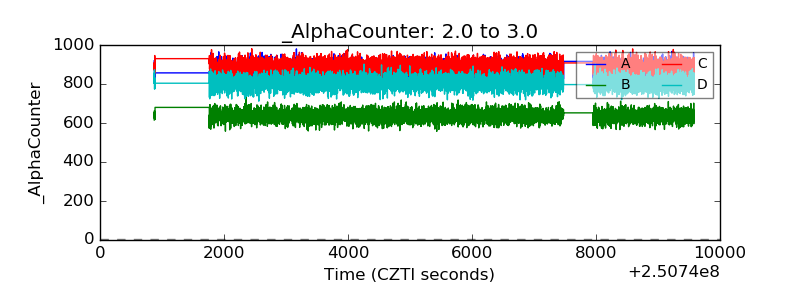 |
| _CPM_Rate | 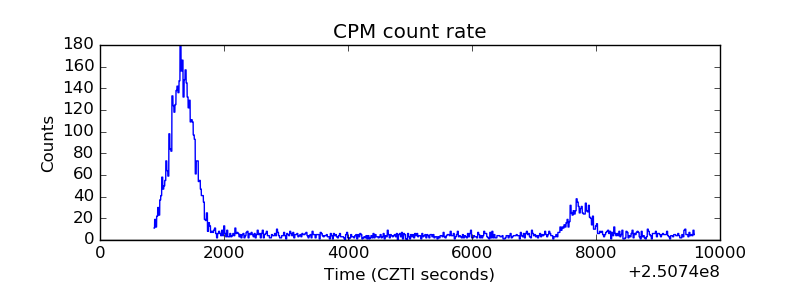 |
| CZT Counter | 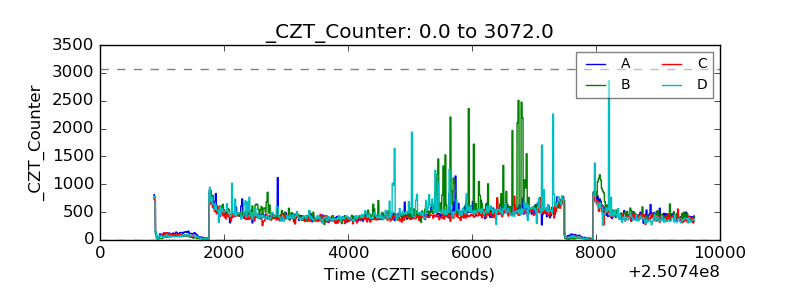 |
| +2.5 Volts monitor |  |
| +5 Volts monitor |  |
| _ROLL_ROT | 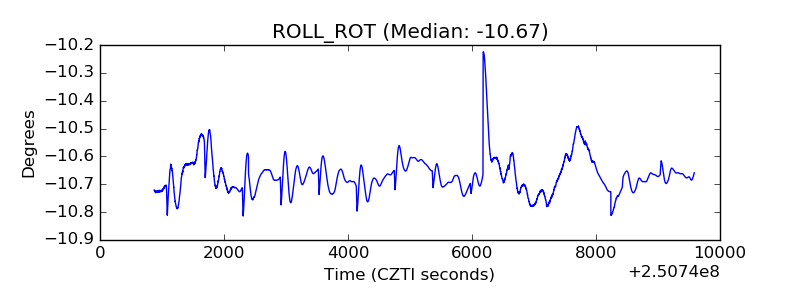 |
| _Roll_DEC | 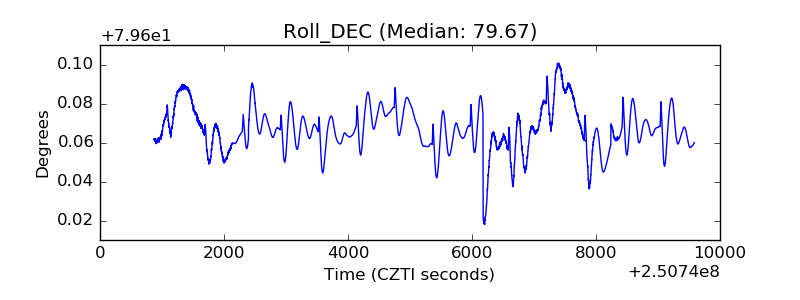 |
| _Roll_RA | 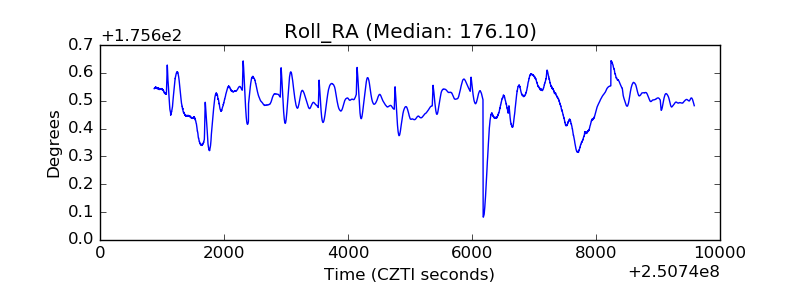 |
| Veto Counter | 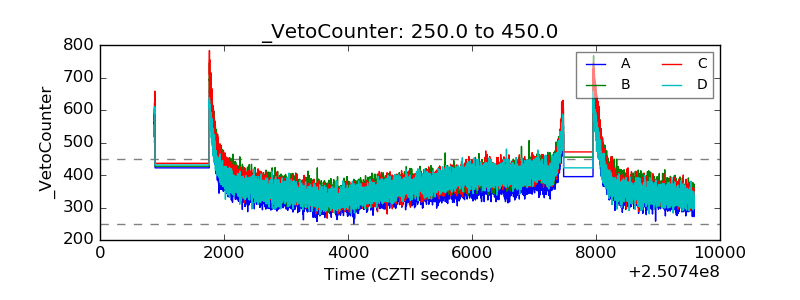 |