| Param | Original file | Final file |
|---|---|---|
| Filename | modeM0/AS1A04_124T01_9000001766_11931cztM0_level2.evt | modeM0/AS1A04_124T01_9000001766_11931cztM0_level2_quad_clean.evt |
| Size (bytes) | 566,415,360 | 139,976,640 |
| Size | 540.2 MB | 133.5 MB |
| Events in quadrant A | 3,925,069 | 940,655 |
| Events in quadrant B | 4,558,690 | 948,376 |
| Events in quadrant C | 3,444,080 | 930,561 |
| Events in quadrant D | 4,695,607 | 876,469 |
| Mode SS | |||
|---|---|---|---|
| Quadrant | BADHDUFLAG | Total packets | Discarded packets |
| A | 0 | 158 | 0 |
| B | 0 | 158 | 0 |
| C | 0 | 158 | 0 |
| D | 0 | 158 | 0 |
| Mode M9 | |||
|---|---|---|---|
| Quadrant | BADHDUFLAG | Total packets | Discarded packets |
| A | 0 | 5 | 0 |
| B | 0 | 5 | 0 |
| C | 0 | 5 | 0 |
| D | 0 | 5 | 0 |
| Mode M0 | |||
|---|---|---|---|
| Quadrant | BADHDUFLAG | Total packets | Discarded packets |
| A | 0 | 16894 | 3 |
| B | 0 | 18858 | 2 |
| C | 0 | 16126 | 2 |
| D | 0 | 19624 | 2 |
| Quadrant | Total seconds | Saturated seconds | Saturation percentage |
|---|---|---|---|
| A | 7815 | 236 | 3.019834% |
| B | 7815 | 478 | 6.116443% |
| C | 7815 | 68 | 0.870122% |
| D | 7815 | 410 | 5.246321% |
Noise dominated data is calculated using 1-second bins in cleaned event files. If a bin has >2000 counts, and if more than 50% of those come from <1% of pixels, then it is considered to be noise-dominated and hence unusable.
| Quadrant | # 1 sec bins | Bins with >0 counts | Bins with >2000 counts | High rate bins dominated by noise | Noise dominated (total time) | Noise dominated (detector-on time) | Marked lightcurve |
|---|---|---|---|---|---|---|---|
| A | 7876 | 7816 | 3 | 3 | 0.04% | 0.04% | 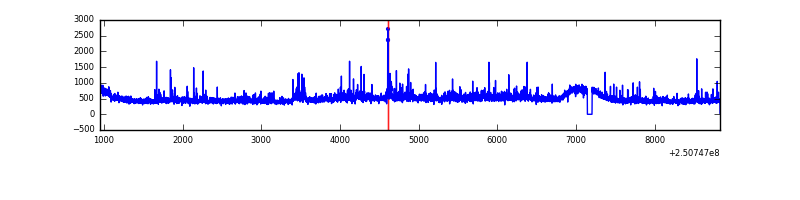 |
| B | 7876 | 7816 | 137 | 137 | 1.74% | 1.75% | 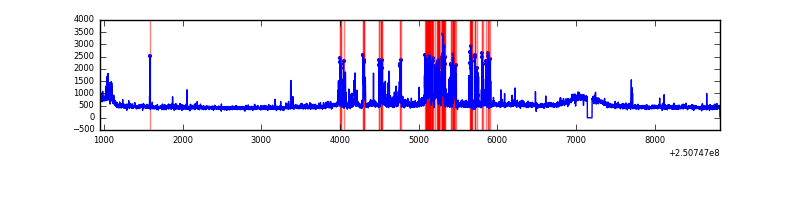 |
| C | 7876 | 7817 | 2 | 2 | 0.03% | 0.03% | 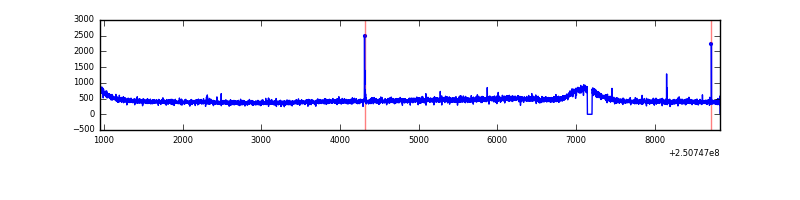 |
| D | 7876 | 7817 | 270 | 270 | 3.43% | 3.45% | 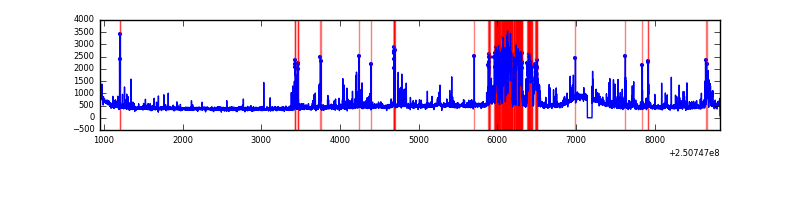 |
Top three noisy pixels from each quadrant. If the there are fewer than three noisy pixels in the level2.evt file, extra rows are filled as -1
| Pixel properties | Quadrant properties | ||||||
|---|---|---|---|---|---|---|---|
| Quadrant | DetID | PixID | Counts | Sigma | Mean | Median | Sigma |
| A | 1 | 162 | 117186 | 621.6 | 908 | 886 | 187.1 |
| A | 8 | 15 | 99513 | 527.15 | 908 | 886 | 187.1 |
| A | 1 | 178 | 59970 | 315.79 | 908 | 886 | 187.1 |
| B | 4 | 239 | 674650 | 3855.45 | 906 | 881 | 174.8 |
| B | 15 | 204 | 194060 | 1105.41 | 906 | 881 | 174.8 |
| B | 3 | 64 | 38805 | 217.01 | 906 | 881 | 174.8 |
| C | 4 | 112 | 9392 | 41.77 | 878 | 878 | 203.8 |
| C | 13 | 61 | 6476 | 27.46 | 878 | 878 | 203.8 |
| C | 14 | 234 | 5195 | 21.18 | 878 | 878 | 203.8 |
| D | 13 | 122 | 793255 | 3885.49 | 858 | 829 | 203.9 |
| D | 1 | 52 | 181635 | 886.54 | 858 | 829 | 203.9 |
| D | 8 | 195 | 178857 | 872.92 | 858 | 829 | 203.9 |
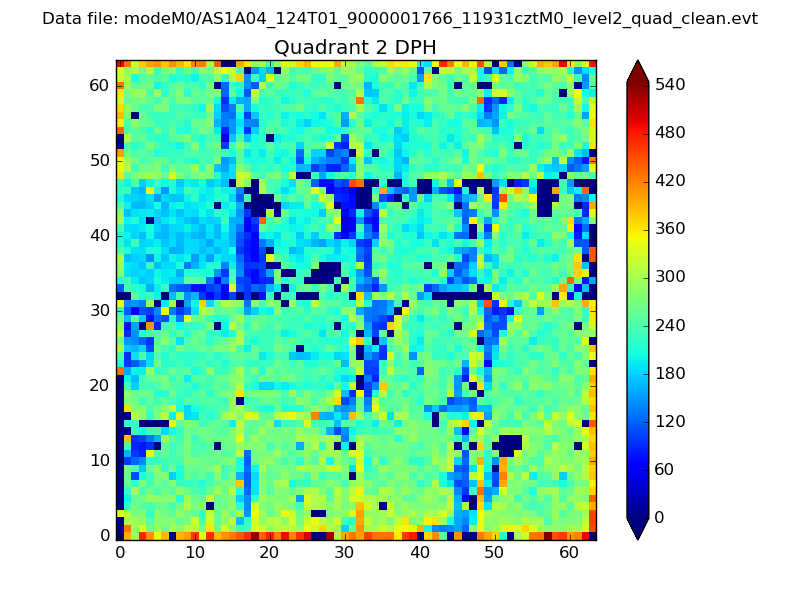
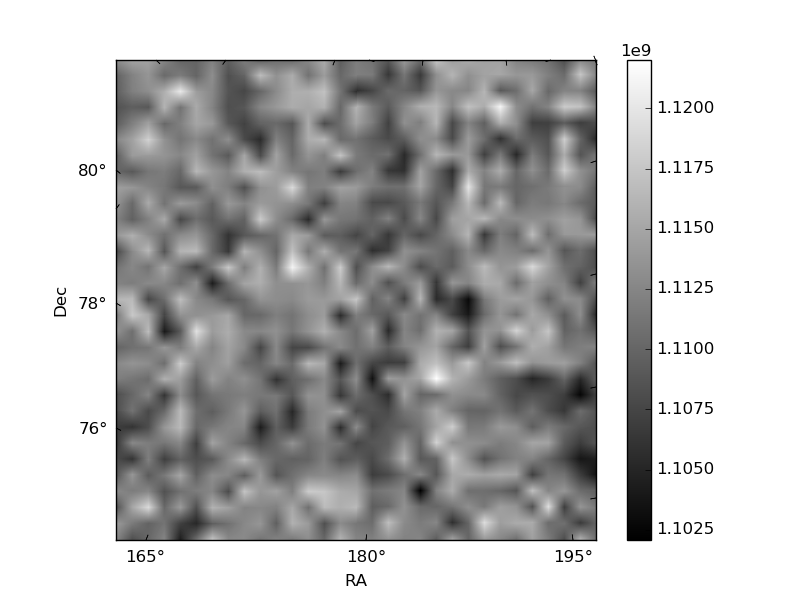
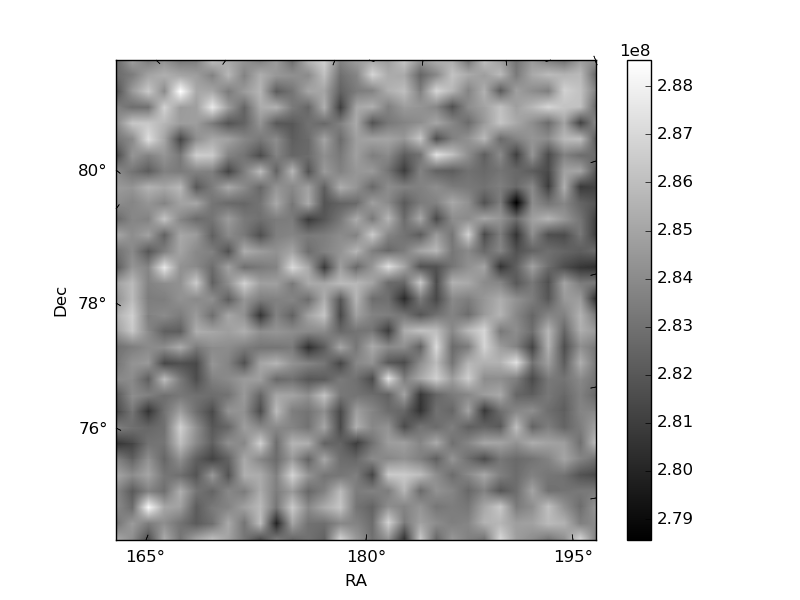
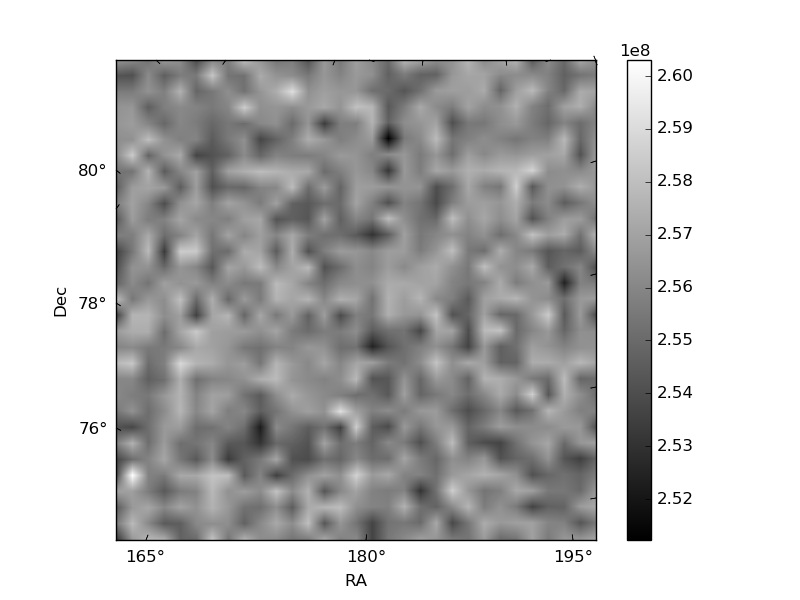
Histogram calculated using DETX and DETY for each event in the final _common_clean file
| Quadrant A | 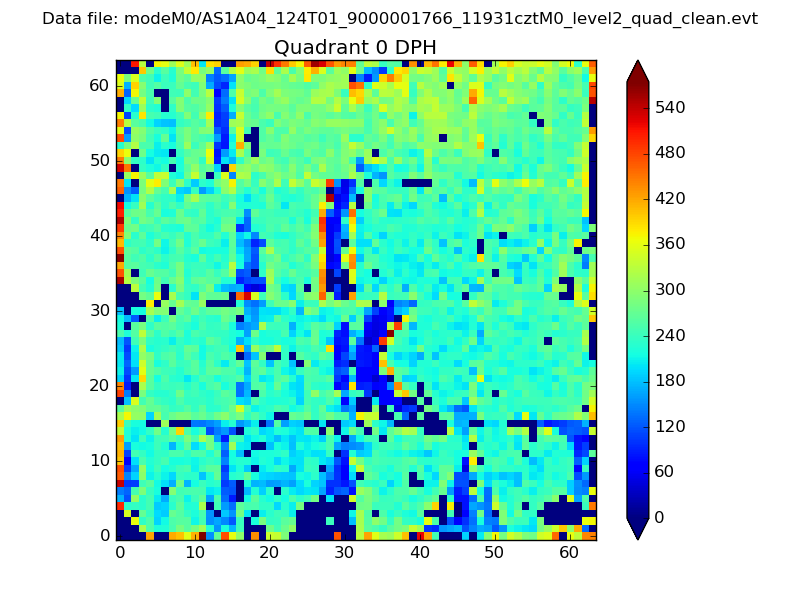 |
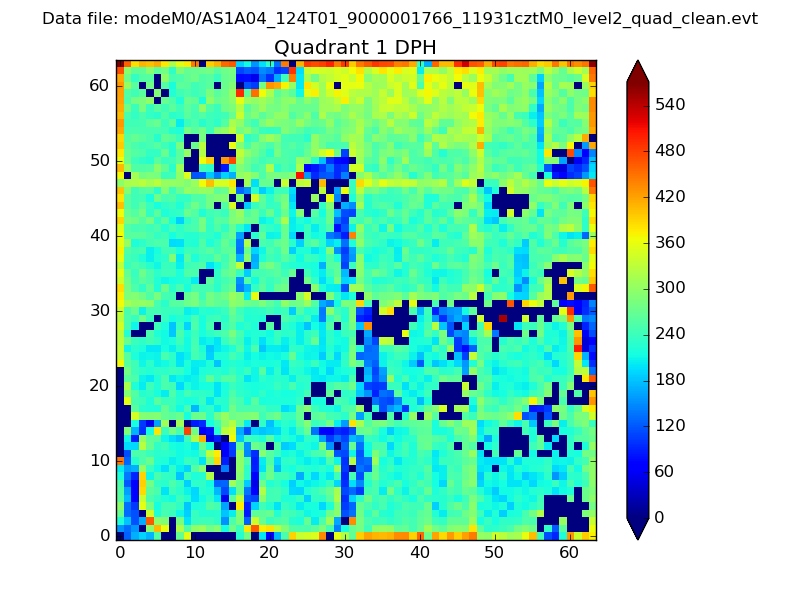 |
Quadrant B |
|---|---|---|---|
| Quadrant D | 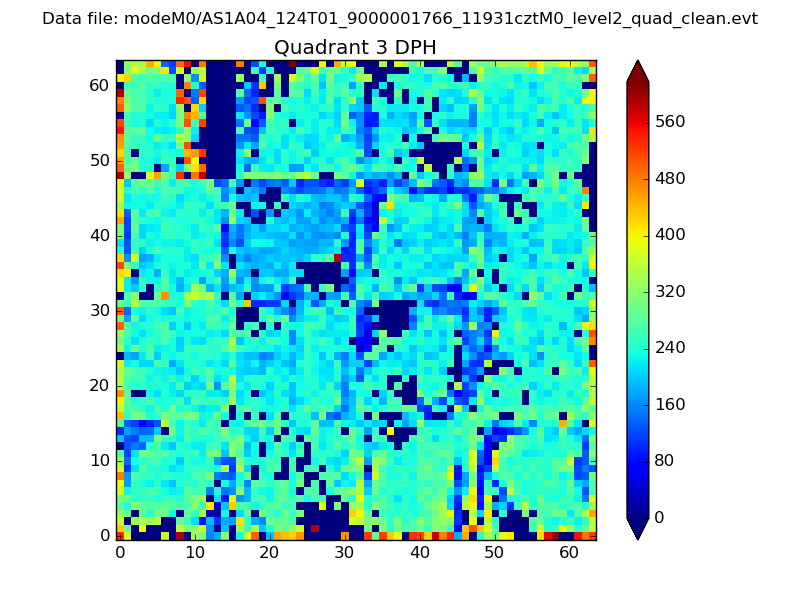 |
 |
Quadrant C |
| Plot type | Count rate plots | Images |
|---|---|---|
| Comparison with Poisson distribution Blue bars denote a histogram of data divided into 1 sec bins. Red curve is a Poisson curve with rate = median count rate of data. |
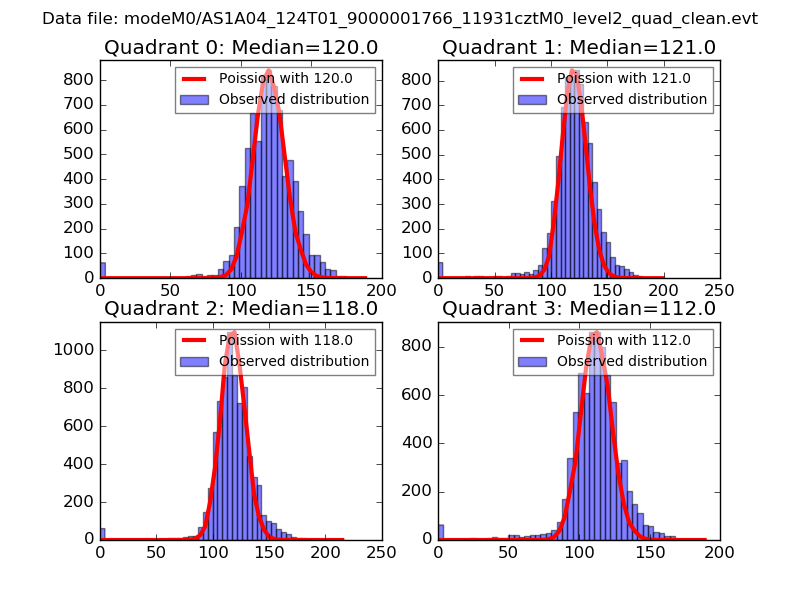 |
 |
| Quadrant-wise count rates Data is divided into 100 sec bins |
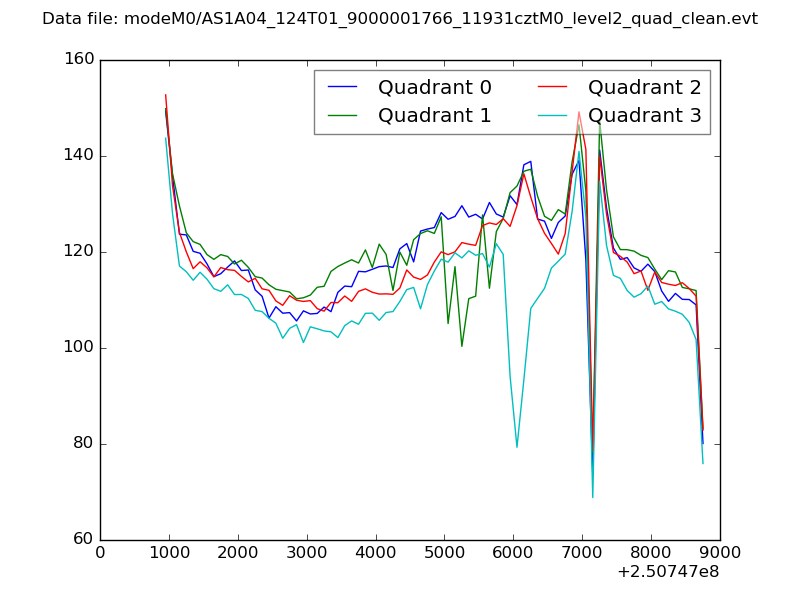 |
|
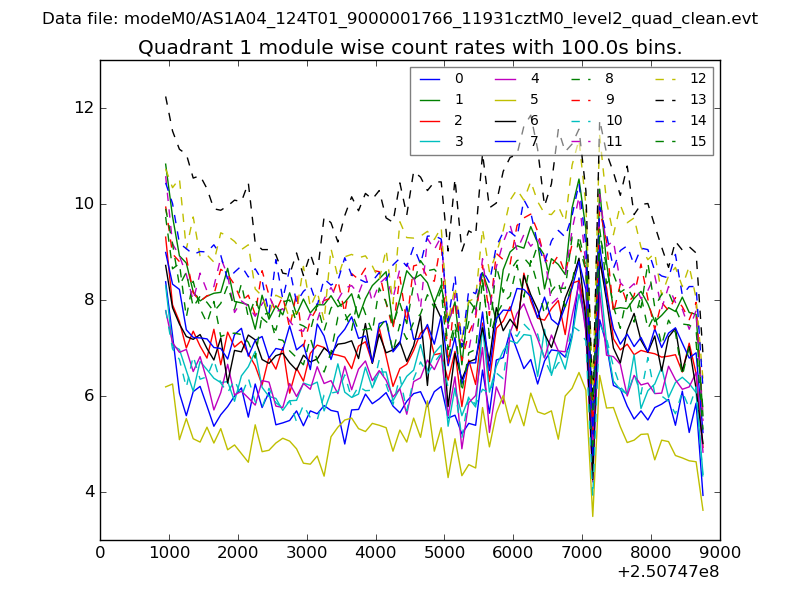
| Module-wise count rates for Quadrant A Data is divided into 100 sec bins |
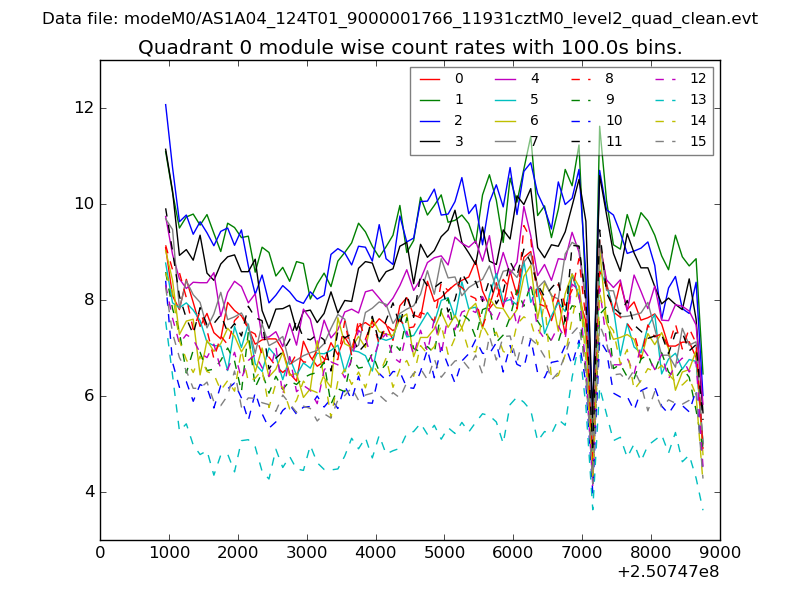 |
 |
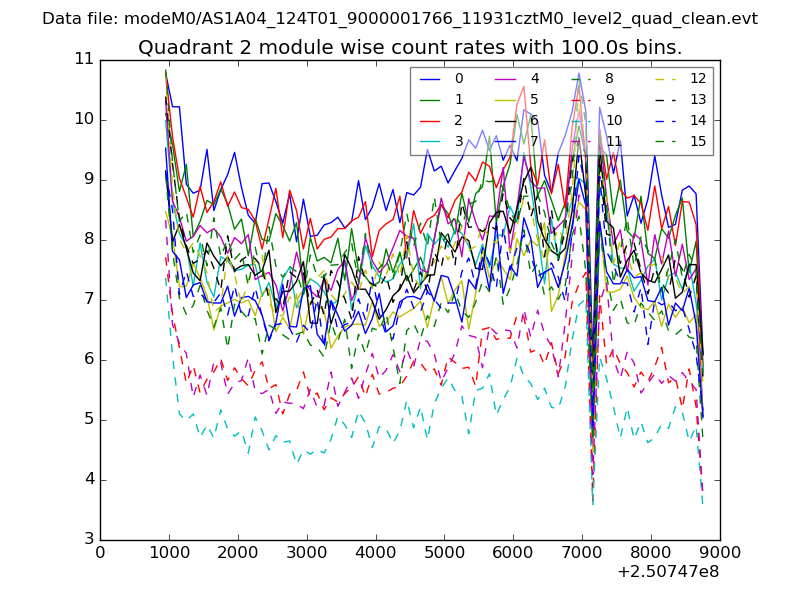
| Module-wise count rates for Quadrant B Data is divided into 100 sec bins |
 |
 |
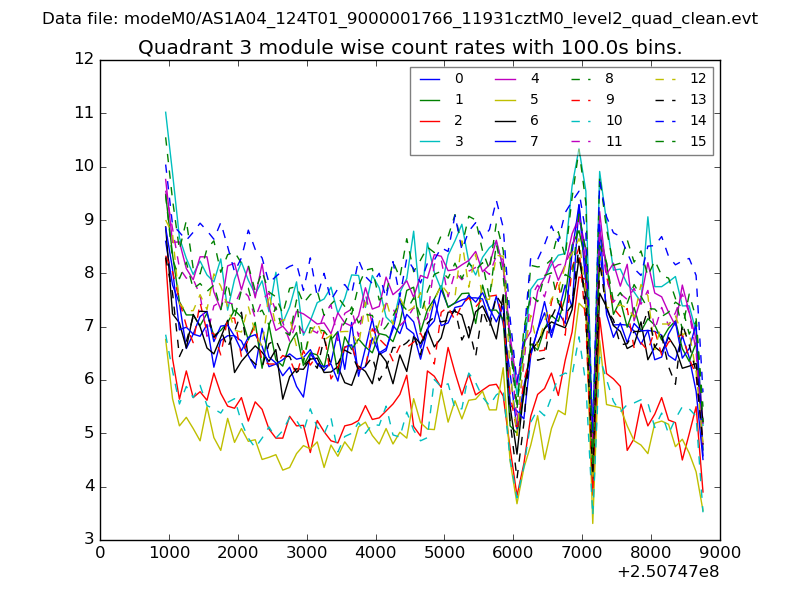
| Module-wise count rates for Quadrant C Data is divided into 100 sec bins |
 |
 |
| Module-wise count rates for Quadrant D Data is divided into 100 sec bins |
 |
 |
| Parameter | Plot |
|---|---|
| CZT HV Monitor | 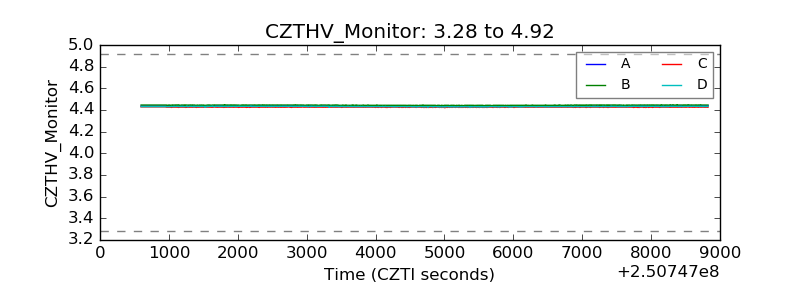 |
| D_VDD |  |
| Temperature 1 | 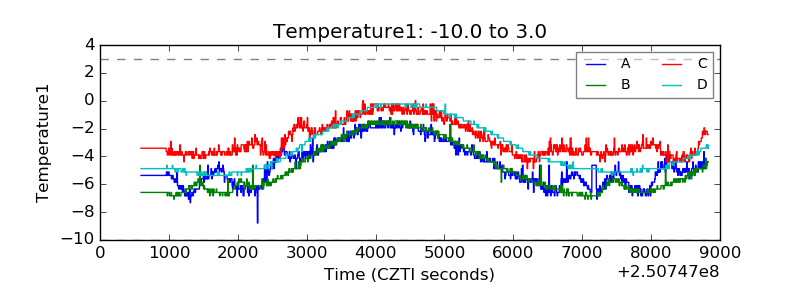 |
| Veto HV Monitor | 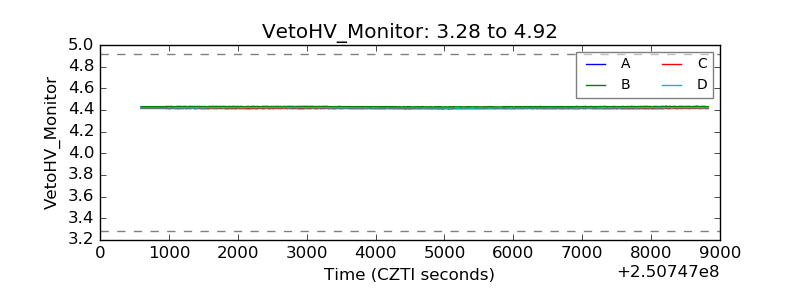 |
| Veto LLD | 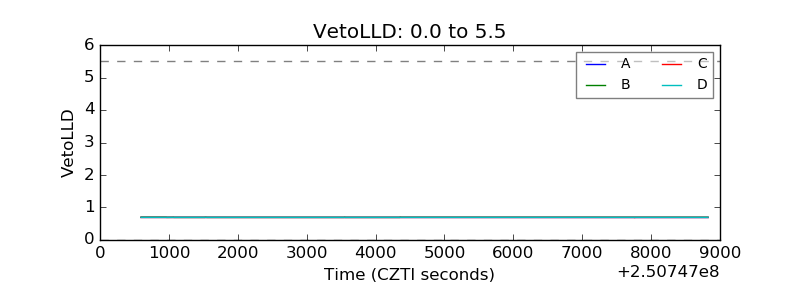 |
| Alpha Counter | 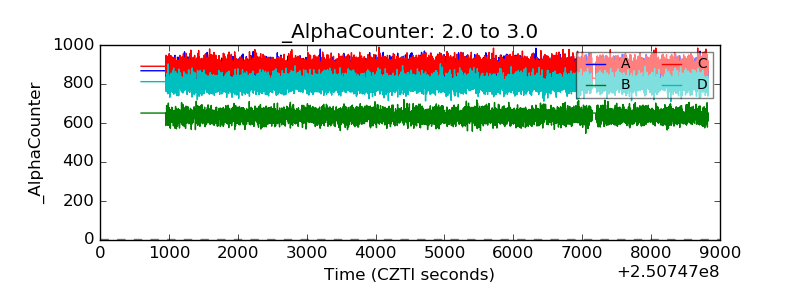 |
| _CPM_Rate | 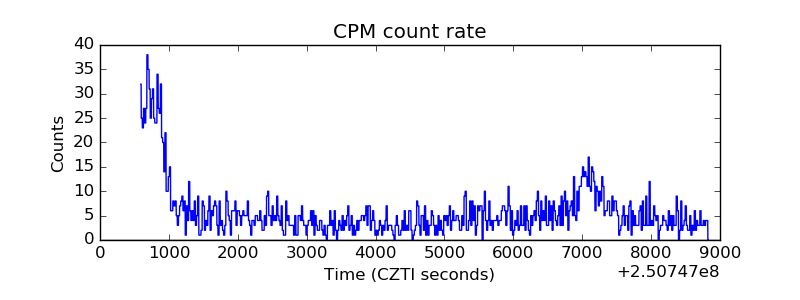 |
| CZT Counter | 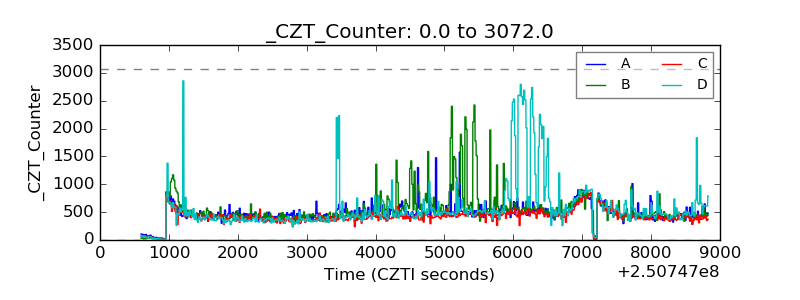 |
| +2.5 Volts monitor |  |
| +5 Volts monitor |  |
| _ROLL_ROT | 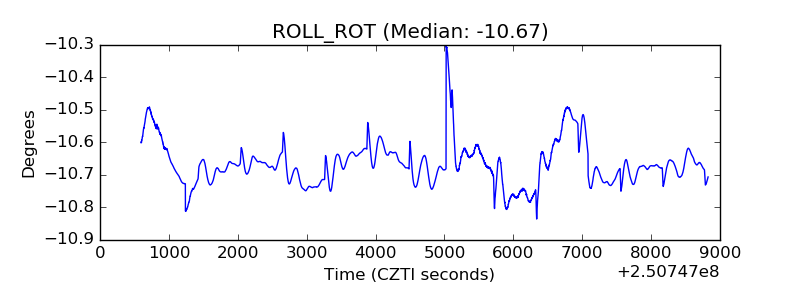 |
| _Roll_DEC | 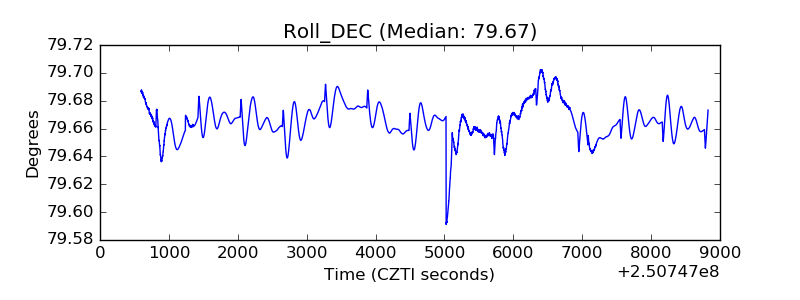 |
| _Roll_RA | 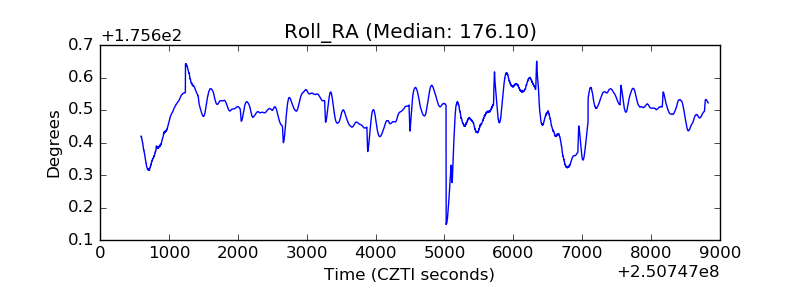 |
| Veto Counter | 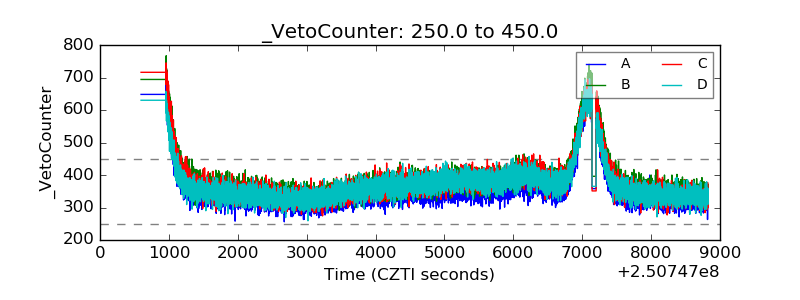 |