| Param | Original file | Final file |
|---|---|---|
| Filename | modeM0/AS1A04_124T01_9000001766_11932cztM0_level2.evt | modeM0/AS1A04_124T01_9000001766_11932cztM0_level2_quad_clean.evt |
| Size (bytes) | 506,957,760 | 124,148,160 |
| Size | 483.5 MB | 118.4 MB |
| Events in quadrant A | 3,332,398 | 835,190 |
| Events in quadrant B | 4,109,902 | 834,787 |
| Events in quadrant C | 3,037,429 | 819,326 |
| Events in quadrant D | 4,395,264 | 780,204 |
| Mode SS | |||
|---|---|---|---|
| Quadrant | BADHDUFLAG | Total packets | Discarded packets |
| A | 0 | 144 | 0 |
| B | 0 | 144 | 0 |
| C | 0 | 144 | 0 |
| D | 0 | 144 | 0 |
| Mode M9 | |||
|---|---|---|---|
| Quadrant | BADHDUFLAG | Total packets | Discarded packets |
| A | 0 | 2 | 0 |
| B | 0 | 2 | 0 |
| C | 0 | 2 | 0 |
| D | 0 | 2 | 0 |
| Mode M0 | |||
|---|---|---|---|
| Quadrant | BADHDUFLAG | Total packets | Discarded packets |
| A | 0 | 14664 | 2 |
| B | 0 | 16908 | 1 |
| C | 0 | 14305 | 1 |
| D | 0 | 18004 | 1 |
| Quadrant | Total seconds | Saturated seconds | Saturation percentage |
|---|---|---|---|
| A | 7037 | 149 | 2.117380% |
| B | 7037 | 334 | 4.746341% |
| C | 7037 | 48 | 0.682109% |
| D | 7037 | 197 | 2.799488% |
Noise dominated data is calculated using 1-second bins in cleaned event files. If a bin has >2000 counts, and if more than 50% of those come from <1% of pixels, then it is considered to be noise-dominated and hence unusable.
| Quadrant | # 1 sec bins | Bins with >0 counts | Bins with >2000 counts | High rate bins dominated by noise | Noise dominated (total time) | Noise dominated (detector-on time) | Marked lightcurve |
|---|---|---|---|---|---|---|---|
| A | 7278 | 7038 | 10 | 10 | 0.14% | 0.14% | 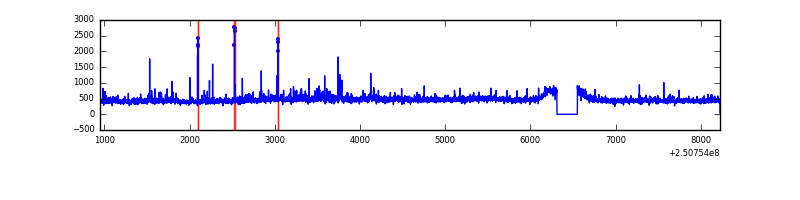 |
| B | 7278 | 7038 | 186 | 186 | 2.56% | 2.64% | 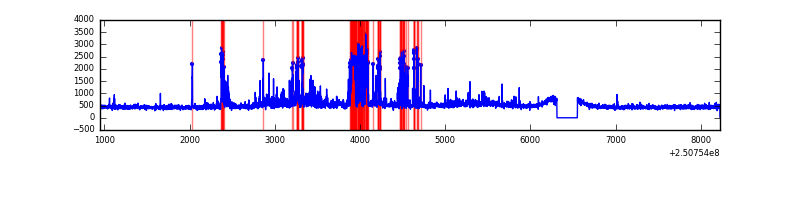 |
| C | 7278 | 7038 | 1 | 1 | 0.01% | 0.01% | 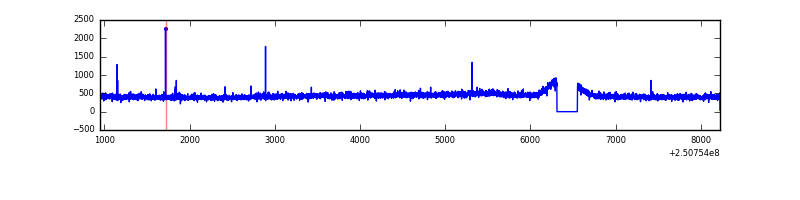 |
| D | 7278 | 7038 | 96 | 96 | 1.32% | 1.36% | 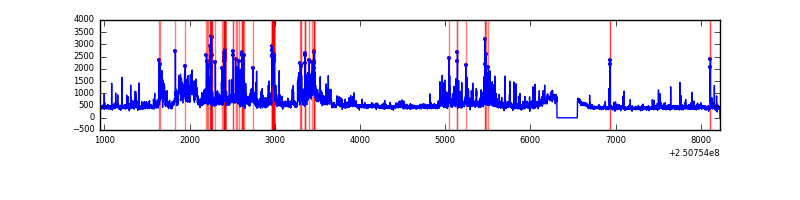 |
Top three noisy pixels from each quadrant. If the there are fewer than three noisy pixels in the level2.evt file, extra rows are filled as -1
| Pixel properties | Quadrant properties | ||||||
|---|---|---|---|---|---|---|---|
| Quadrant | DetID | PixID | Counts | Sigma | Mean | Median | Sigma |
| A | 1 | 162 | 70743 | 423.07 | 803 | 785 | 165.4 |
| A | 1 | 178 | 33098 | 195.41 | 803 | 785 | 165.4 |
| A | 1 | 161 | 29113 | 171.31 | 803 | 785 | 165.4 |
| B | 4 | 239 | 681927 | 4481.23 | 793 | 773 | 152.0 |
| B | 15 | 204 | 216274 | 1417.75 | 793 | 773 | 152.0 |
| B | 0 | 231 | 48811 | 316.03 | 793 | 773 | 152.0 |
| C | 8 | 128 | 8014 | 40.7 | 773 | 775 | 177.9 |
| C | 14 | 234 | 6176 | 30.36 | 773 | 775 | 177.9 |
| C | 13 | 61 | 5742 | 27.92 | 773 | 775 | 177.9 |
| D | 5 | 222 | 669960 | 3607.96 | 765 | 738 | 185.5 |
| D | 1 | 52 | 499595 | 2689.48 | 765 | 738 | 185.5 |
| D | 8 | 195 | 124580 | 667.67 | 765 | 738 | 185.5 |
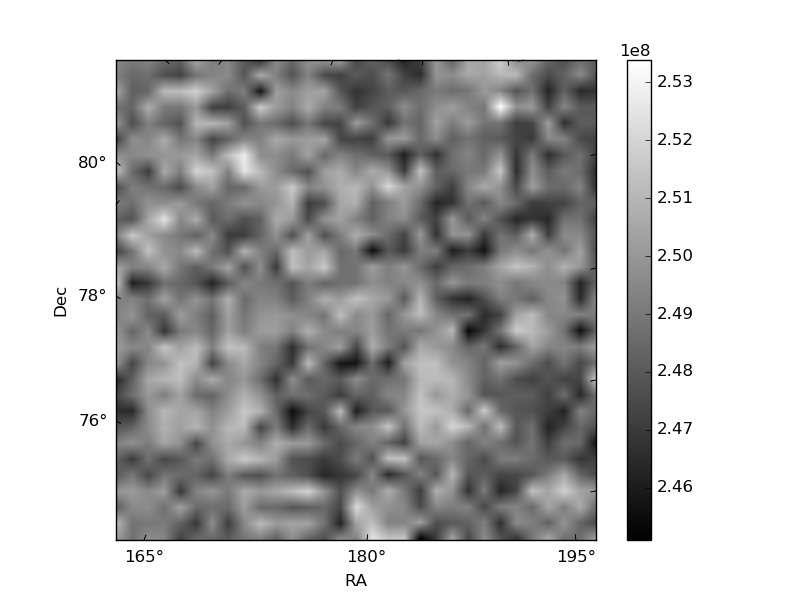
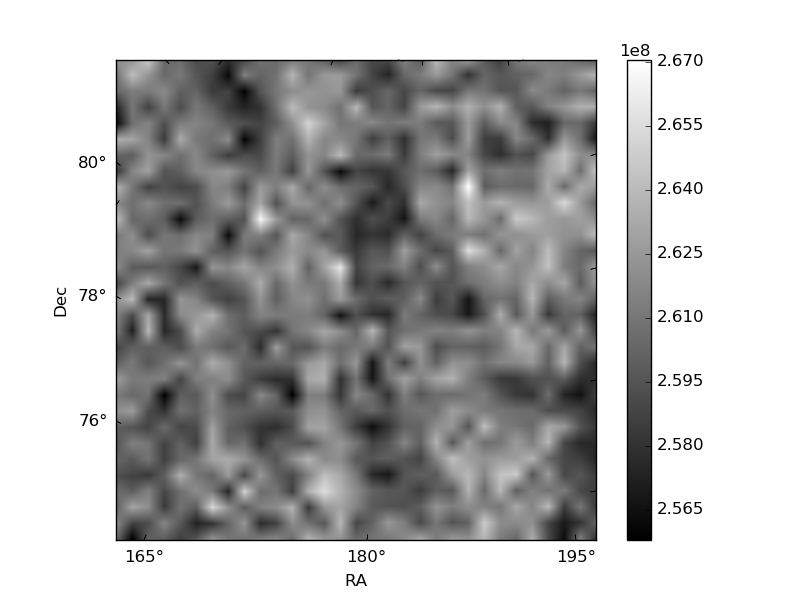
Histogram calculated using DETX and DETY for each event in the final _common_clean file
| Quadrant A | 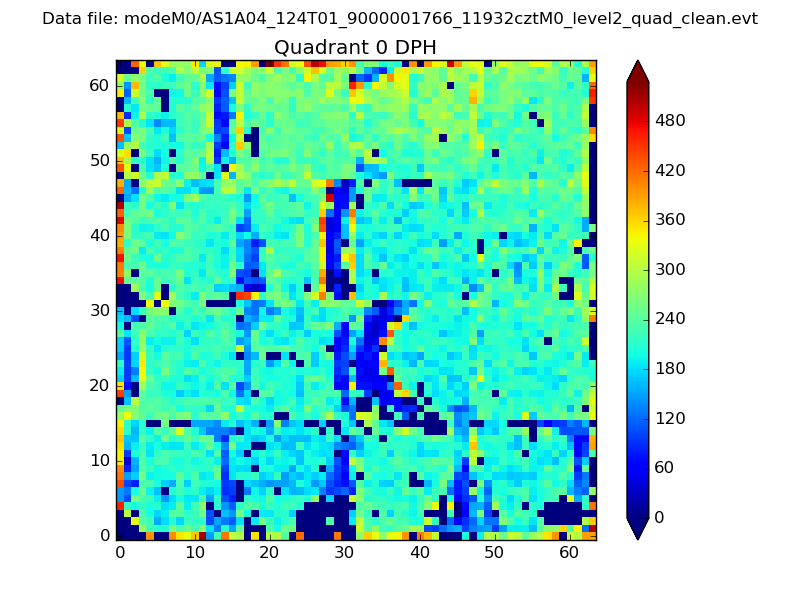 |
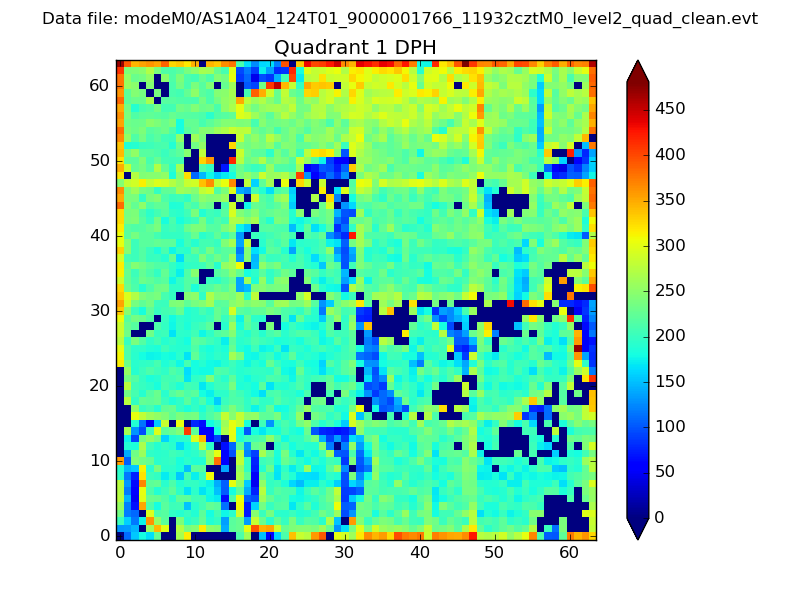 |
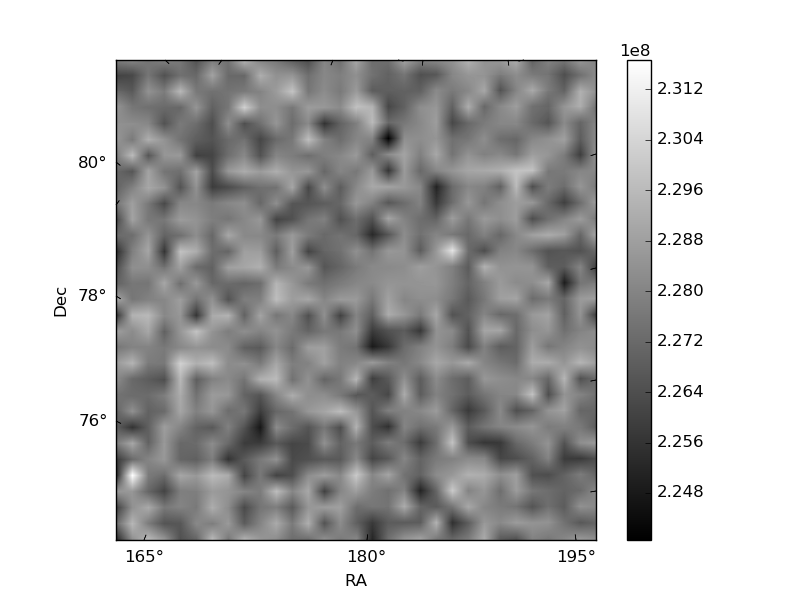
Quadrant B |
|---|---|---|---|
| Quadrant D | 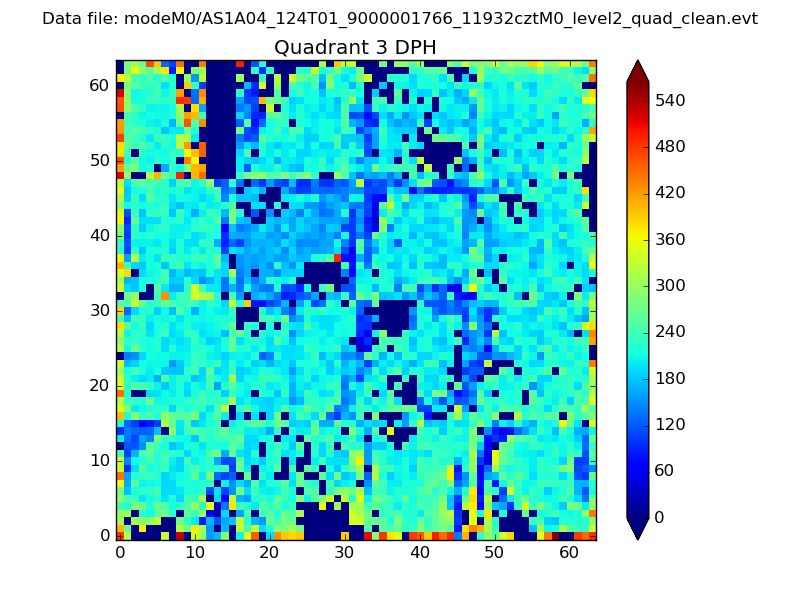 |
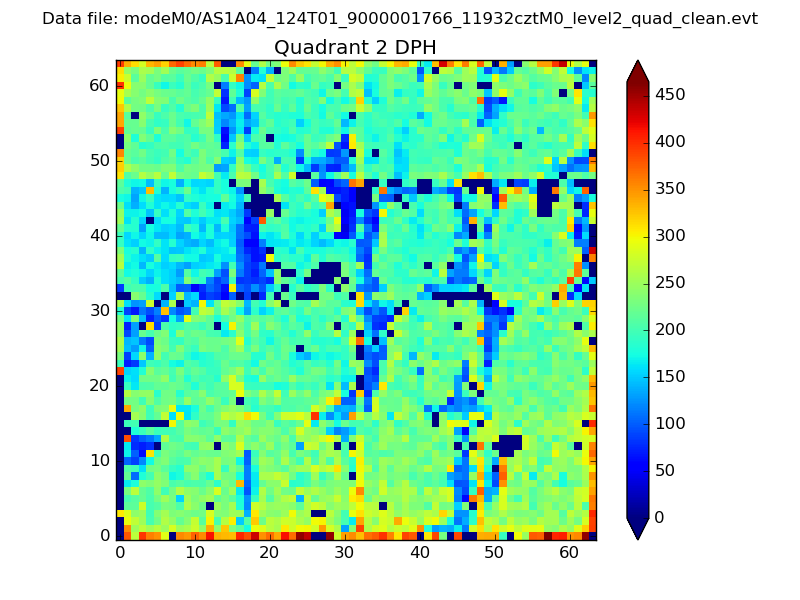 |
Quadrant C |
| Plot type | Count rate plots | Images |
|---|---|---|
| Comparison with Poisson distribution Blue bars denote a histogram of data divided into 1 sec bins. Red curve is a Poisson curve with rate = median count rate of data. |
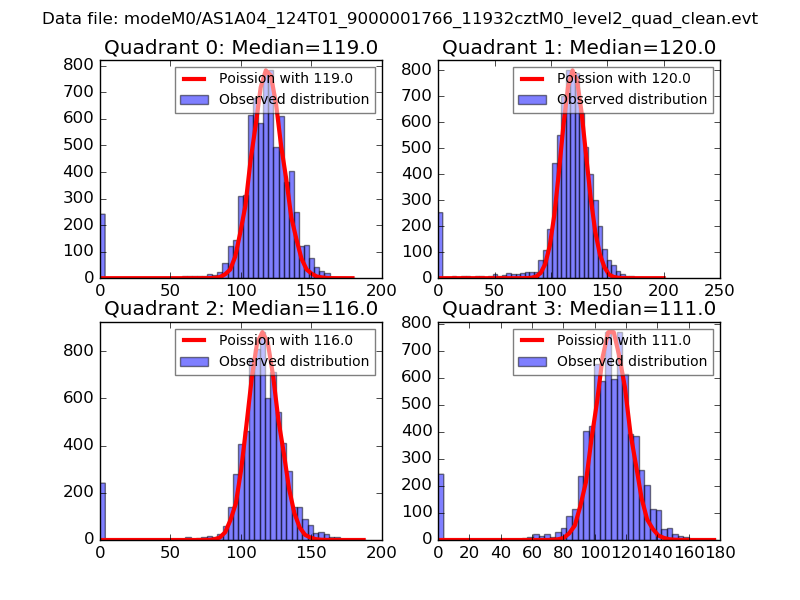 |
 |
| Quadrant-wise count rates Data is divided into 100 sec bins |
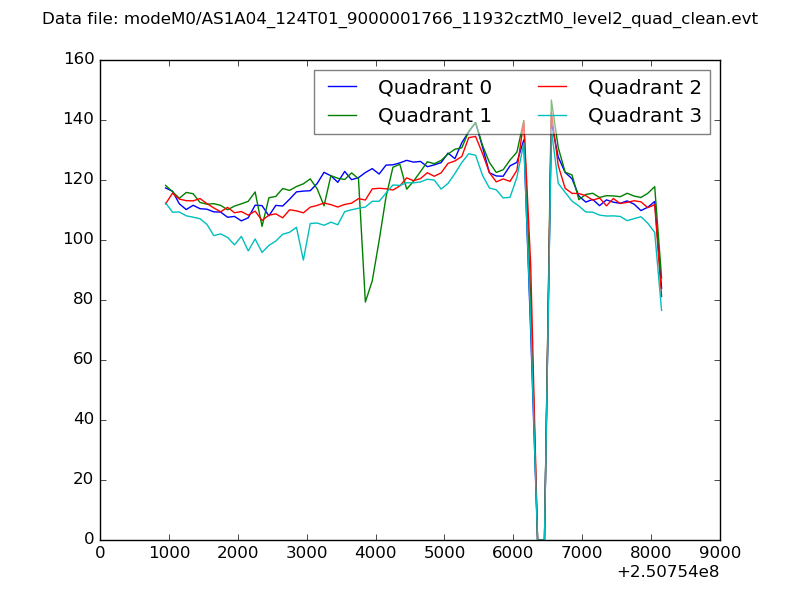 |
|
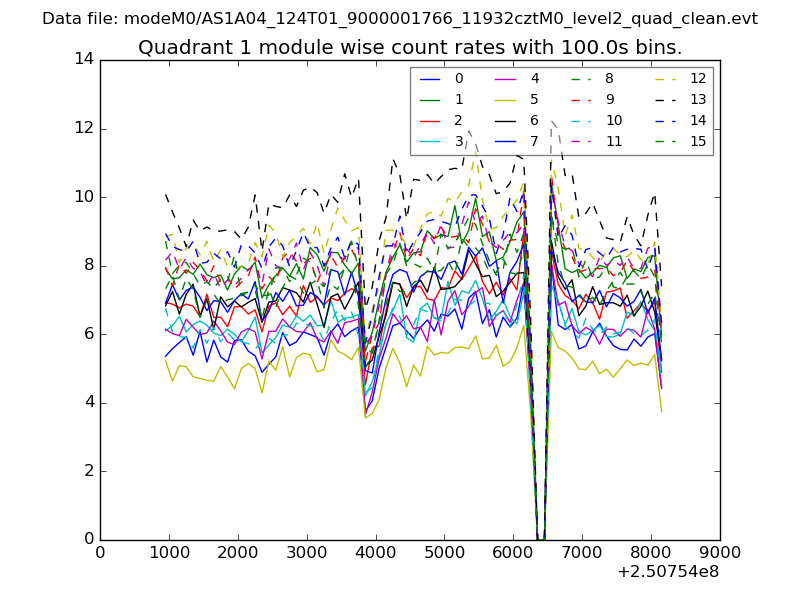
| Module-wise count rates for Quadrant A Data is divided into 100 sec bins |
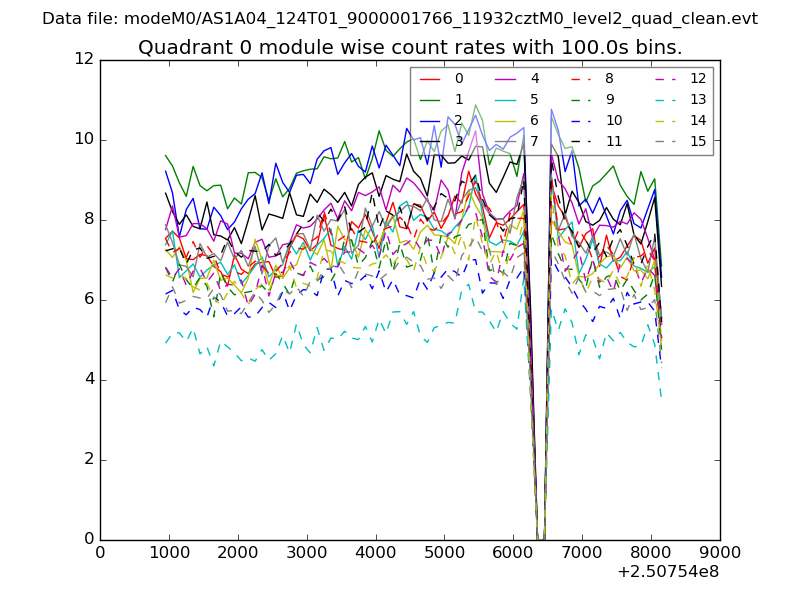 |
 |
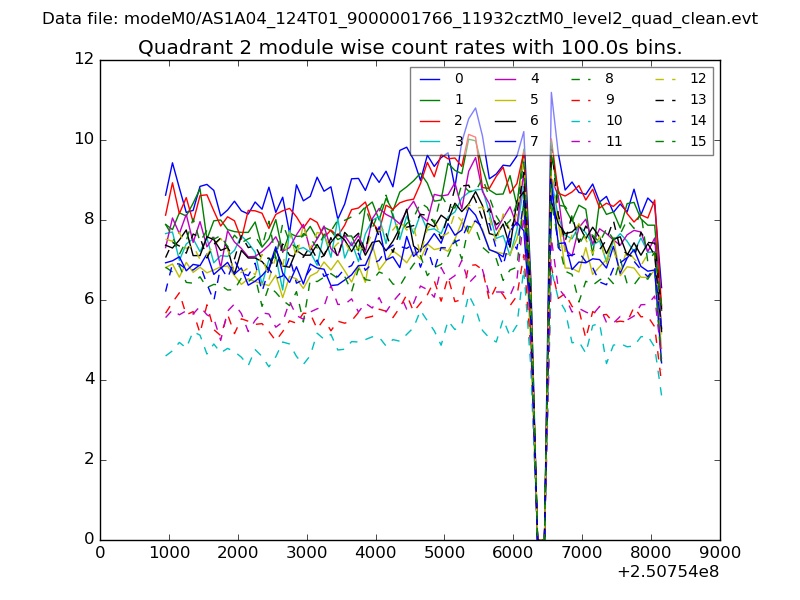
| Module-wise count rates for Quadrant B Data is divided into 100 sec bins |
 |
 |
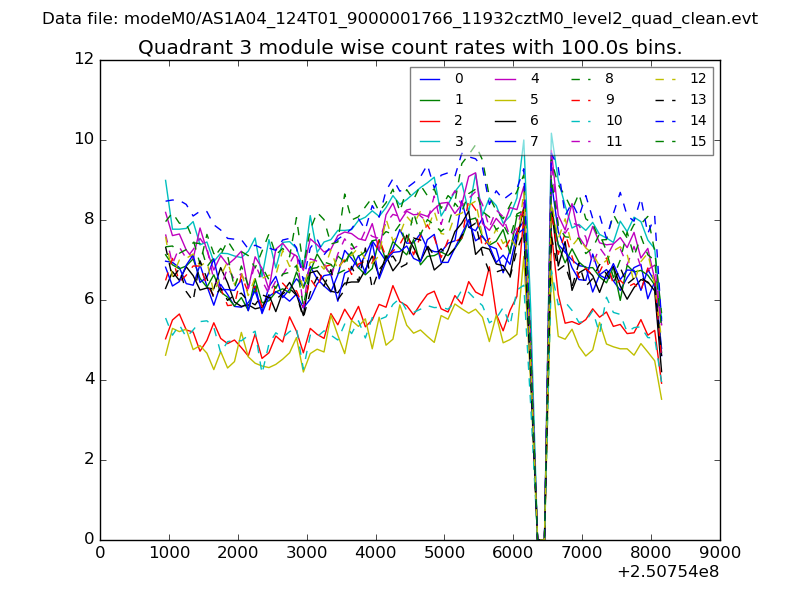
| Module-wise count rates for Quadrant C Data is divided into 100 sec bins |
 |
 |
| Module-wise count rates for Quadrant D Data is divided into 100 sec bins |
 |
 |
| Parameter | Plot |
|---|---|
| CZT HV Monitor | 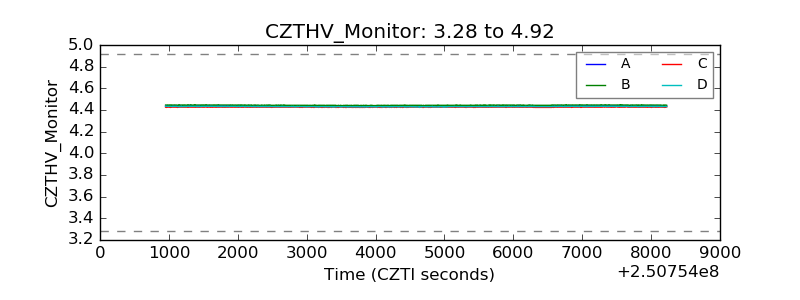 |
| D_VDD | 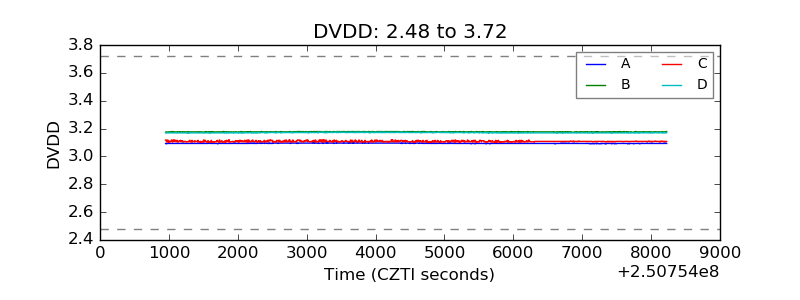 |
| Temperature 1 | 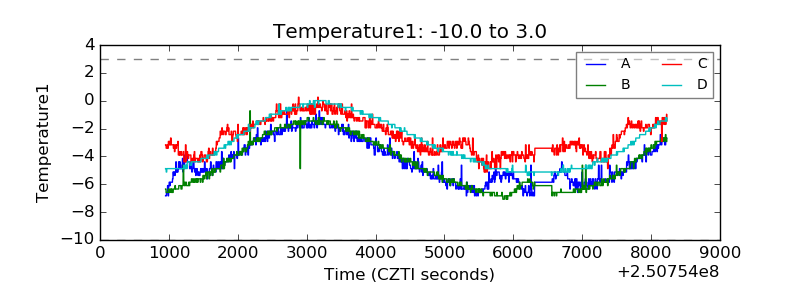 |
| Veto HV Monitor |  |
| Veto LLD | 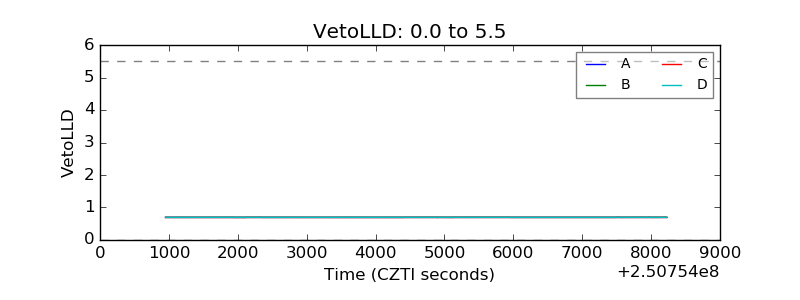 |
| Alpha Counter | 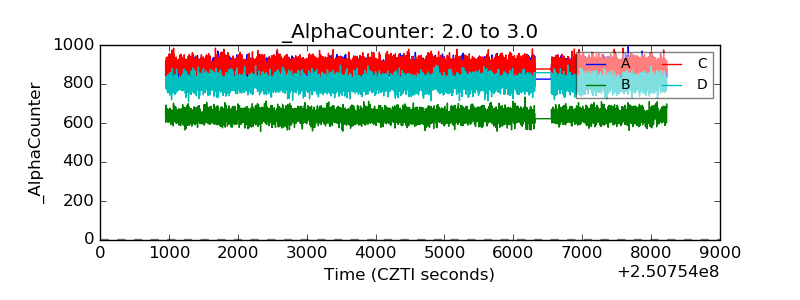 |
| _CPM_Rate | 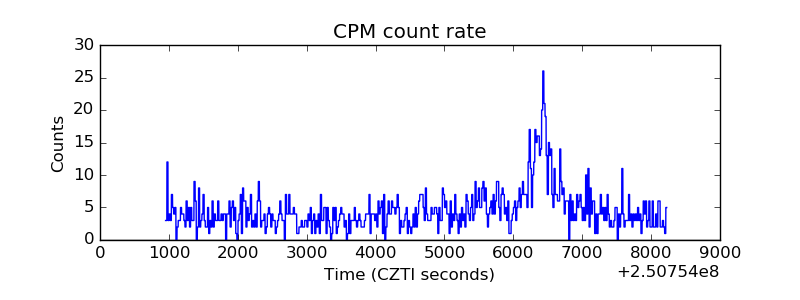 |
| CZT Counter | 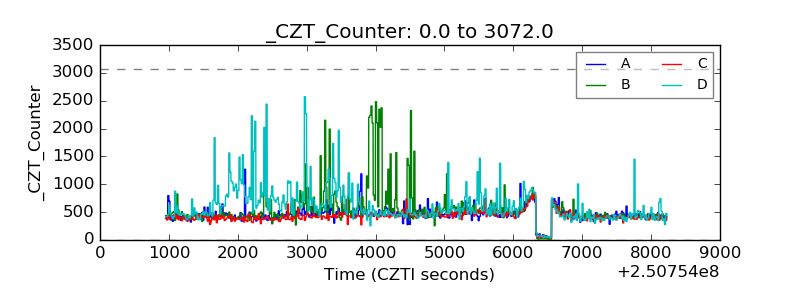 |
| +2.5 Volts monitor |  |
| +5 Volts monitor |  |
| _ROLL_ROT | 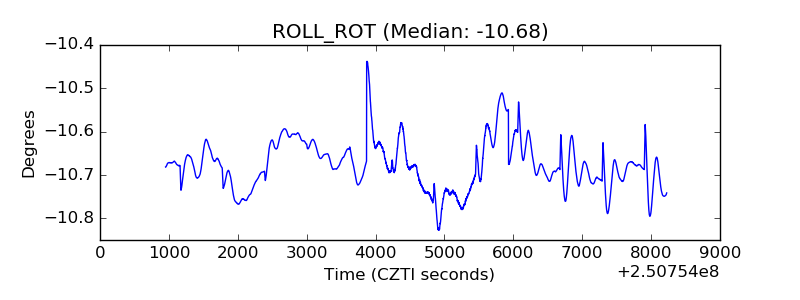 |
| _Roll_DEC | 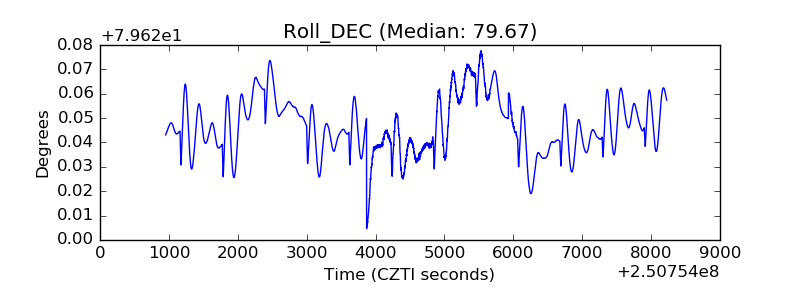 |
| _Roll_RA |  |
| Veto Counter | 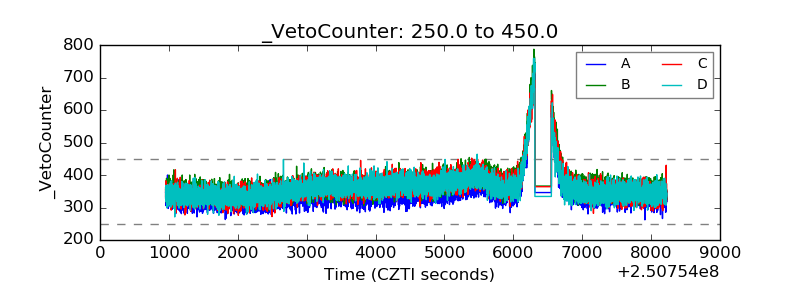 |