| Param | Original file | Final file |
|---|---|---|
| Filename | modeM0/AS1A04_124T01_9000001766_11935cztM0_level2.evt | modeM0/AS1A04_124T01_9000001766_11935cztM0_level2_quad_clean.evt |
| Size (bytes) | 612,429,120 | 139,999,680 |
| Size | 584.1 MB | 133.5 MB |
| Events in quadrant A | 3,843,683 | 955,040 |
| Events in quadrant B | 4,885,826 | 955,326 |
| Events in quadrant C | 3,435,572 | 932,237 |
| Events in quadrant D | 5,834,856 | 836,406 |
| Mode SS | |||
|---|---|---|---|
| Quadrant | BADHDUFLAG | Total packets | Discarded packets |
| A | 0 | 162 | 0 |
| B | 0 | 162 | 0 |
| C | 0 | 162 | 0 |
| D | 0 | 162 | 0 |
| Mode M9 | |||
|---|---|---|---|
| Quadrant | BADHDUFLAG | Total packets | Discarded packets |
| A | 0 | 5 | 0 |
| B | 0 | 5 | 0 |
| C | 0 | 5 | 0 |
| D | 0 | 5 | 0 |
| Mode M0 | |||
|---|---|---|---|
| Quadrant | BADHDUFLAG | Total packets | Discarded packets |
| A | 0 | 16774 | 2 |
| B | 0 | 19657 | 1 |
| C | 0 | 16285 | 1 |
| D | 0 | 22836 | 1 |
| Quadrant | Total seconds | Saturated seconds | Saturation percentage |
|---|---|---|---|
| A | 8076 | 103 | 1.275384% |
| B | 8076 | 351 | 4.346211% |
| C | 8076 | 52 | 0.643883% |
| D | 8076 | 777 | 9.621100% |
Noise dominated data is calculated using 1-second bins in cleaned event files. If a bin has >2000 counts, and if more than 50% of those come from <1% of pixels, then it is considered to be noise-dominated and hence unusable.
| Quadrant | # 1 sec bins | Bins with >0 counts | Bins with >2000 counts | High rate bins dominated by noise | Noise dominated (total time) | Noise dominated (detector-on time) | Marked lightcurve |
|---|---|---|---|---|---|---|---|
| A | 8527 | 8077 | 6 | 6 | 0.07% | 0.07% | 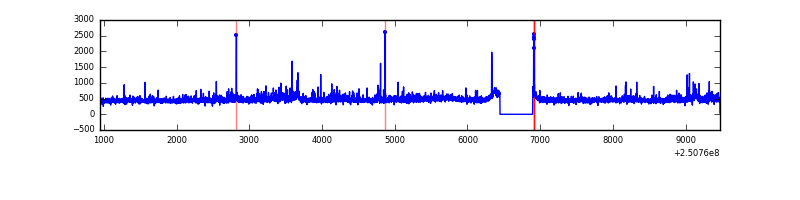 |
| B | 8527 | 8077 | 246 | 246 | 2.88% | 3.05% | 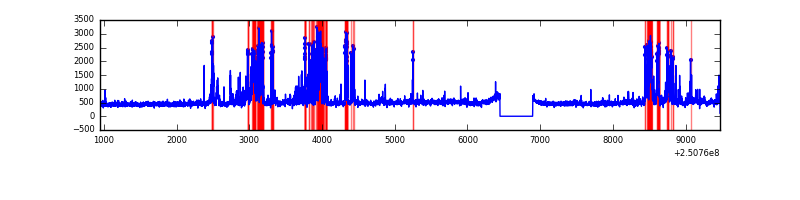 |
| C | 8527 | 8077 | 1 | 1 | 0.01% | 0.01% | 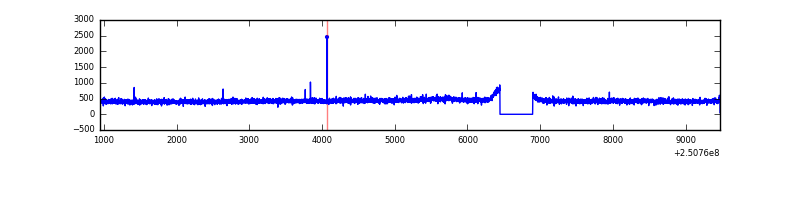 |
| D | 8527 | 8077 | 631 | 631 | 7.40% | 7.81% | 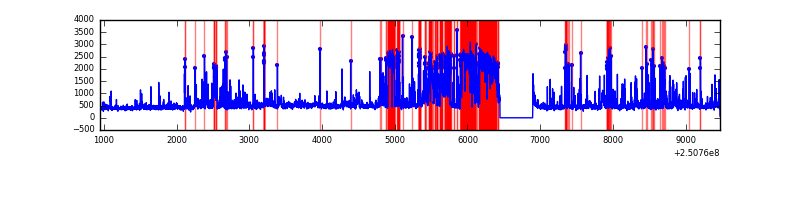 |
Top three noisy pixels from each quadrant. If the there are fewer than three noisy pixels in the level2.evt file, extra rows are filled as -1
| Pixel properties | Quadrant properties | ||||||
|---|---|---|---|---|---|---|---|
| Quadrant | DetID | PixID | Counts | Sigma | Mean | Median | Sigma |
| A | 1 | 162 | 80665 | 424.47 | 919 | 900 | 187.9 |
| A | 8 | 15 | 48199 | 251.7 | 919 | 900 | 187.9 |
| A | 1 | 178 | 38661 | 200.94 | 919 | 900 | 187.9 |
| B | 4 | 239 | 982830 | 5677.89 | 906 | 884 | 172.9 |
| B | 15 | 204 | 167574 | 963.85 | 906 | 884 | 172.9 |
| B | 0 | 218 | 62823 | 358.15 | 906 | 884 | 172.9 |
| C | 13 | 61 | 6515 | 27.58 | 879 | 879 | 204.3 |
| C | 14 | 234 | 4912 | 19.74 | 879 | 879 | 204.3 |
| C | 0 | 207 | 3443 | 12.55 | 879 | 879 | 204.3 |
| D | 1 | 52 | 2159424 | 10853.38 | 826 | 800 | 198.9 |
| D | 8 | 195 | 209220 | 1047.92 | 826 | 800 | 198.9 |
| D | 13 | 104 | 77658 | 386.44 | 826 | 800 | 198.9 |
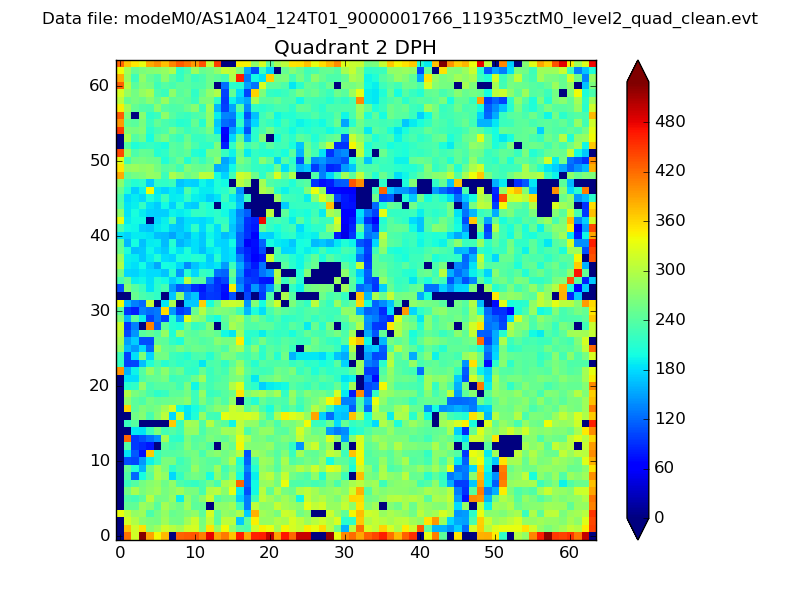
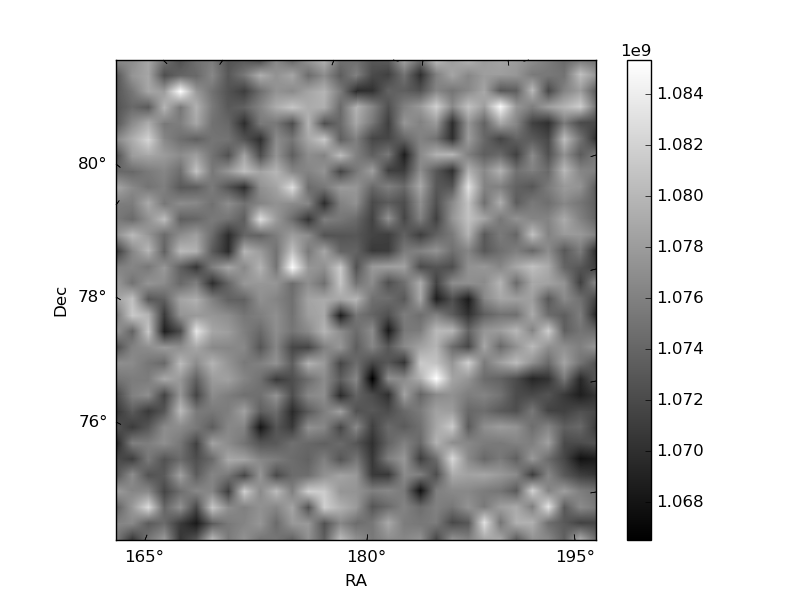
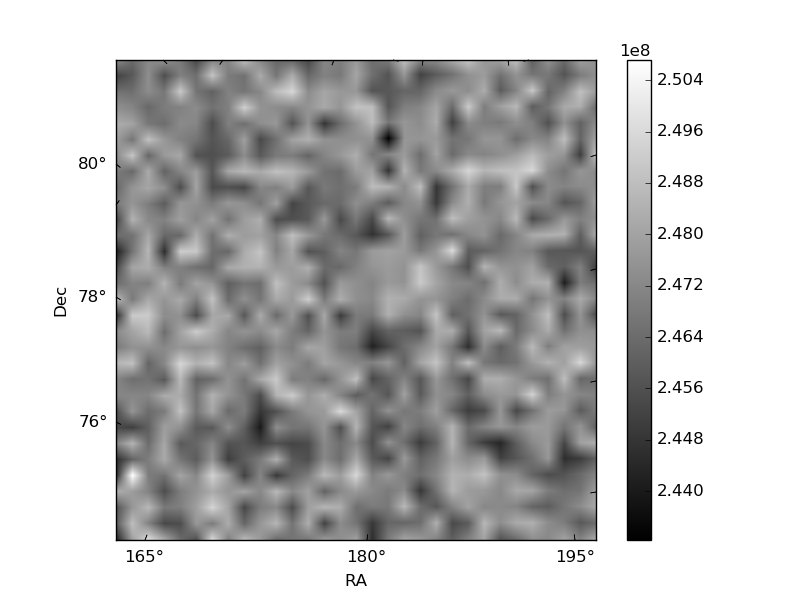
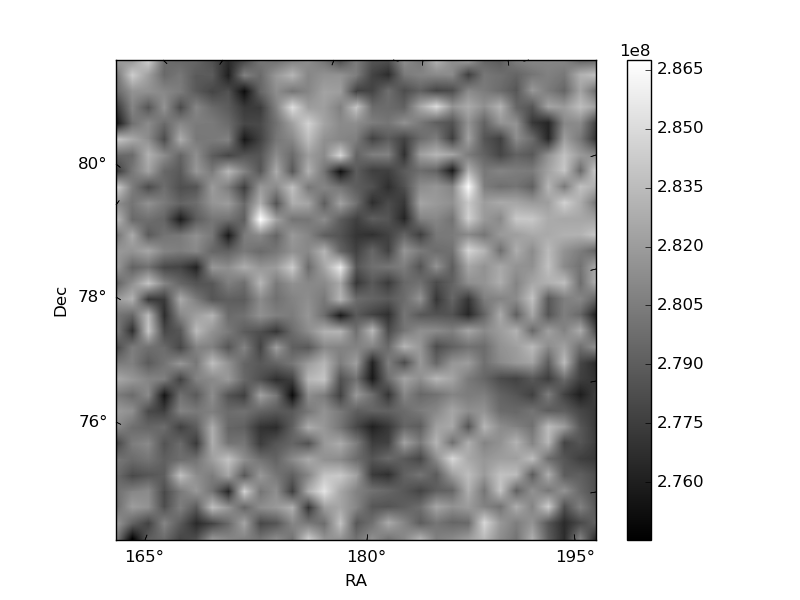
Histogram calculated using DETX and DETY for each event in the final _common_clean file
| Quadrant A | 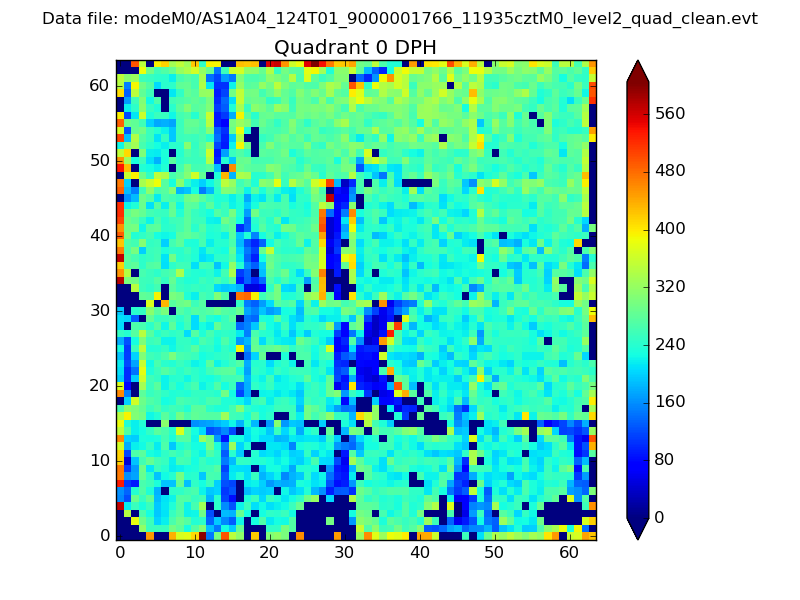 |
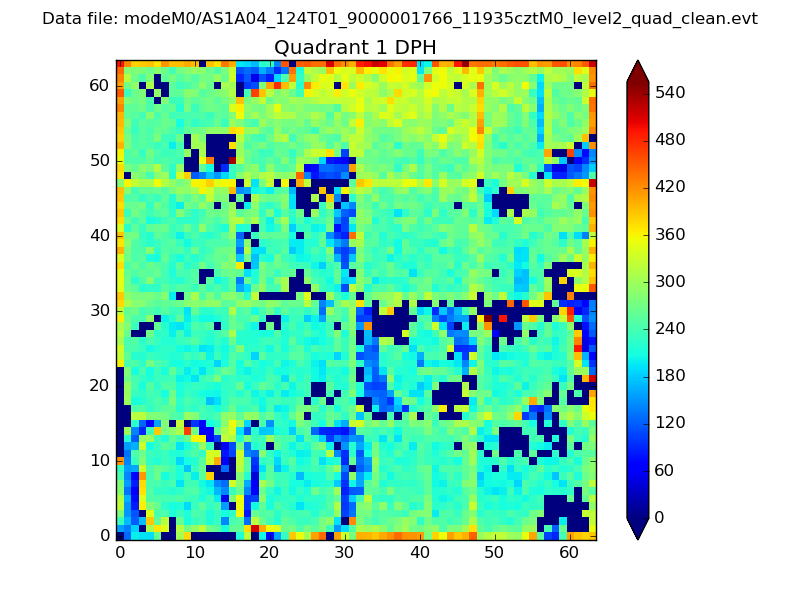 |
Quadrant B |
|---|---|---|---|
| Quadrant D | 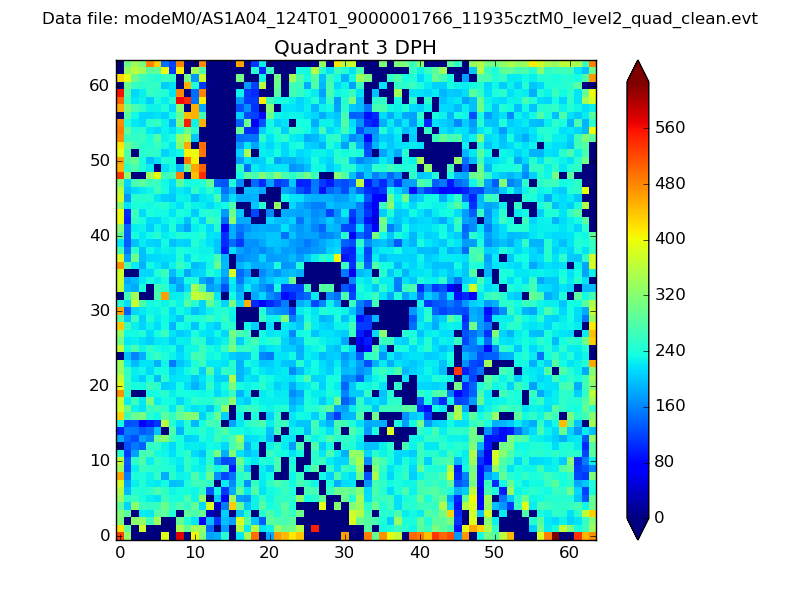 |
 |
Quadrant C |
| Plot type | Count rate plots | Images |
|---|---|---|
| Comparison with Poisson distribution Blue bars denote a histogram of data divided into 1 sec bins. Red curve is a Poisson curve with rate = median count rate of data. |
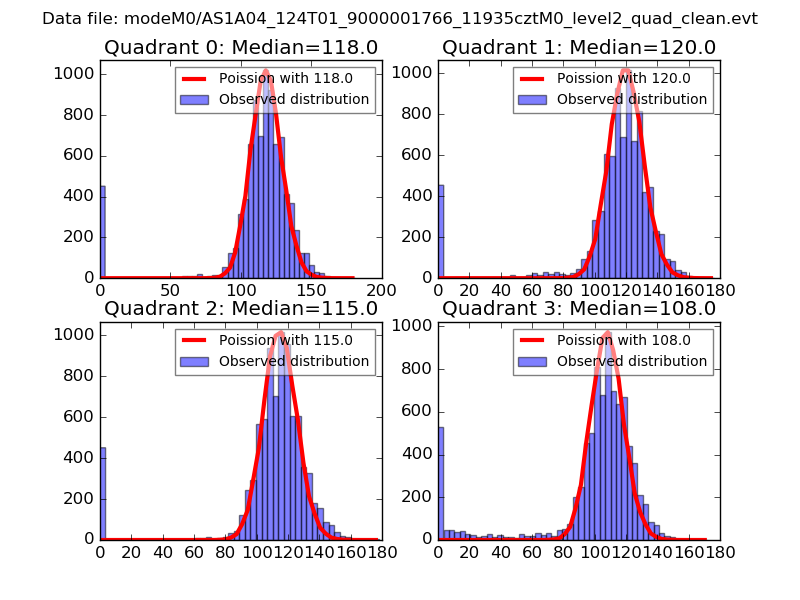 |
 |
| Quadrant-wise count rates Data is divided into 100 sec bins |
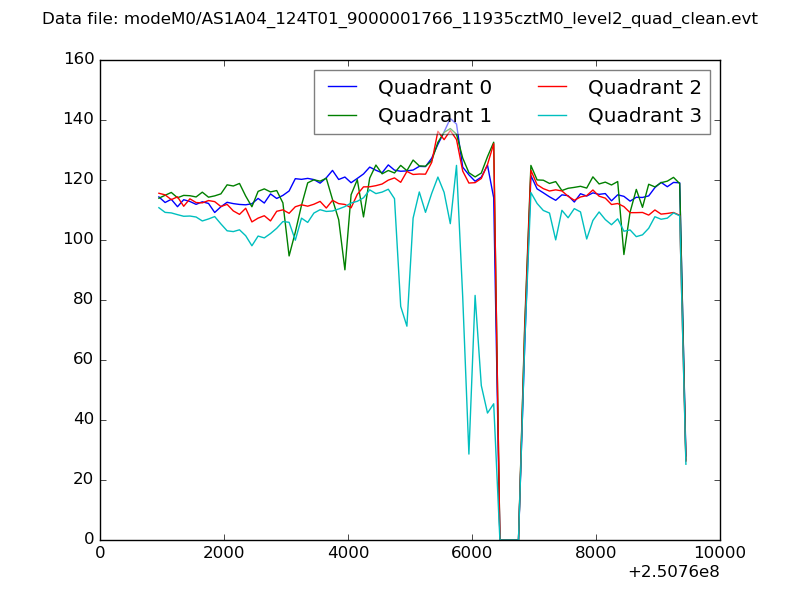 |
|
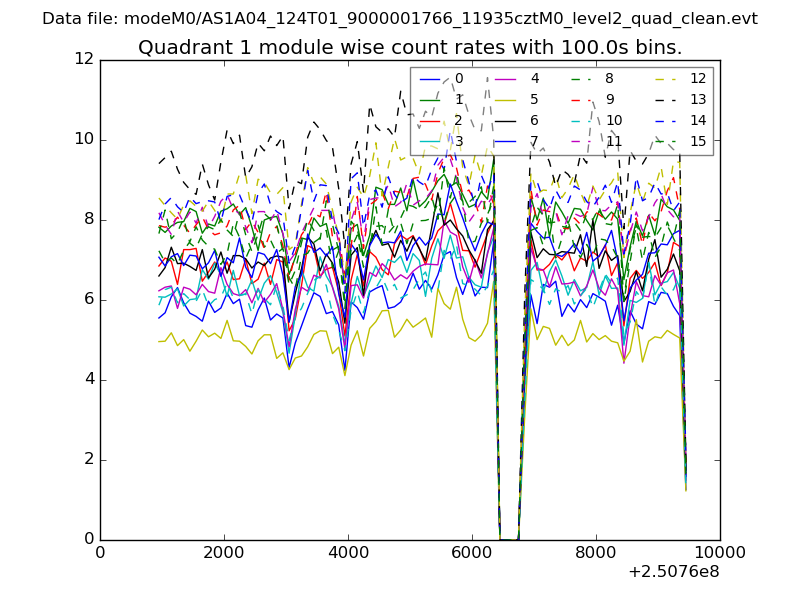
| Module-wise count rates for Quadrant A Data is divided into 100 sec bins |
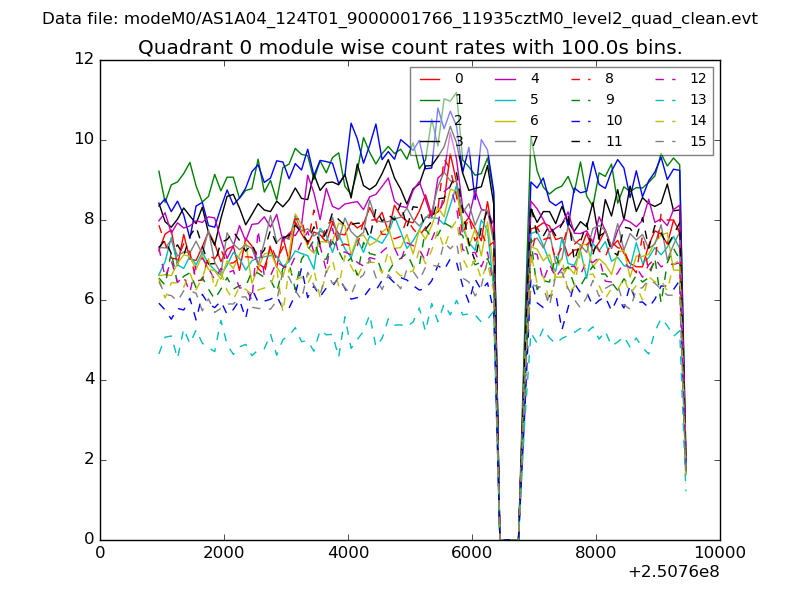 |
 |
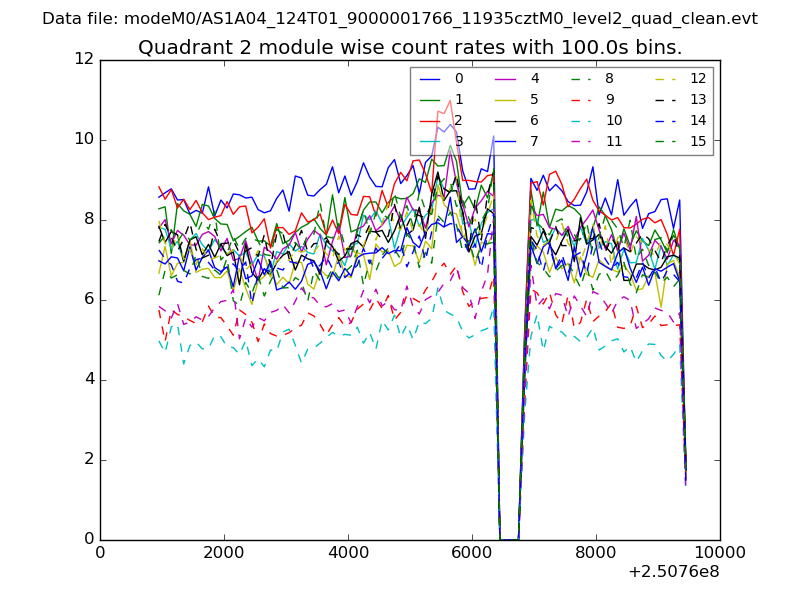
| Module-wise count rates for Quadrant B Data is divided into 100 sec bins |
 |
 |
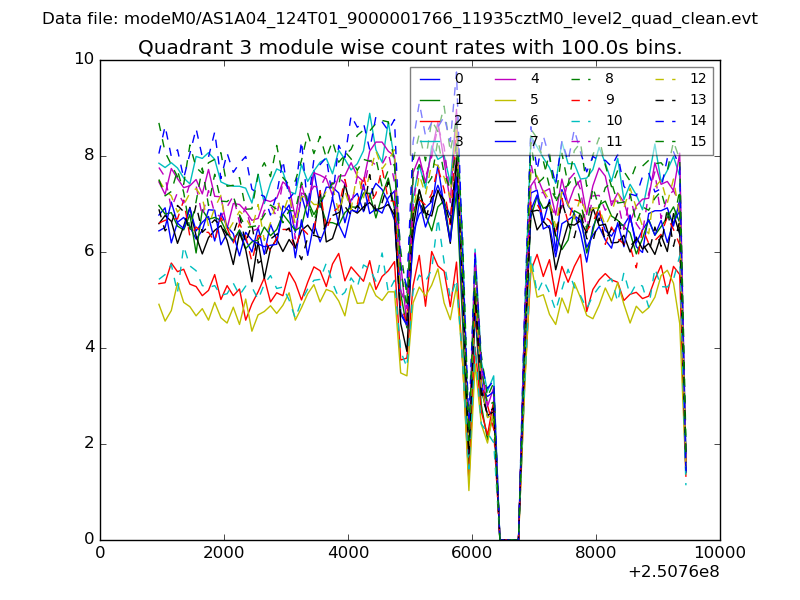
| Module-wise count rates for Quadrant C Data is divided into 100 sec bins |
 |
 |
| Module-wise count rates for Quadrant D Data is divided into 100 sec bins |
 |
 |
| Parameter | Plot |
|---|---|
| CZT HV Monitor | 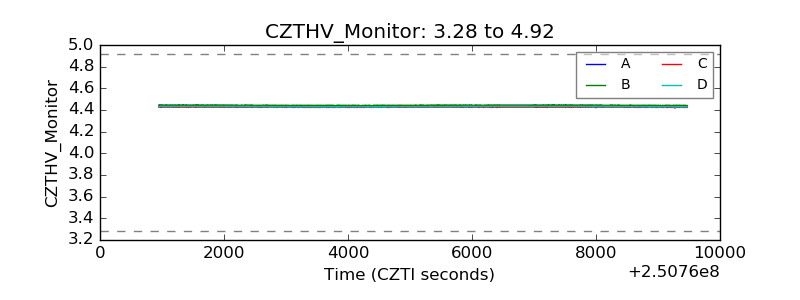 |
| D_VDD |  |
| Temperature 1 |  |
| Veto HV Monitor | 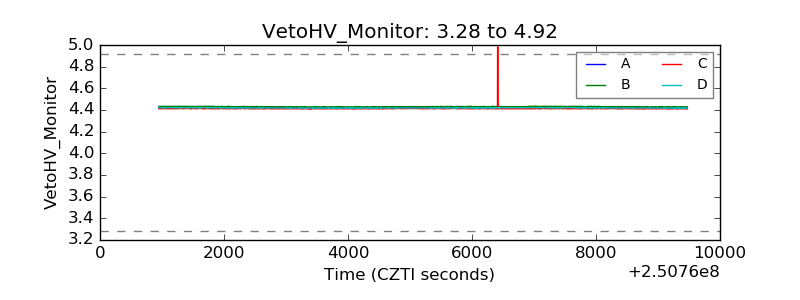 |
| Veto LLD | 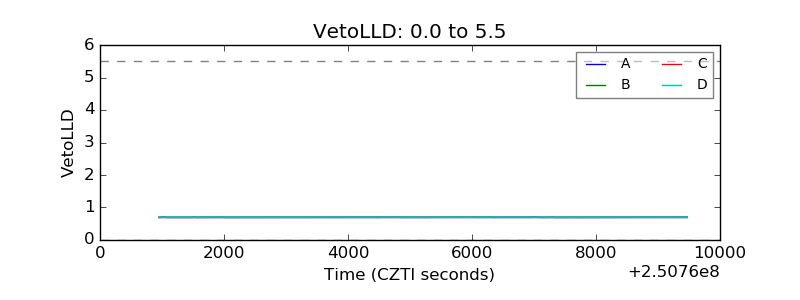 |
| Alpha Counter | 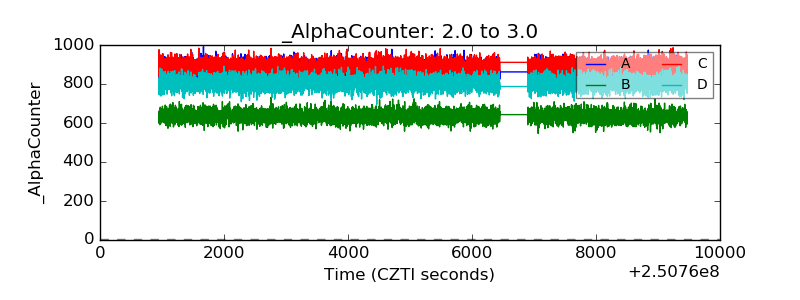 |
| _CPM_Rate | 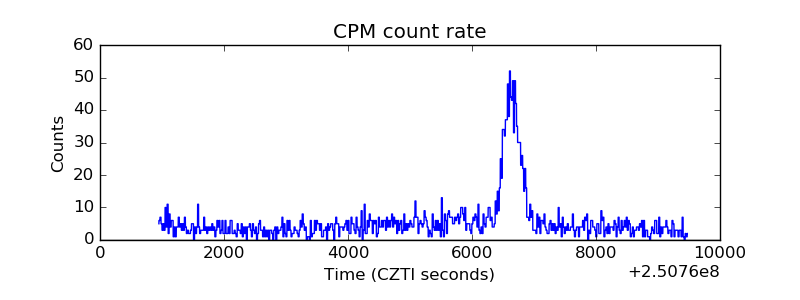 |
| CZT Counter | 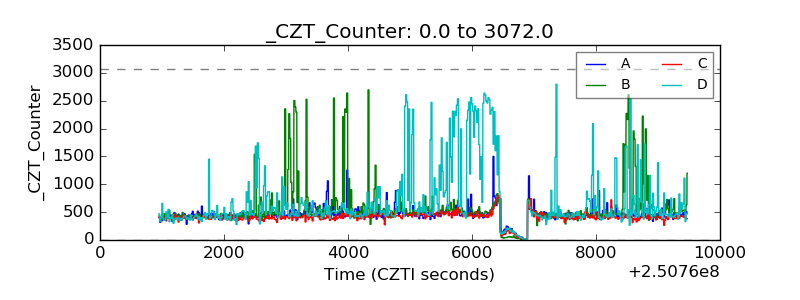 |
| +2.5 Volts monitor |  |
| +5 Volts monitor |  |
| _ROLL_ROT | 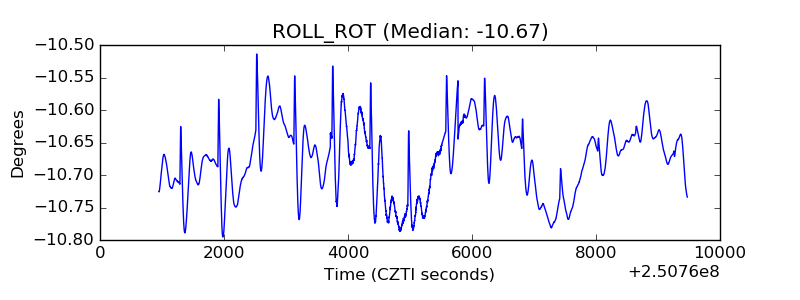 |
| _Roll_DEC | 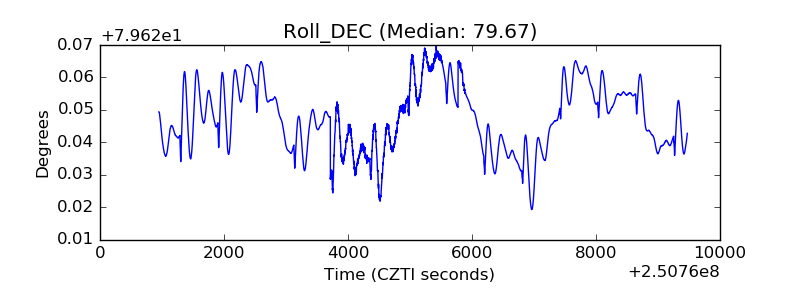 |
| _Roll_RA | 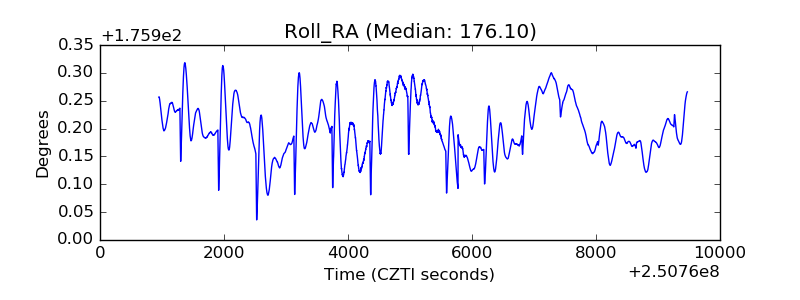 |
| Veto Counter | 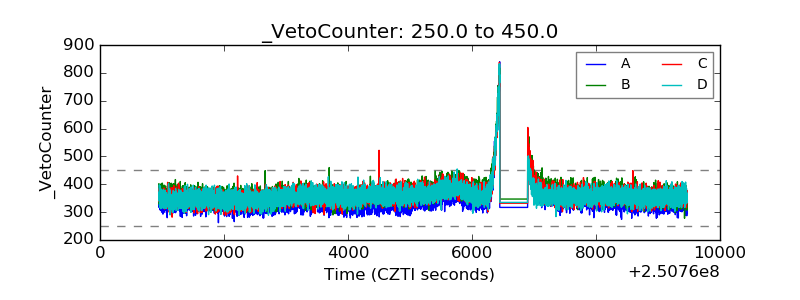 |