| Param | Original file | Final file |
|---|---|---|
| Filename | modeM0/AS1A04_124T01_9000001766_11936cztM0_level2.evt | modeM0/AS1A04_124T01_9000001766_11936cztM0_level2_quad_clean.evt |
| Size (bytes) | 1,341,535,680 | 276,171,840 |
| Size | 1.2 GB | 263.4 MB |
| Events in quadrant A | 10,020,935 | 1,876,750 |
| Events in quadrant B | 9,787,238 | 1,890,576 |
| Events in quadrant C | 6,830,967 | 1,851,290 |
| Events in quadrant D | 12,941,439 | 1,674,307 |
| Mode SS | |||
|---|---|---|---|
| Quadrant | BADHDUFLAG | Total packets | Discarded packets |
| A | 0 | 316 | 0 |
| B | 0 | 316 | 0 |
| C | 0 | 316 | 0 |
| D | 0 | 316 | 0 |
| Mode M9 | |||
|---|---|---|---|
| Quadrant | BADHDUFLAG | Total packets | Discarded packets |
| A | 0 | 24 | 0 |
| B | 0 | 24 | 0 |
| C | 0 | 24 | 0 |
| D | 0 | 24 | 0 |
| Mode M0 | |||
|---|---|---|---|
| Quadrant | BADHDUFLAG | Total packets | Discarded packets |
| A | 0 | 40037 | 4 |
| B | 0 | 39239 | 3 |
| C | 0 | 31463 | 3 |
| D | 0 | 48536 | 3 |
| Quadrant | Total seconds | Saturated seconds | Saturation percentage |
|---|---|---|---|
| A | 15529 | 686 | 4.417541% |
| B | 15529 | 766 | 4.932707% |
| C | 15529 | 122 | 0.785627% |
| D | 15529 | 1843 | 11.868118% |
Noise dominated data is calculated using 1-second bins in cleaned event files. If a bin has >2000 counts, and if more than 50% of those come from <1% of pixels, then it is considered to be noise-dominated and hence unusable.
| Quadrant | # 1 sec bins | Bins with >0 counts | Bins with >2000 counts | High rate bins dominated by noise | Noise dominated (total time) | Noise dominated (detector-on time) | Marked lightcurve |
|---|---|---|---|---|---|---|---|
| A | 17895 | 15530 | 431 | 431 | 2.41% | 2.78% | 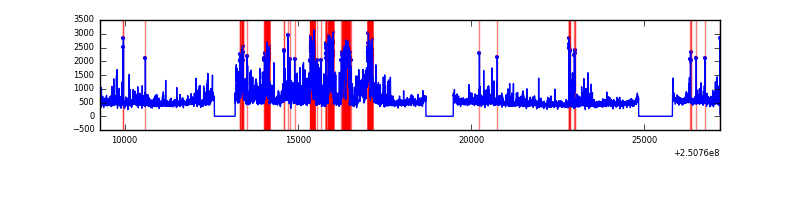 |
| B | 17895 | 15530 | 434 | 434 | 2.43% | 2.79% | 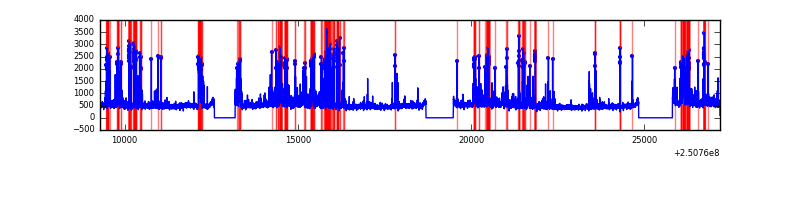 |
| C | 17895 | 15530 | 1 | 1 | 0.01% | 0.01% | 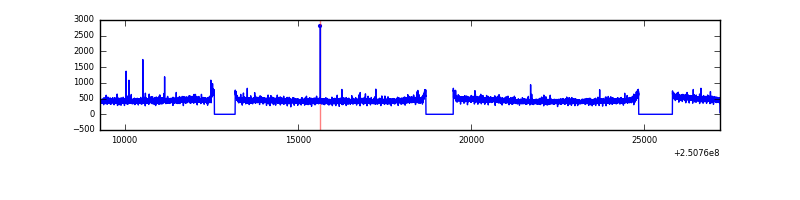 |
| D | 17895 | 15530 | 1437 | 1437 | 8.03% | 9.25% | 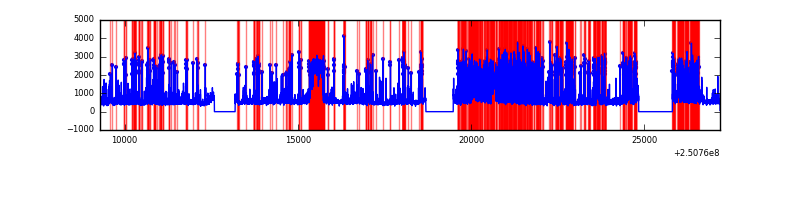 |
Top three noisy pixels from each quadrant. If the there are fewer than three noisy pixels in the level2.evt file, extra rows are filled as -1
| Pixel properties | Quadrant properties | ||||||
|---|---|---|---|---|---|---|---|
| Quadrant | DetID | PixID | Counts | Sigma | Mean | Median | Sigma |
| A | 14 | 63 | 2079978 | 5772.65 | 1784 | 1746 | 360.0 |
| A | 1 | 162 | 246746 | 680.53 | 1784 | 1746 | 360.0 |
| A | 13 | 251 | 188727 | 519.37 | 1784 | 1746 | 360.0 |
| B | 4 | 239 | 1676764 | 4962.41 | 1783 | 1738 | 337.5 |
| B | 15 | 204 | 514431 | 1518.9 | 1783 | 1738 | 337.5 |
| B | 0 | 85 | 222129 | 652.93 | 1783 | 1738 | 337.5 |
| C | 0 | 207 | 13751 | 30.05 | 1742 | 1742 | 399.6 |
| C | 14 | 238 | 13717 | 29.97 | 1742 | 1742 | 399.6 |
| C | 13 | 61 | 12886 | 27.89 | 1742 | 1742 | 399.6 |
| D | 1 | 52 | 3749492 | 9423.35 | 1647 | 1597 | 397.7 |
| D | 7 | 80 | 1021770 | 2565.03 | 1647 | 1597 | 397.7 |
| D | 8 | 195 | 703239 | 1764.14 | 1647 | 1597 | 397.7 |
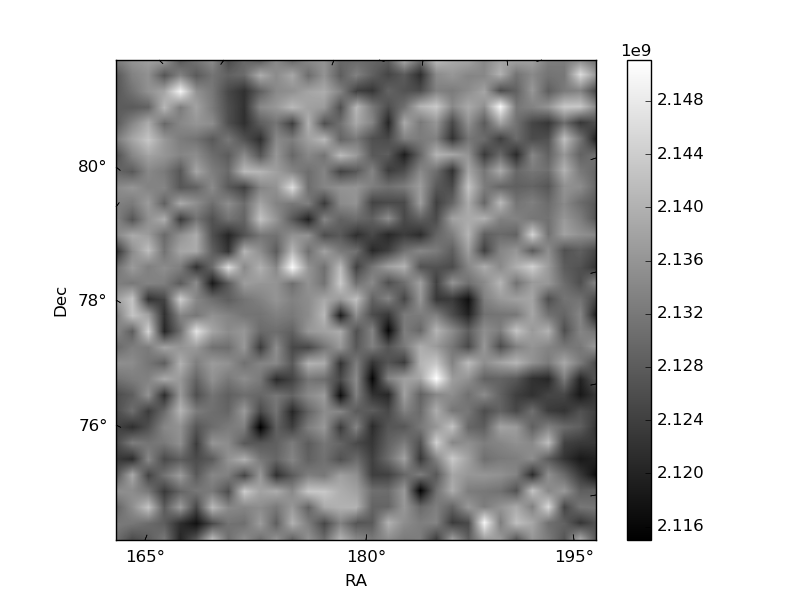
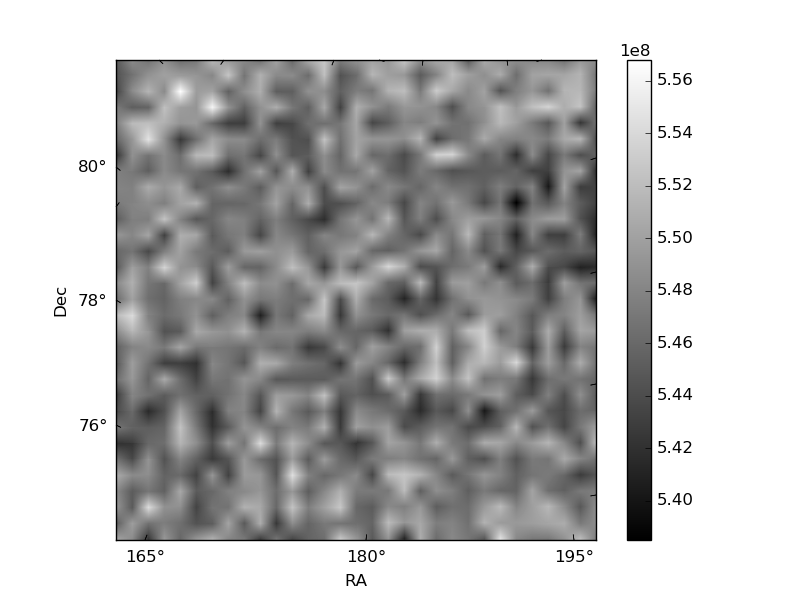
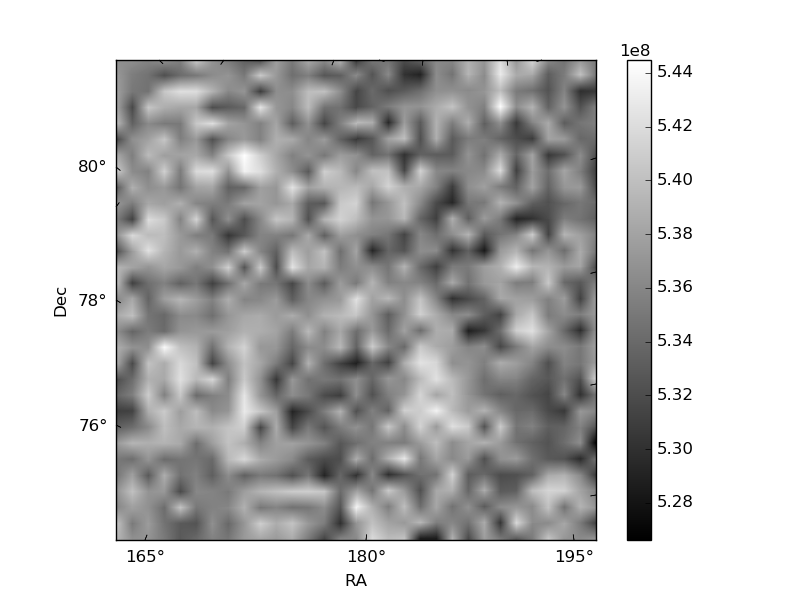
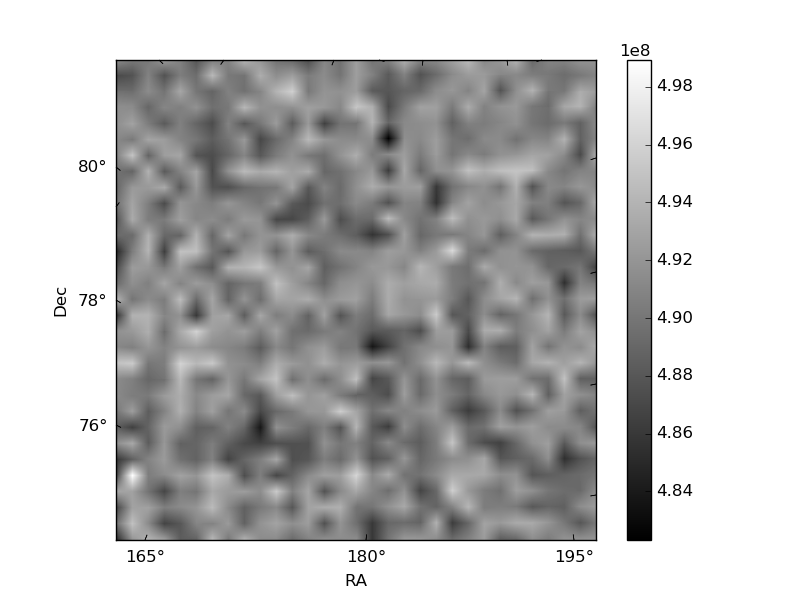
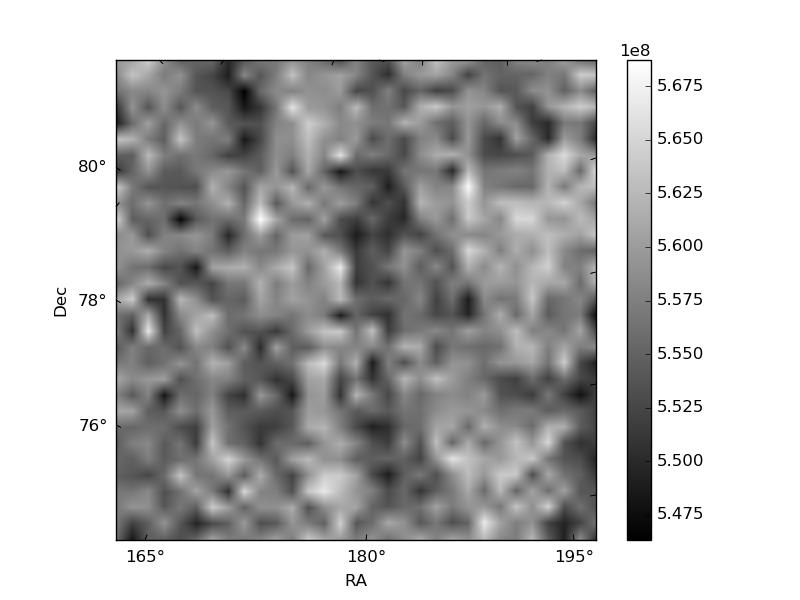
Histogram calculated using DETX and DETY for each event in the final _common_clean file
| Quadrant A | 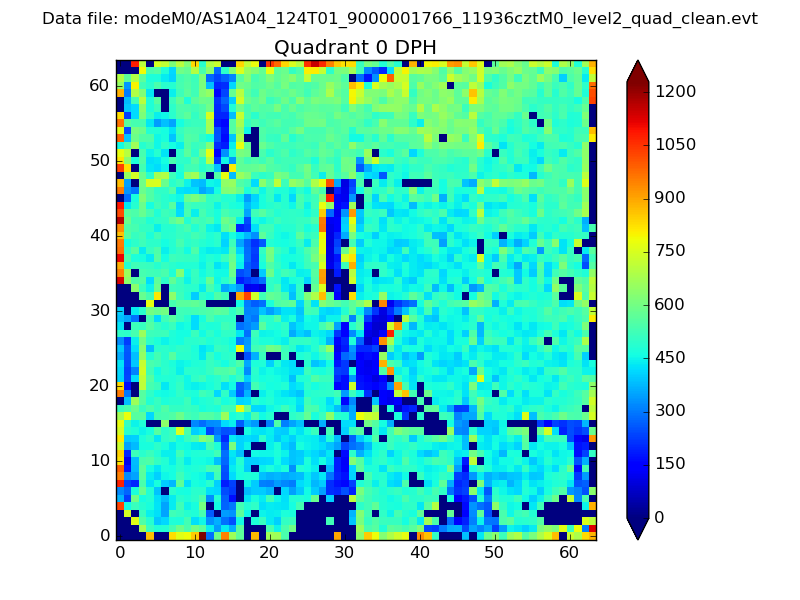 |
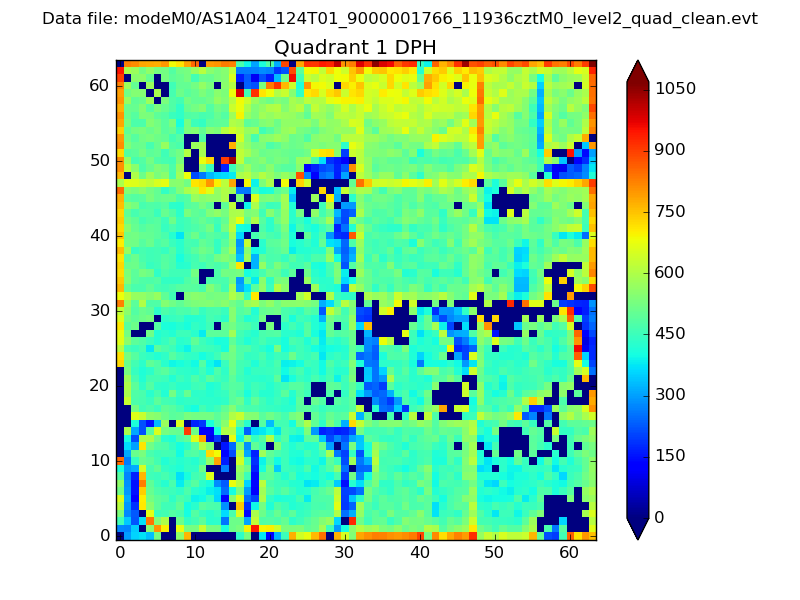 |
Quadrant B |
|---|---|---|---|
| Quadrant D | 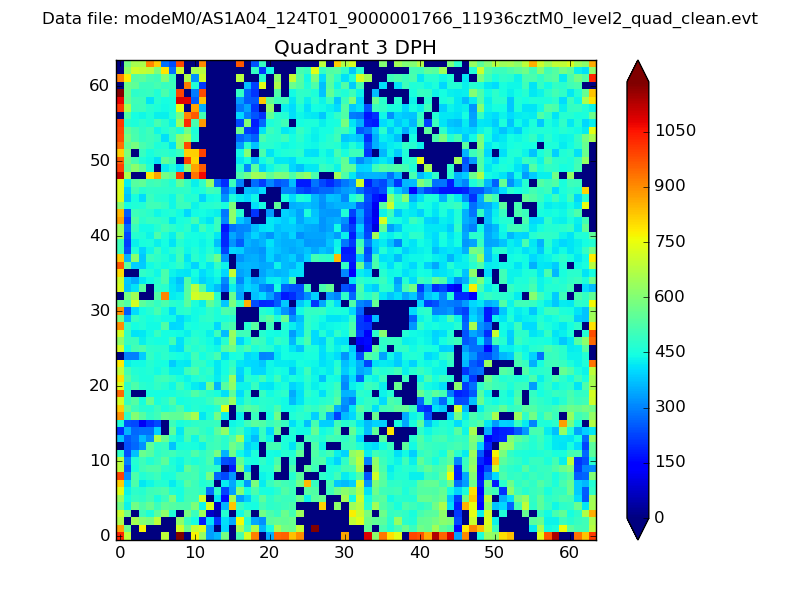 |
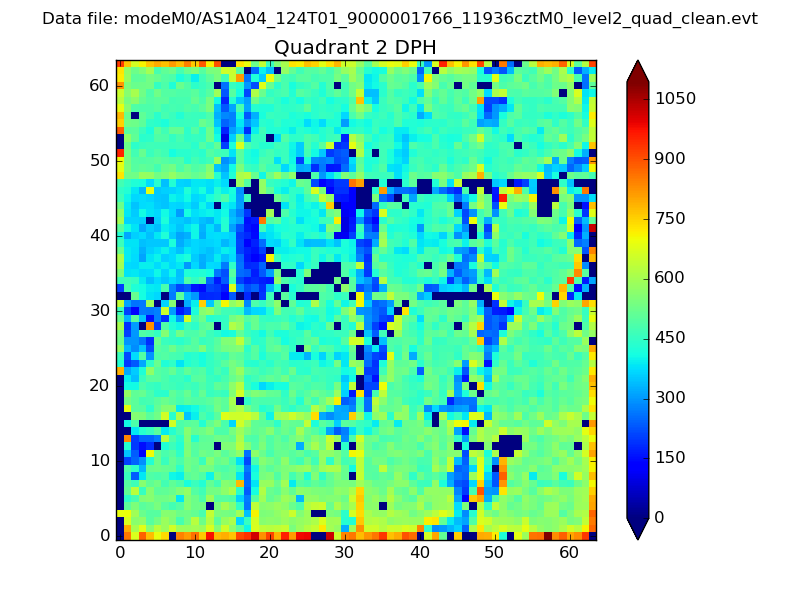 |
Quadrant C |
| Plot type | Count rate plots | Images |
|---|---|---|
| Comparison with Poisson distribution Blue bars denote a histogram of data divided into 1 sec bins. Red curve is a Poisson curve with rate = median count rate of data. |
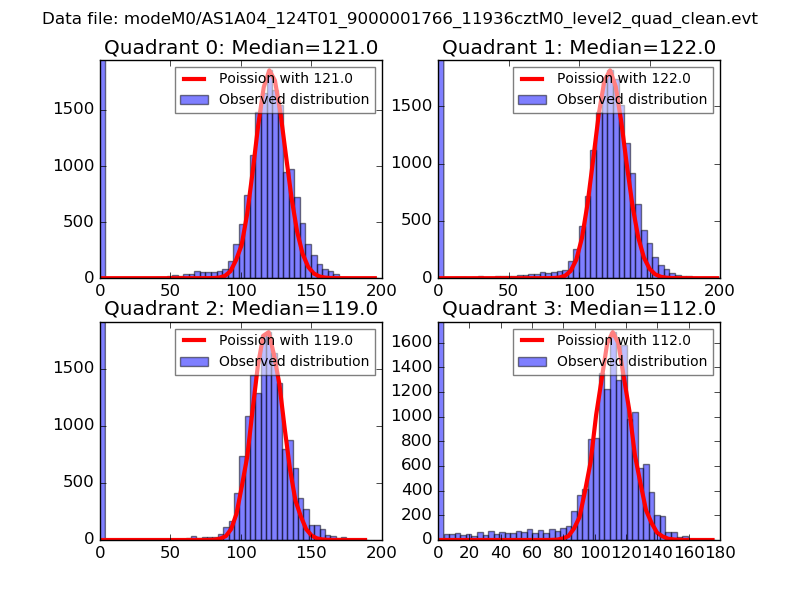 |
 |
| Quadrant-wise count rates Data is divided into 100 sec bins |
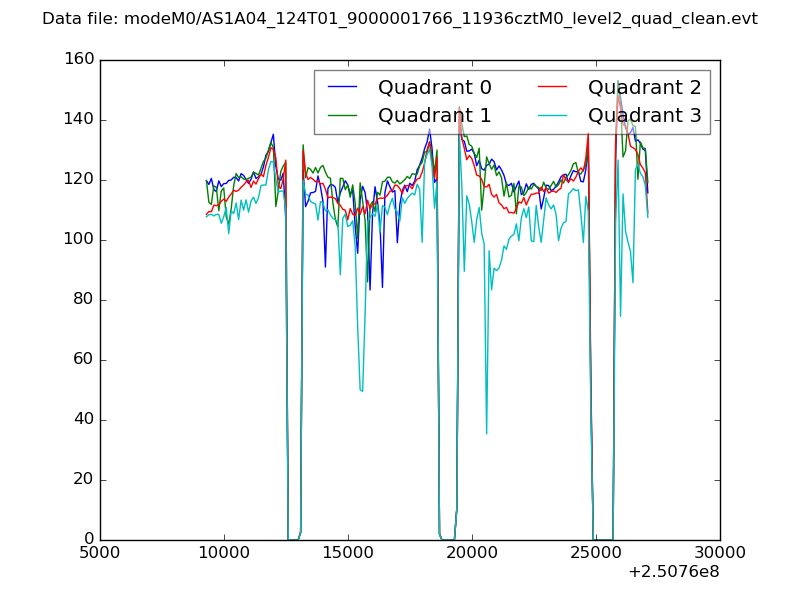 |
|
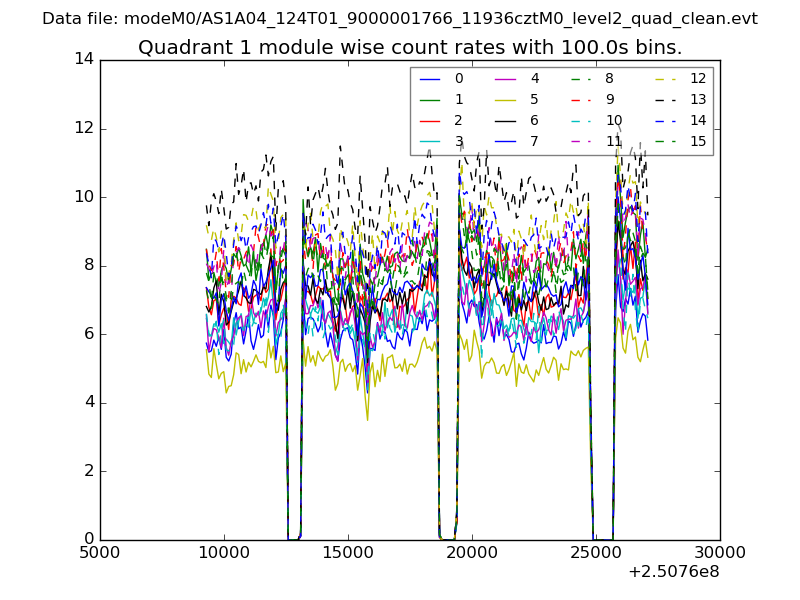
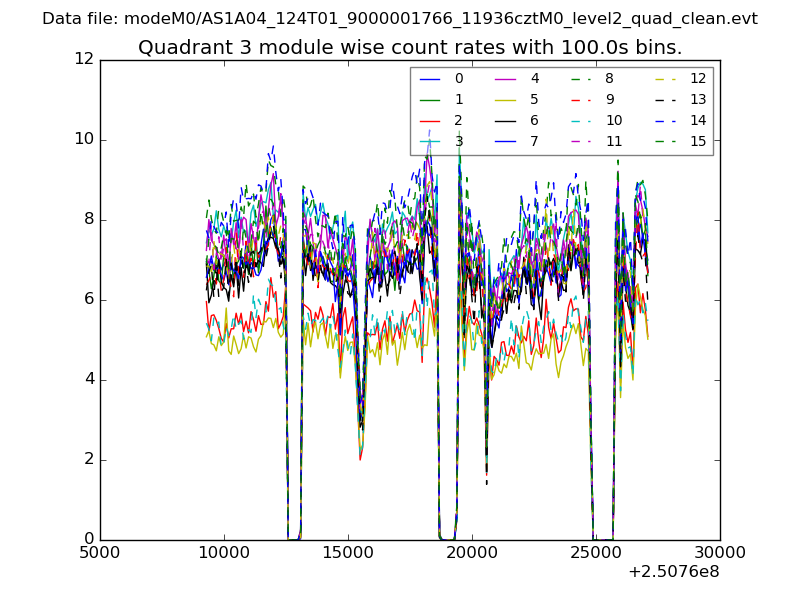
| Module-wise count rates for Quadrant A Data is divided into 100 sec bins |
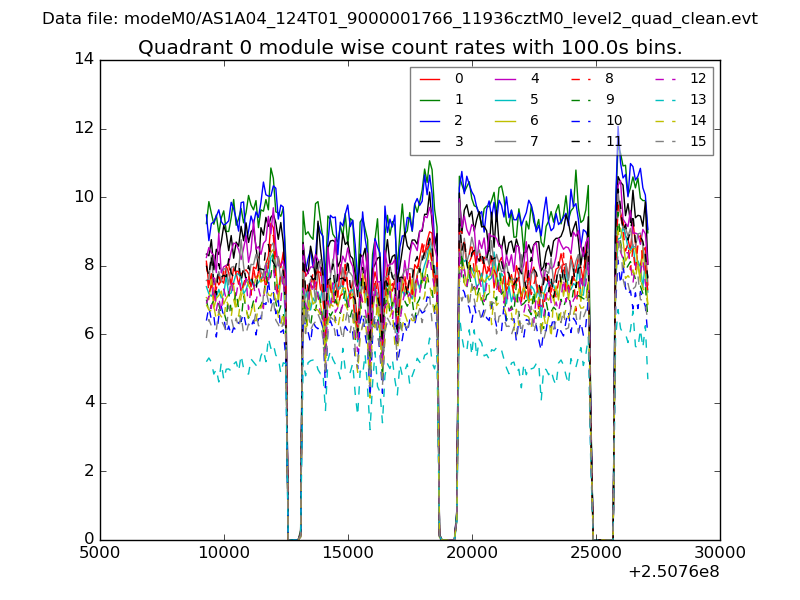 |
 |
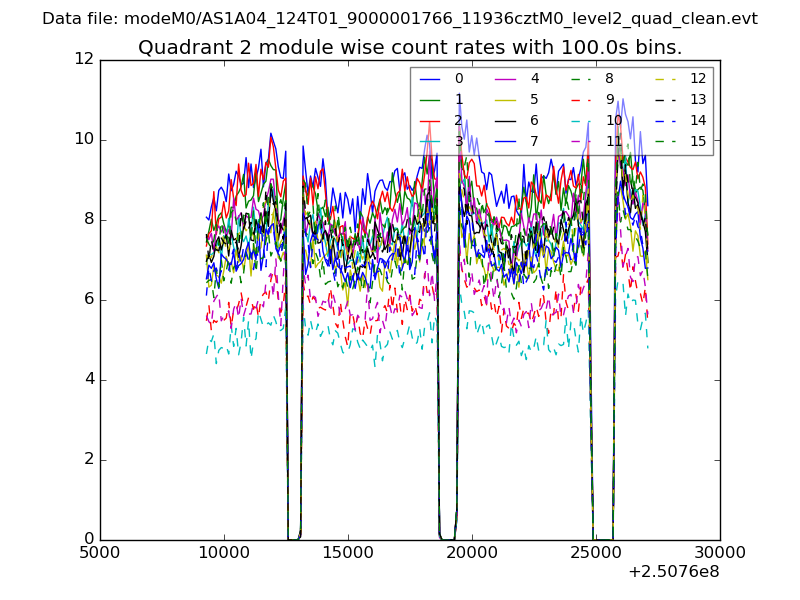
| Module-wise count rates for Quadrant B Data is divided into 100 sec bins |
 |
 |
| Module-wise count rates for Quadrant C Data is divided into 100 sec bins |
 |
 |
| Module-wise count rates for Quadrant D Data is divided into 100 sec bins |
 |
 |
| Parameter | Plot |
|---|---|
| CZT HV Monitor | 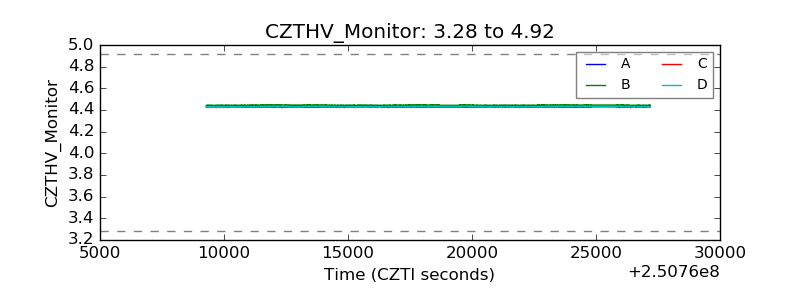 |
| D_VDD | 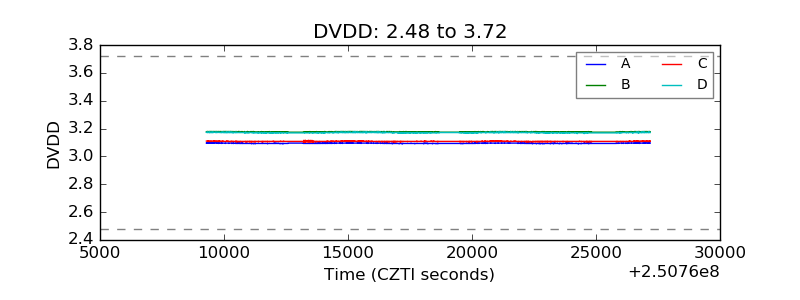 |
| Temperature 1 | 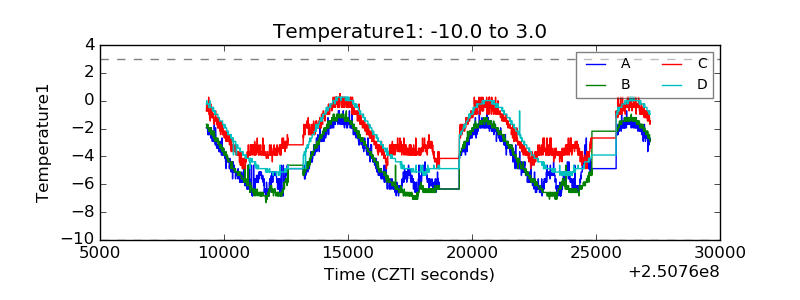 |
| Veto HV Monitor | 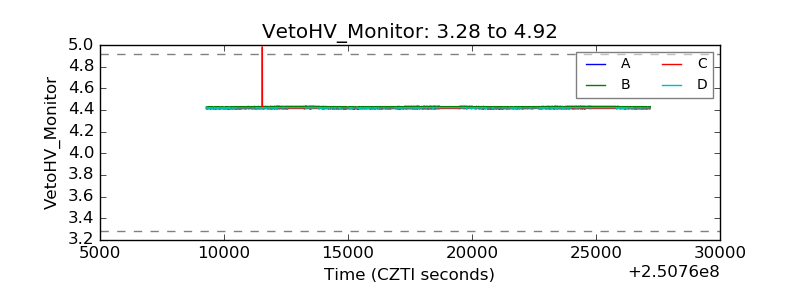 |
| Veto LLD | 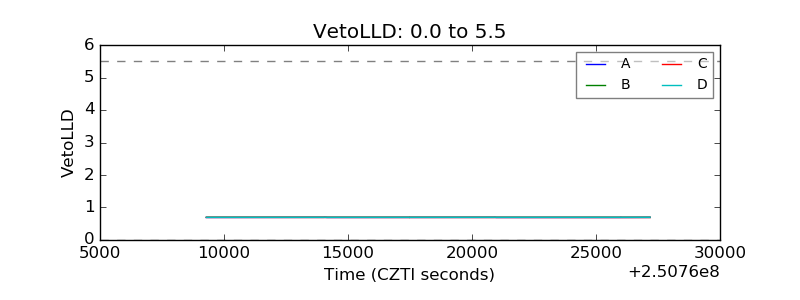 |
| Alpha Counter | 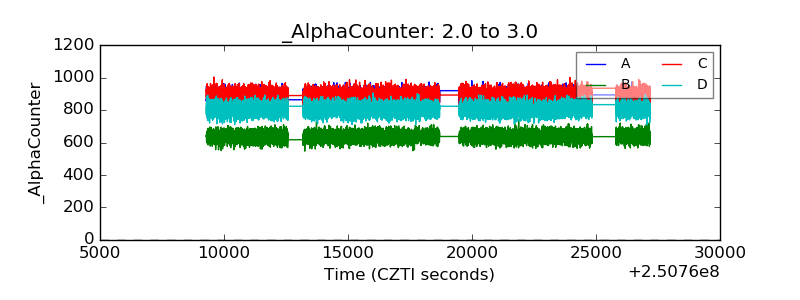 |
| _CPM_Rate | 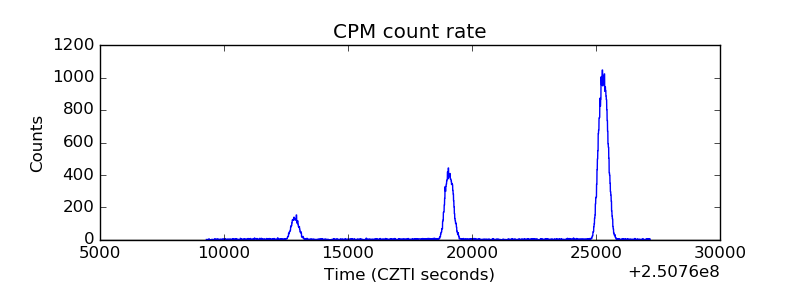 |
| CZT Counter | 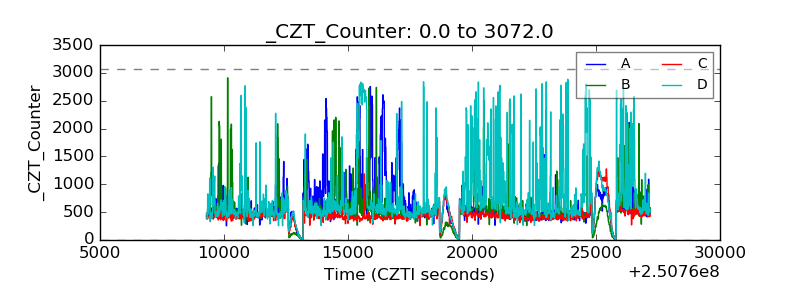 |
| +2.5 Volts monitor |  |
| +5 Volts monitor |  |
| _ROLL_ROT | 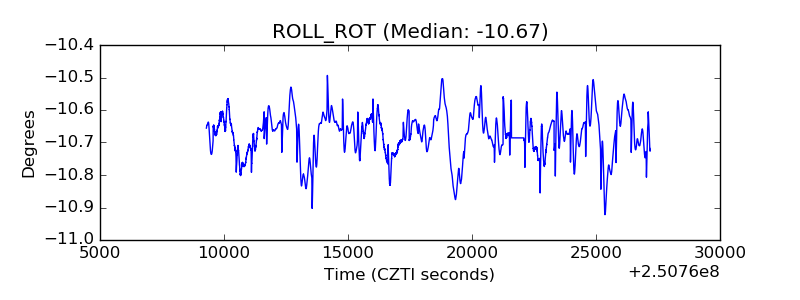 |
| _Roll_DEC | 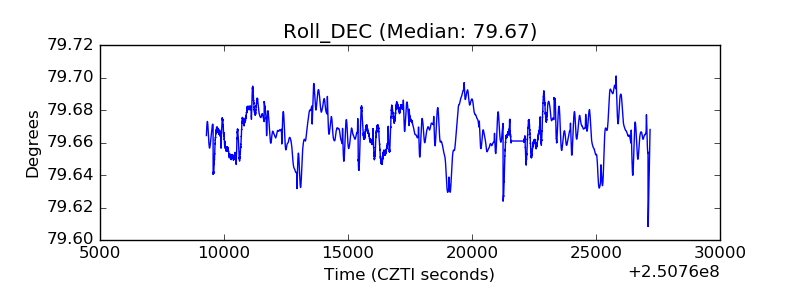 |
| _Roll_RA | 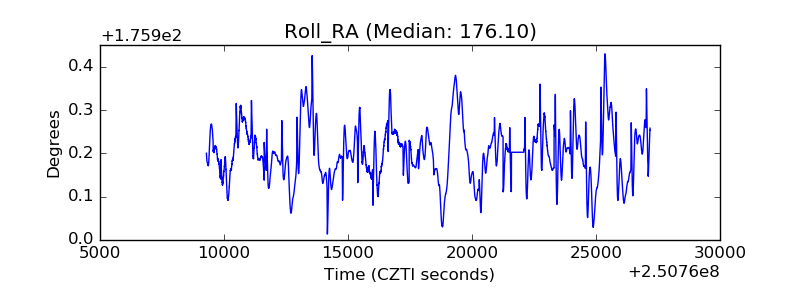 |
| Veto Counter | 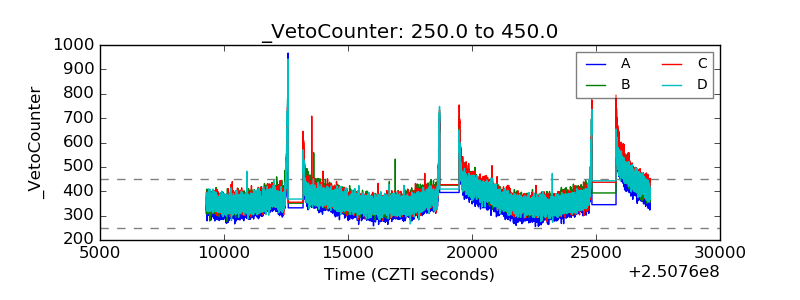 |