| Param | Original file | Final file |
|---|---|---|
| Filename | modeM0/AS1A04_124T01_9000001766_11939cztM0_level2.evt | modeM0/AS1A04_124T01_9000001766_11939cztM0_level2_quad_clean.evt |
| Size (bytes) | 522,561,600 | 125,115,840 |
| Size | 498.4 MB | 119.3 MB |
| Events in quadrant A | 3,285,051 | 853,482 |
| Events in quadrant B | 4,680,117 | 846,090 |
| Events in quadrant C | 3,019,843 | 852,647 |
| Events in quadrant D | 4,412,586 | 796,462 |
| Mode SS | |||
|---|---|---|---|
| Quadrant | BADHDUFLAG | Total packets | Discarded packets |
| A | 0 | 128 | 0 |
| B | 0 | 128 | 0 |
| C | 0 | 128 | 0 |
| D | 0 | 128 | 0 |
| Mode M9 | |||
|---|---|---|---|
| Quadrant | BADHDUFLAG | Total packets | Discarded packets |
| A | 0 | 12 | 0 |
| B | 0 | 12 | 0 |
| C | 0 | 12 | 0 |
| D | 0 | 12 | 0 |
| Mode M0 | |||
|---|---|---|---|
| Quadrant | BADHDUFLAG | Total packets | Discarded packets |
| A | 0 | 14071 | 2 |
| B | 0 | 18340 | 1 |
| C | 0 | 13323 | 1 |
| D | 0 | 17474 | 1 |
| Quadrant | Total seconds | Saturated seconds | Saturation percentage |
|---|---|---|---|
| A | 6316 | 74 | 1.171628% |
| B | 6316 | 424 | 6.713110% |
| C | 6316 | 58 | 0.918303% |
| D | 6316 | 261 | 4.132362% |
Noise dominated data is calculated using 1-second bins in cleaned event files. If a bin has >2000 counts, and if more than 50% of those come from <1% of pixels, then it is considered to be noise-dominated and hence unusable.
| Quadrant | # 1 sec bins | Bins with >0 counts | Bins with >2000 counts | High rate bins dominated by noise | Noise dominated (total time) | Noise dominated (detector-on time) | Marked lightcurve |
|---|---|---|---|---|---|---|---|
| A | 7512 | 6317 | 0 | 0 | 0.00% | 0.00% | 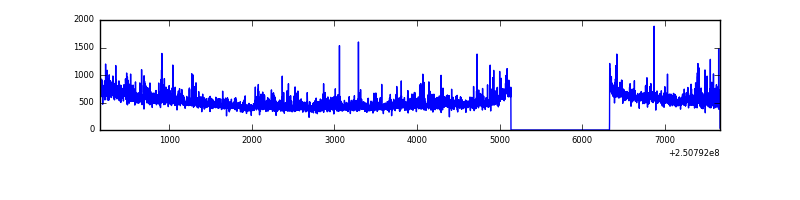 |
| B | 7512 | 6317 | 249 | 249 | 3.31% | 3.94% | 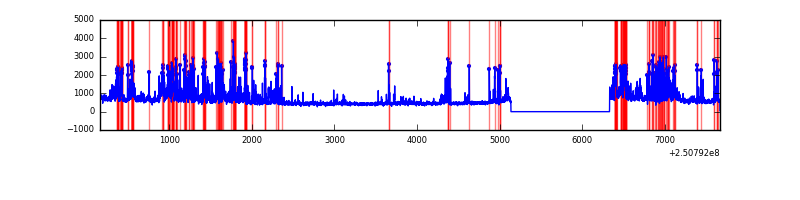 |
| C | 7512 | 6317 | 7 | 7 | 0.09% | 0.11% | 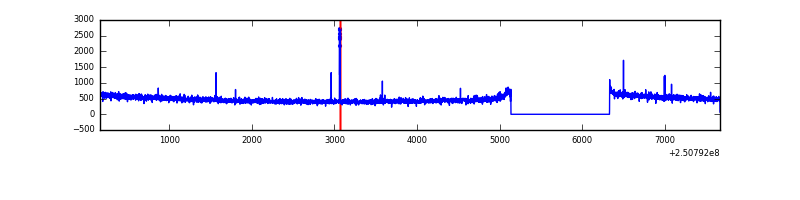 |
| D | 7512 | 6317 | 201 | 201 | 2.68% | 3.18% | 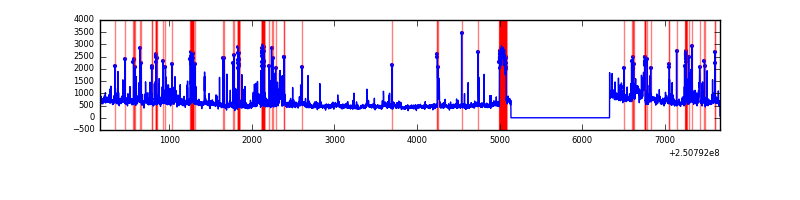 |
Top three noisy pixels from each quadrant. If the there are fewer than three noisy pixels in the level2.evt file, extra rows are filled as -1
| Pixel properties | Quadrant properties | ||||||
|---|---|---|---|---|---|---|---|
| Quadrant | DetID | PixID | Counts | Sigma | Mean | Median | Sigma |
| A | 1 | 162 | 97612 | 629.0 | 770 | 756 | 154.0 |
| A | 1 | 178 | 51694 | 330.8 | 770 | 756 | 154.0 |
| A | 7 | 144 | 46935 | 299.9 | 770 | 756 | 154.0 |
| B | 4 | 239 | 603603 | 4296.3 | 759 | 742 | 140.3 |
| B | 3 | 64 | 516588 | 3676.19 | 759 | 742 | 140.3 |
| B | 15 | 204 | 272248 | 1934.89 | 759 | 742 | 140.3 |
| C | 0 | 10 | 32691 | 184.62 | 758 | 762 | 172.9 |
| C | 12 | 4 | 22465 | 125.49 | 758 | 762 | 172.9 |
| C | 13 | 61 | 5726 | 28.7 | 758 | 762 | 172.9 |
| D | 1 | 52 | 698908 | 3982.47 | 742 | 723 | 175.3 |
| D | 8 | 195 | 407310 | 2319.19 | 742 | 723 | 175.3 |
| D | 13 | 122 | 249822 | 1420.87 | 742 | 723 | 175.3 |
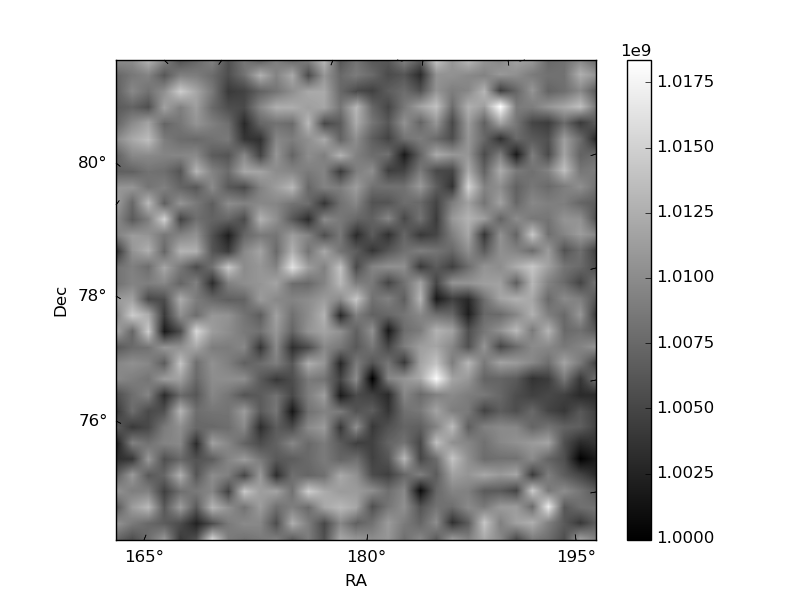
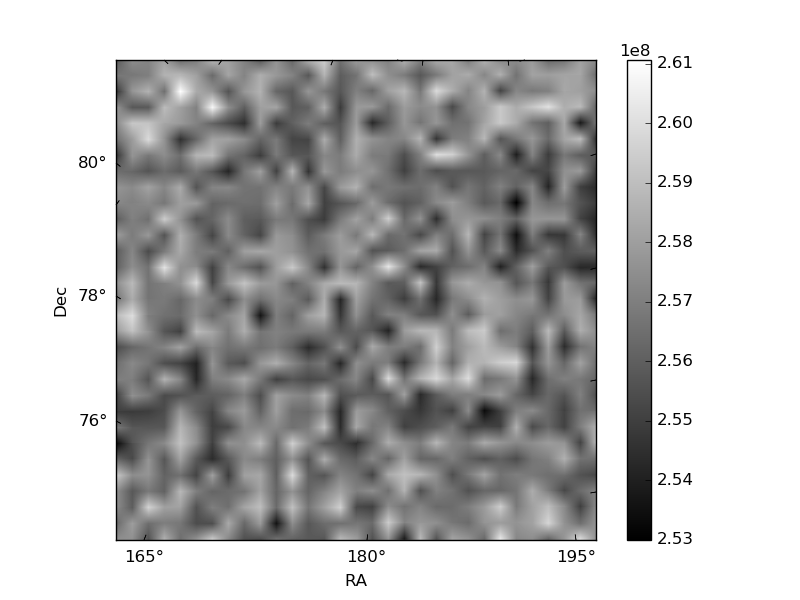
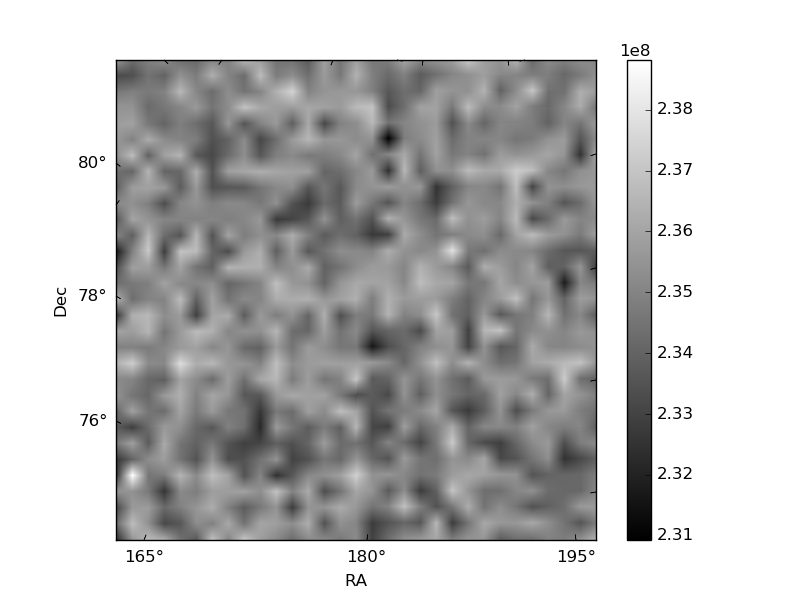
Histogram calculated using DETX and DETY for each event in the final _common_clean file
| Quadrant A | 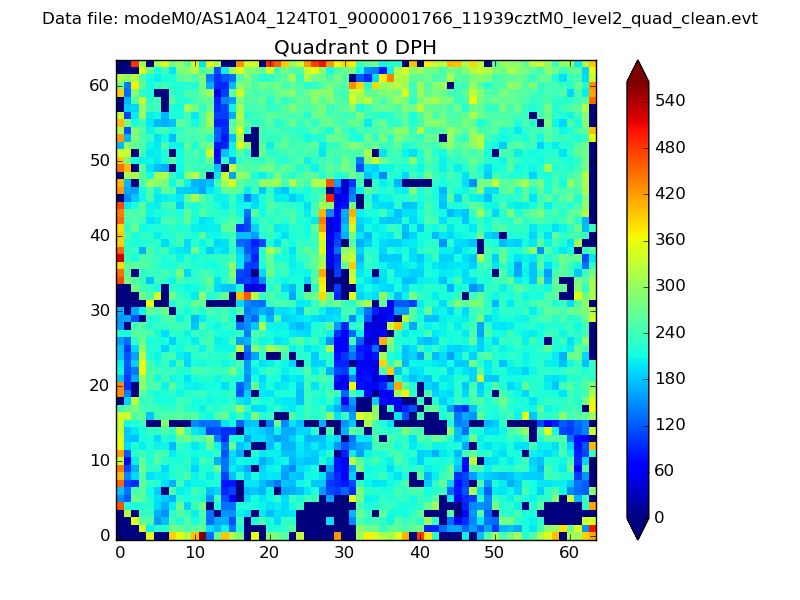 |
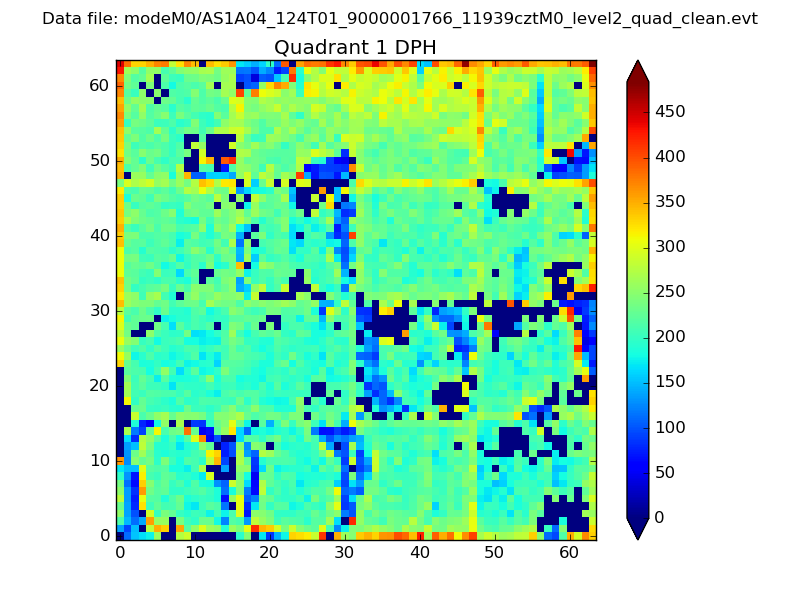 |
Quadrant B |
|---|---|---|---|
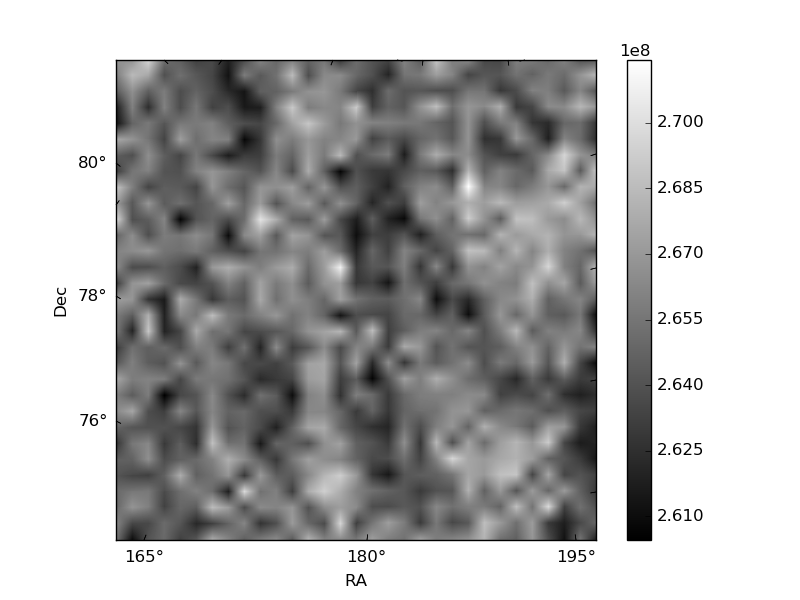
| Quadrant D | 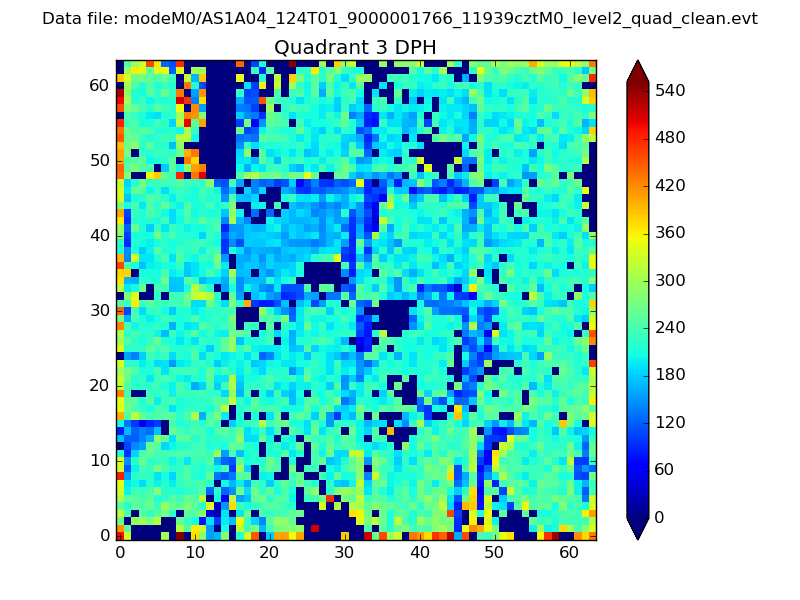 |
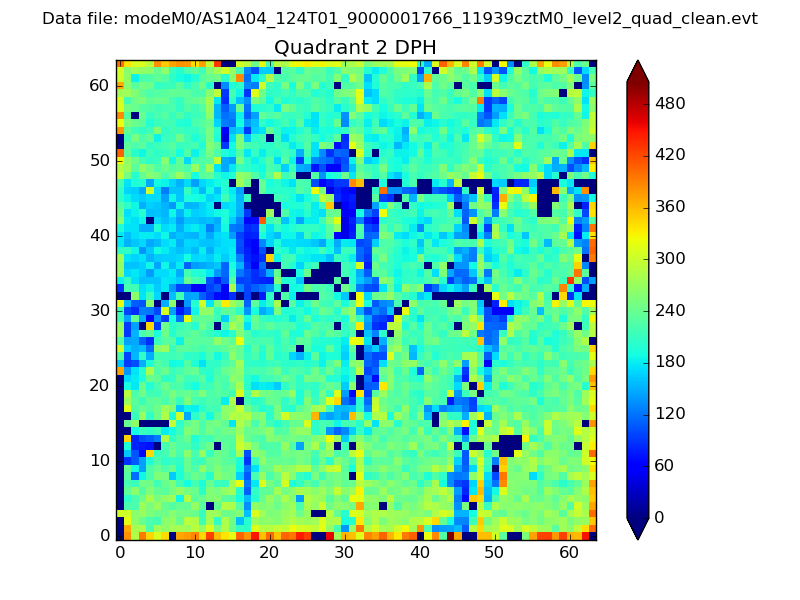 |
Quadrant C |
| Plot type | Count rate plots | Images |
|---|---|---|
| Comparison with Poisson distribution Blue bars denote a histogram of data divided into 1 sec bins. Red curve is a Poisson curve with rate = median count rate of data. |
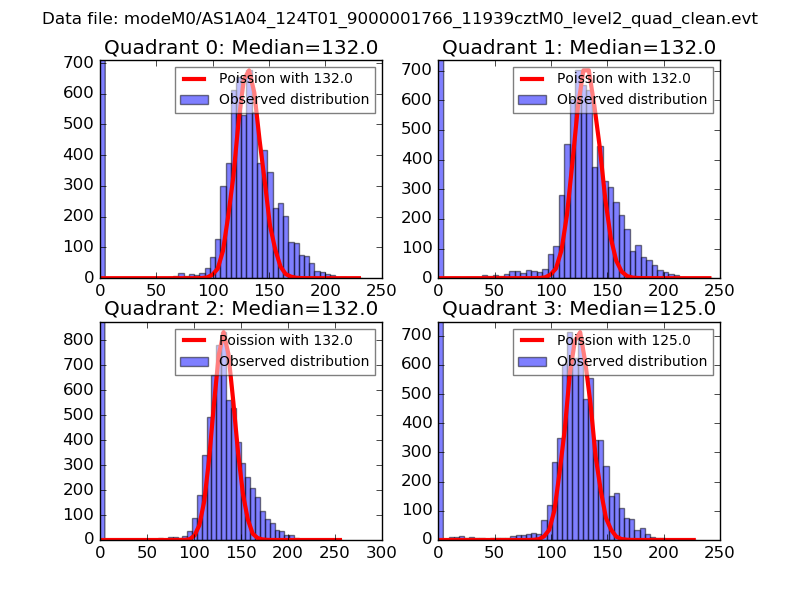 |
 |
| Quadrant-wise count rates Data is divided into 100 sec bins |
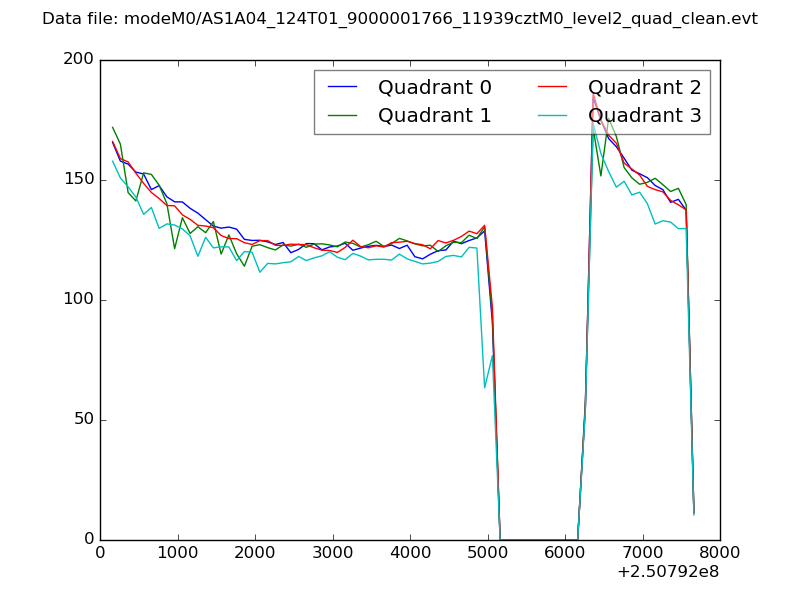 |
|
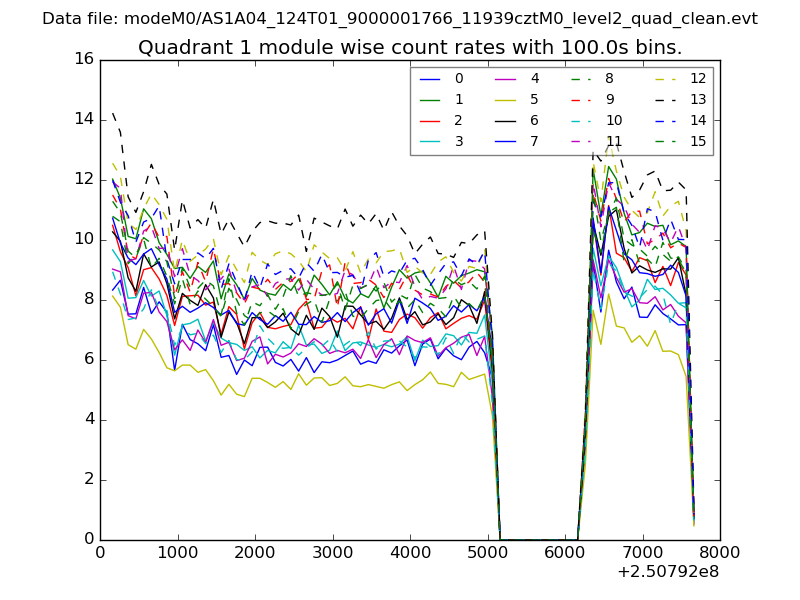
| Module-wise count rates for Quadrant A Data is divided into 100 sec bins |
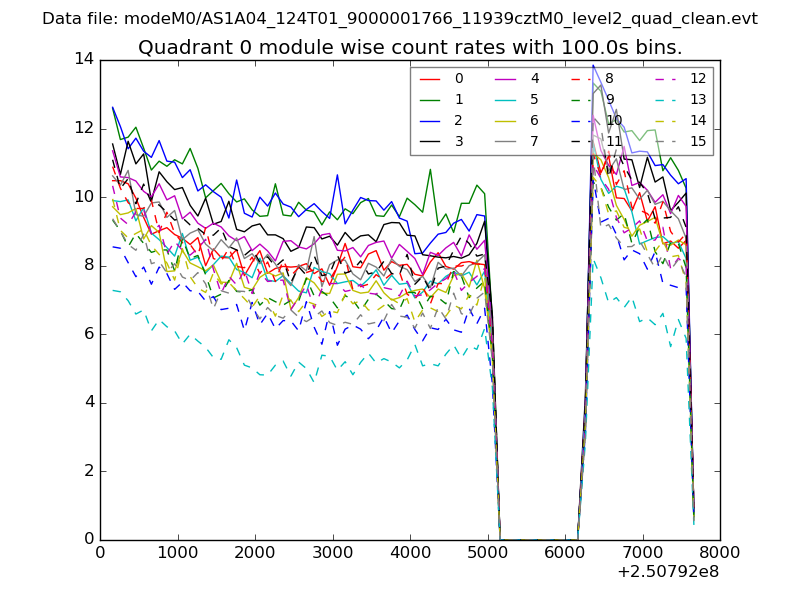 |
 |
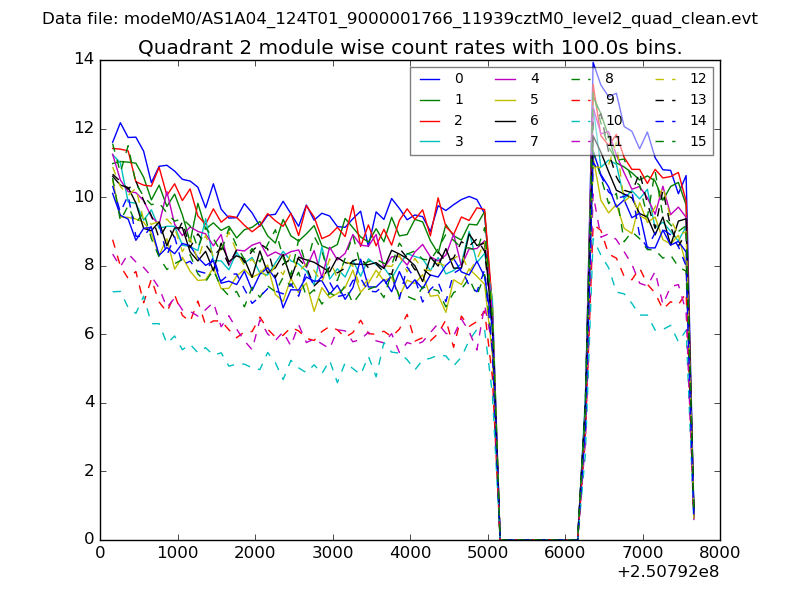
| Module-wise count rates for Quadrant B Data is divided into 100 sec bins |
 |
 |
| Module-wise count rates for Quadrant C Data is divided into 100 sec bins |
 |
 |
| Module-wise count rates for Quadrant D Data is divided into 100 sec bins |
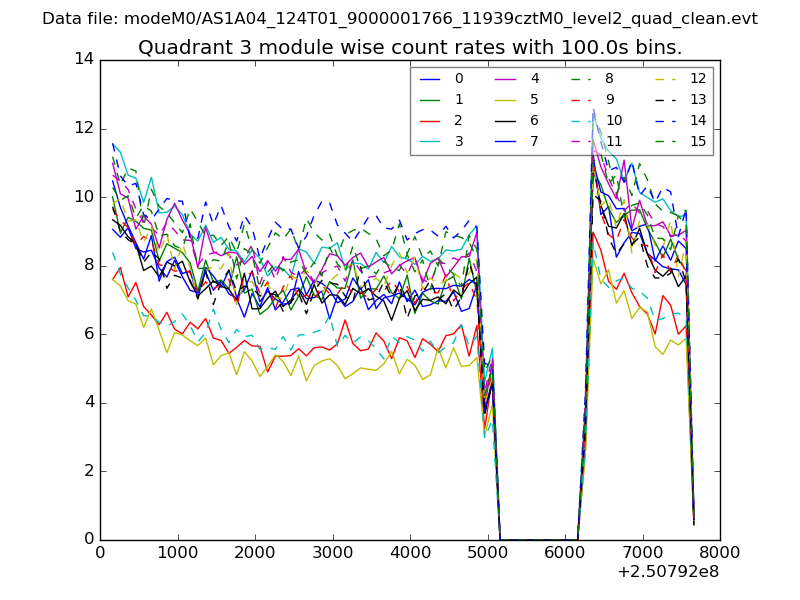 |
 |
| Parameter | Plot |
|---|---|
| CZT HV Monitor | 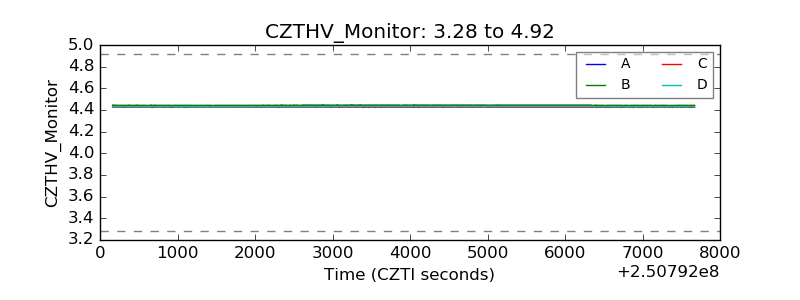 |
| D_VDD |  |
| Temperature 1 |  |
| Veto HV Monitor | 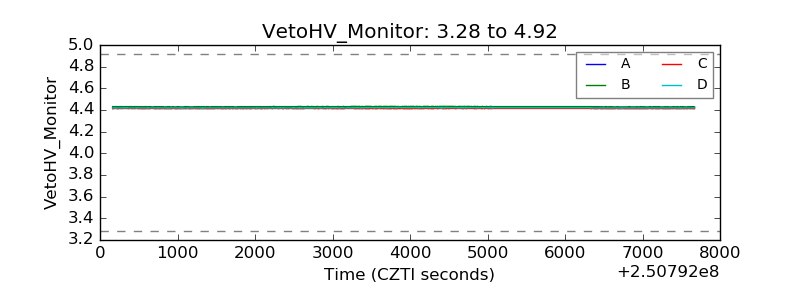 |
| Veto LLD | 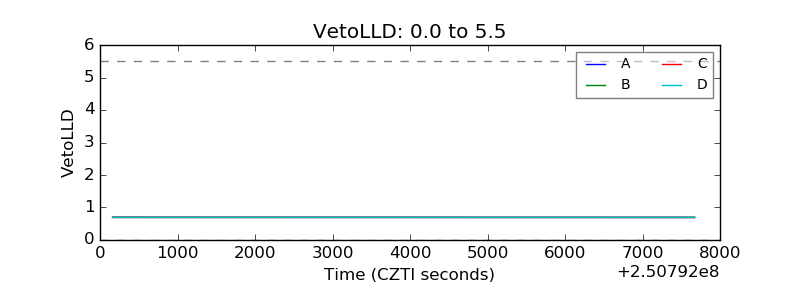 |
| Alpha Counter | 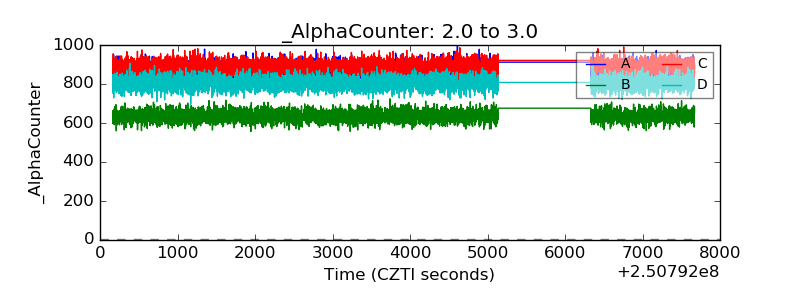 |
| _CPM_Rate | 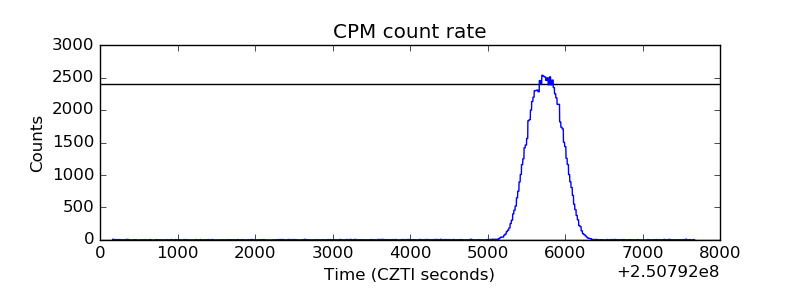 |
| CZT Counter | 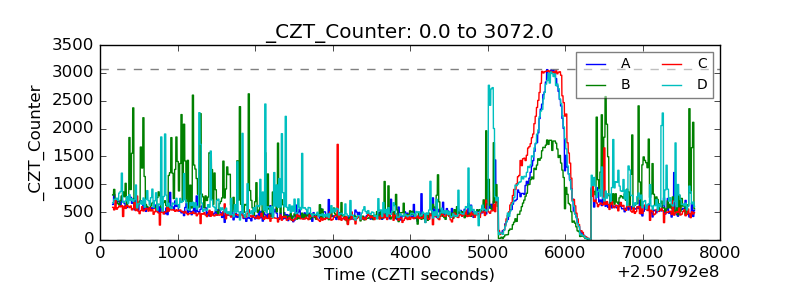 |
| +2.5 Volts monitor |  |
| +5 Volts monitor |  |
| _ROLL_ROT | 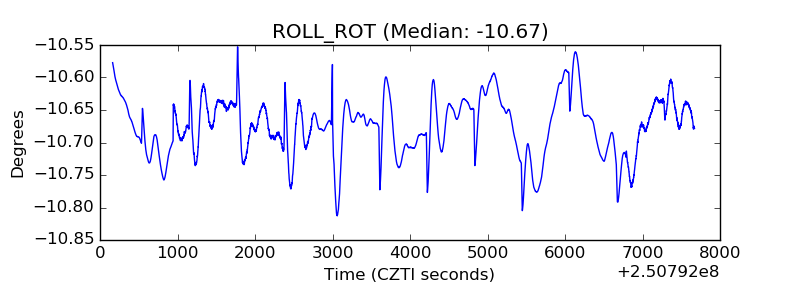 |
| _Roll_DEC | 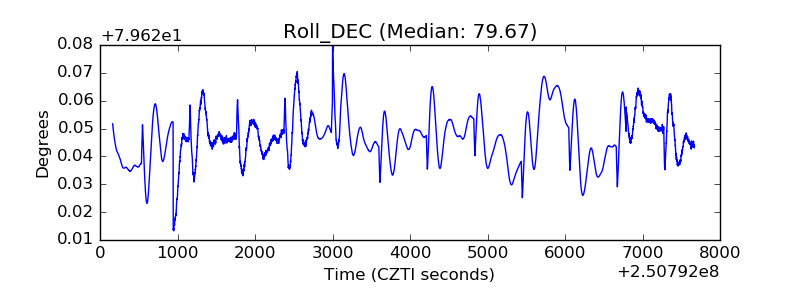 |
| _Roll_RA | 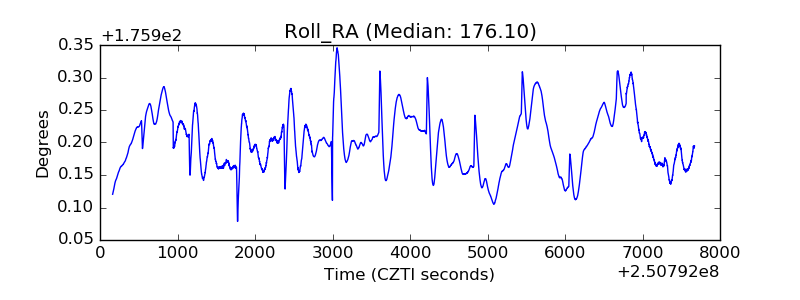 |
| Veto Counter | 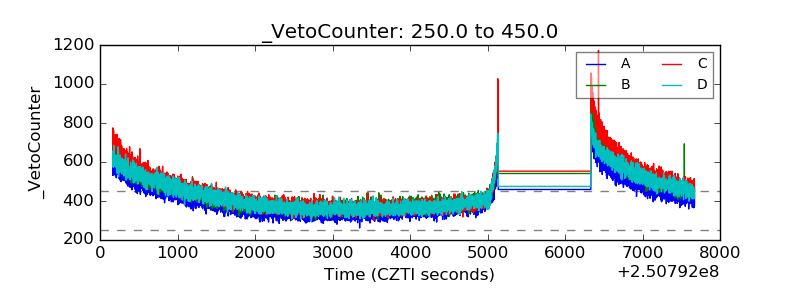 |