| Param | Original file | Final file |
|---|---|---|
| Filename | modeM0/AS1A04_124T01_9000001766_11940cztM0_level2.evt | modeM0/AS1A04_124T01_9000001766_11940cztM0_level2_quad_clean.evt |
| Size (bytes) | 503,786,880 | 124,300,800 |
| Size | 480.4 MB | 118.5 MB |
| Events in quadrant A | 3,215,382 | 842,360 |
| Events in quadrant B | 4,120,345 | 847,791 |
| Events in quadrant C | 2,945,765 | 851,888 |
| Events in quadrant D | 4,561,588 | 796,195 |
| Mode SS | |||
|---|---|---|---|
| Quadrant | BADHDUFLAG | Total packets | Discarded packets |
| A | 0 | 124 | 0 |
| B | 0 | 124 | 0 |
| C | 0 | 124 | 0 |
| D | 0 | 124 | 0 |
| Mode M9 | |||
|---|---|---|---|
| Quadrant | BADHDUFLAG | Total packets | Discarded packets |
| A | 0 | 13 | 0 |
| B | 0 | 13 | 0 |
| C | 0 | 13 | 0 |
| D | 0 | 13 | 0 |
| Mode M0 | |||
|---|---|---|---|
| Quadrant | BADHDUFLAG | Total packets | Discarded packets |
| A | 0 | 13695 | 3 |
| B | 0 | 16400 | 2 |
| C | 0 | 12954 | 2 |
| D | 0 | 17933 | 2 |
| Quadrant | Total seconds | Saturated seconds | Saturation percentage |
|---|---|---|---|
| A | 6107 | 71 | 1.162600% |
| B | 6107 | 337 | 5.518258% |
| C | 6107 | 39 | 0.638611% |
| D | 6107 | 182 | 2.980187% |
Noise dominated data is calculated using 1-second bins in cleaned event files. If a bin has >2000 counts, and if more than 50% of those come from <1% of pixels, then it is considered to be noise-dominated and hence unusable.
| Quadrant | # 1 sec bins | Bins with >0 counts | Bins with >2000 counts | High rate bins dominated by noise | Noise dominated (total time) | Noise dominated (detector-on time) | Marked lightcurve |
|---|---|---|---|---|---|---|---|
| A | 7418 | 6108 | 1 | 1 | 0.01% | 0.02% | 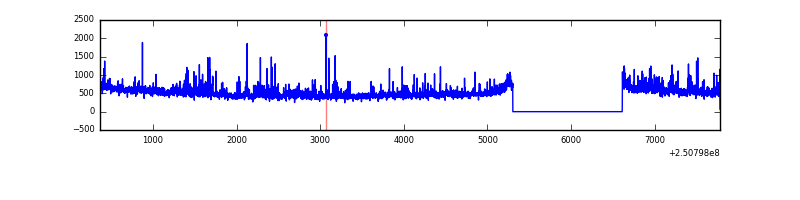 |
| B | 7418 | 6108 | 184 | 184 | 2.48% | 3.01% | 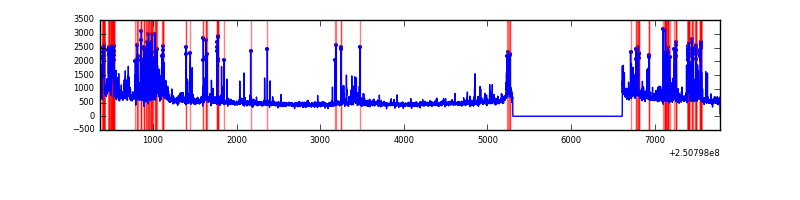 |
| C | 7418 | 6108 | 1 | 1 | 0.01% | 0.02% | 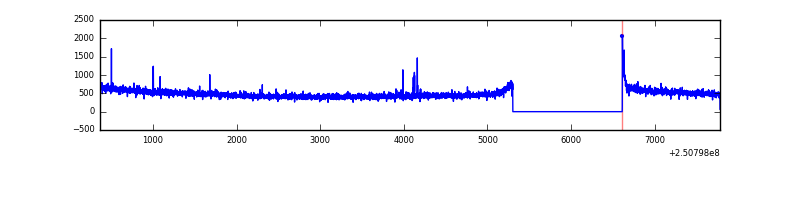 |
| D | 7418 | 6108 | 87 | 87 | 1.17% | 1.42% | 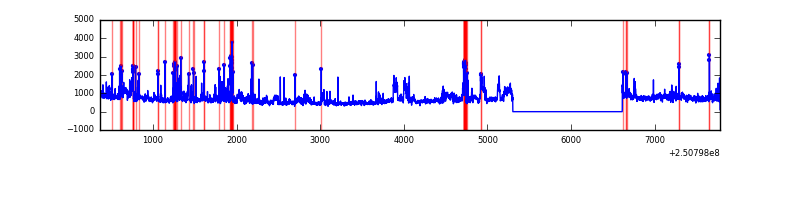 |
Top three noisy pixels from each quadrant. If the there are fewer than three noisy pixels in the level2.evt file, extra rows are filled as -1
| Pixel properties | Quadrant properties | ||||||
|---|---|---|---|---|---|---|---|
| Quadrant | DetID | PixID | Counts | Sigma | Mean | Median | Sigma |
| A | 1 | 162 | 115676 | 765.49 | 749 | 735 | 150.2 |
| A | 1 | 178 | 61522 | 404.83 | 749 | 735 | 150.2 |
| A | 1 | 161 | 54090 | 355.33 | 749 | 735 | 150.2 |
| B | 4 | 239 | 488133 | 3576.92 | 745 | 727 | 136.3 |
| B | 3 | 64 | 240538 | 1759.9 | 745 | 727 | 136.3 |
| B | 15 | 204 | 220532 | 1613.08 | 745 | 727 | 136.3 |
| C | 0 | 10 | 35867 | 207.63 | 744 | 747 | 169.1 |
| C | 13 | 61 | 5713 | 29.36 | 744 | 747 | 169.1 |
| C | 0 | 207 | 3792 | 18.0 | 744 | 747 | 169.1 |
| D | 13 | 122 | 654810 | 3828.25 | 729 | 709 | 170.9 |
| D | 1 | 52 | 636078 | 3718.62 | 729 | 709 | 170.9 |
| D | 8 | 195 | 361632 | 2112.37 | 729 | 709 | 170.9 |
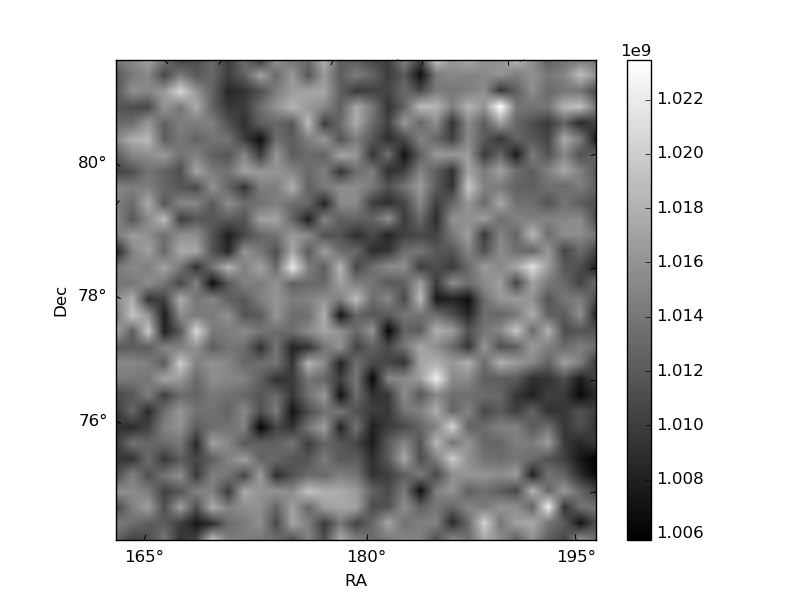
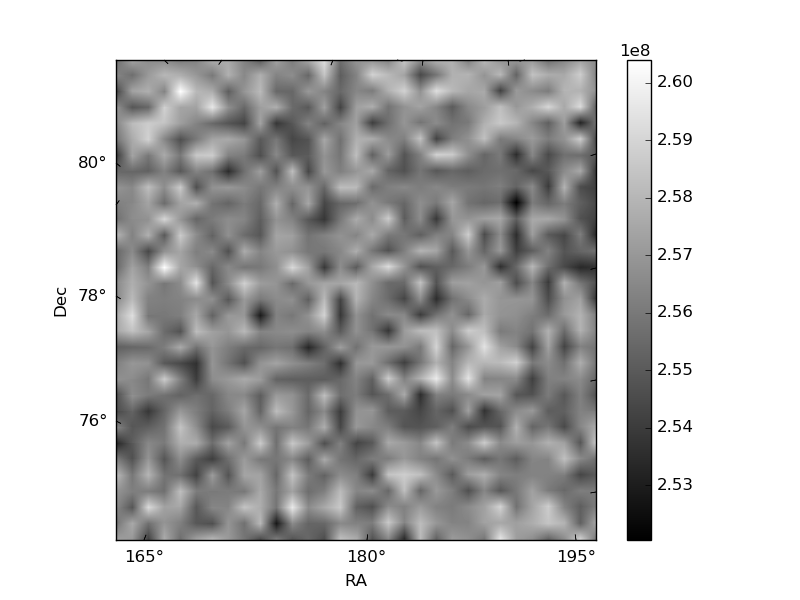
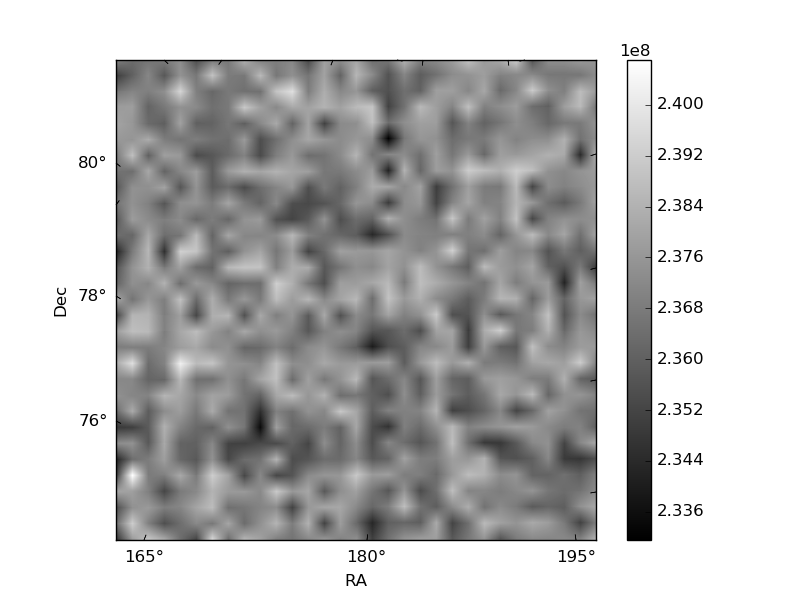
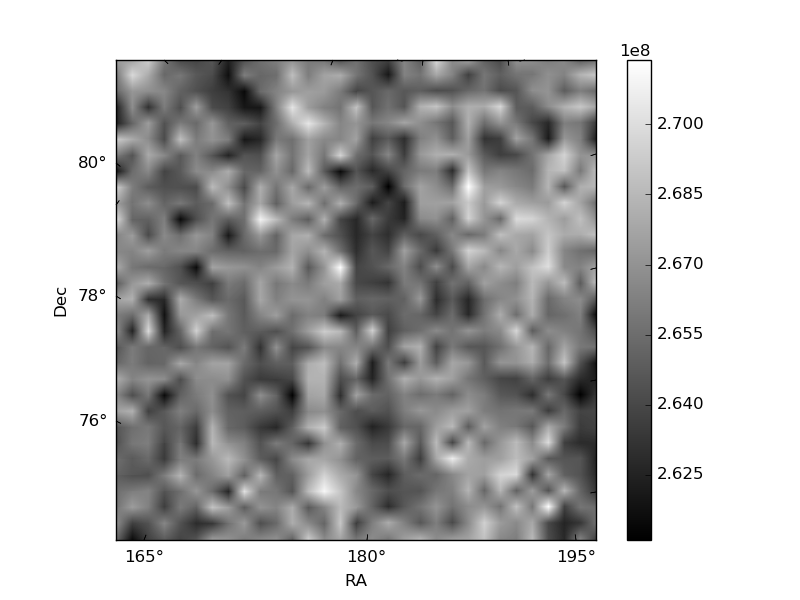
Histogram calculated using DETX and DETY for each event in the final _common_clean file
| Quadrant A | 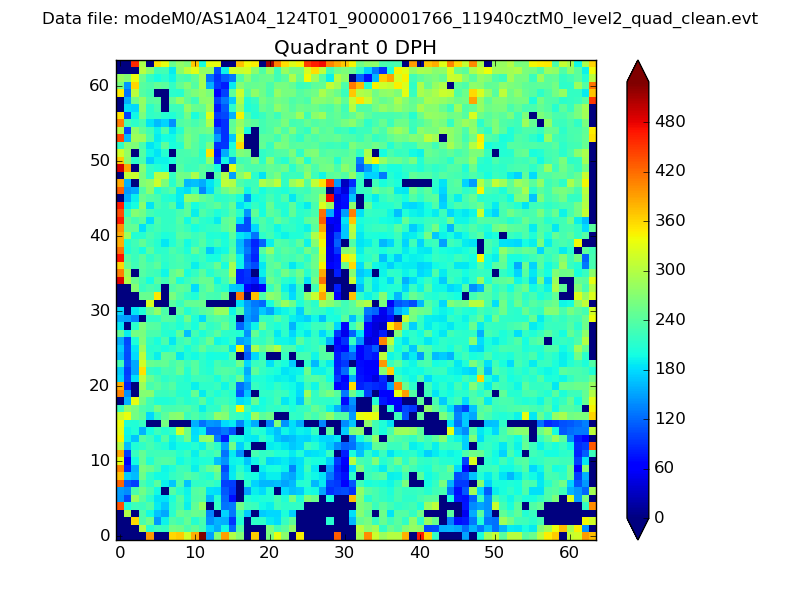 |
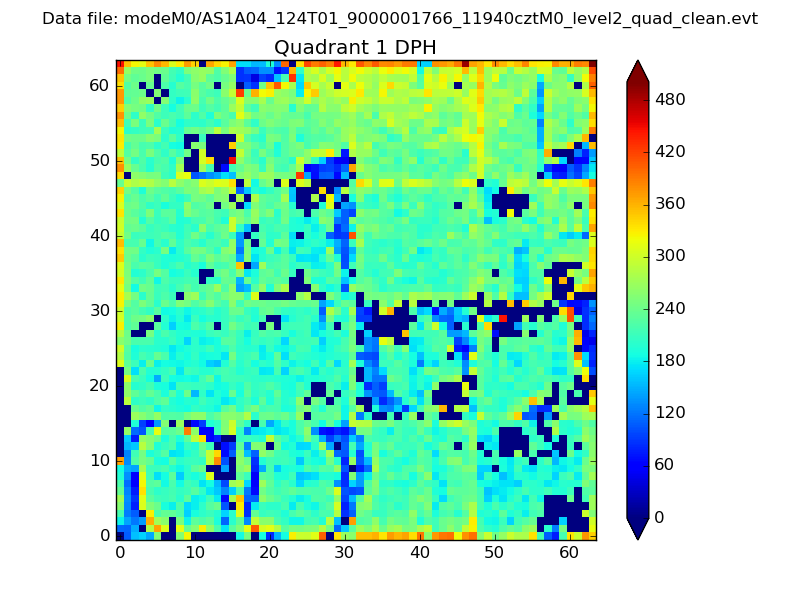 |
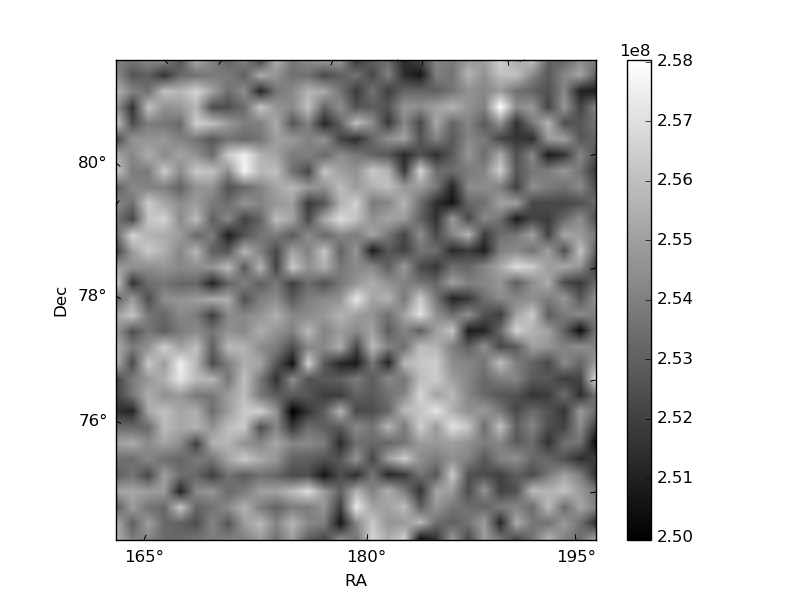
Quadrant B |
|---|---|---|---|
| Quadrant D | 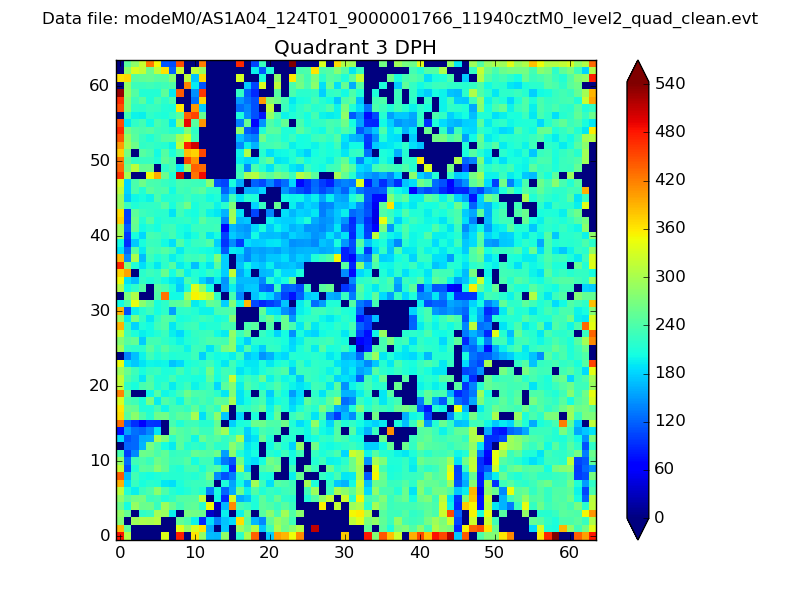 |
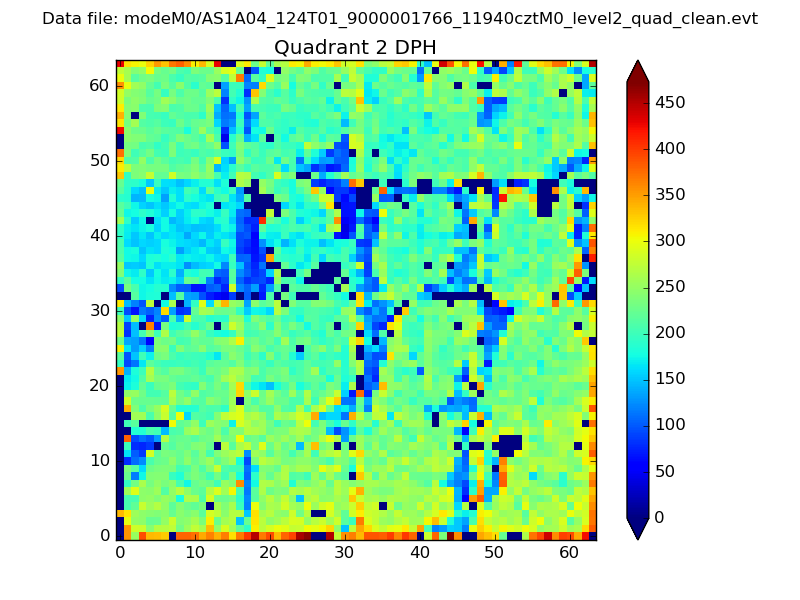 |
Quadrant C |
| Plot type | Count rate plots | Images |
|---|---|---|
| Comparison with Poisson distribution Blue bars denote a histogram of data divided into 1 sec bins. Red curve is a Poisson curve with rate = median count rate of data. |
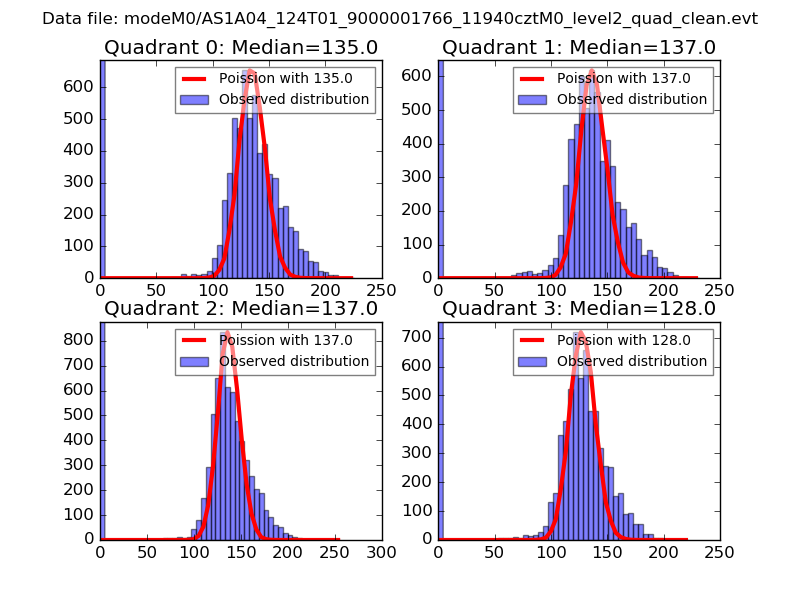 |
 |
| Quadrant-wise count rates Data is divided into 100 sec bins |
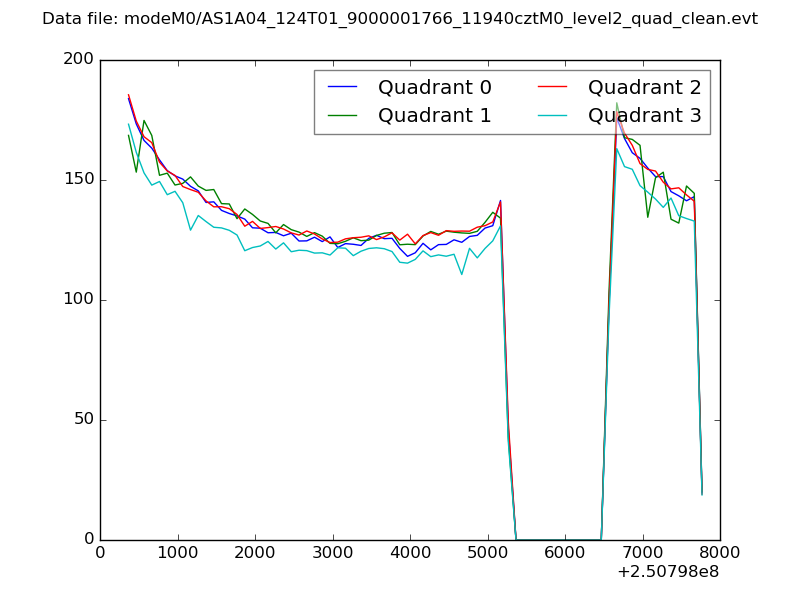 |
|
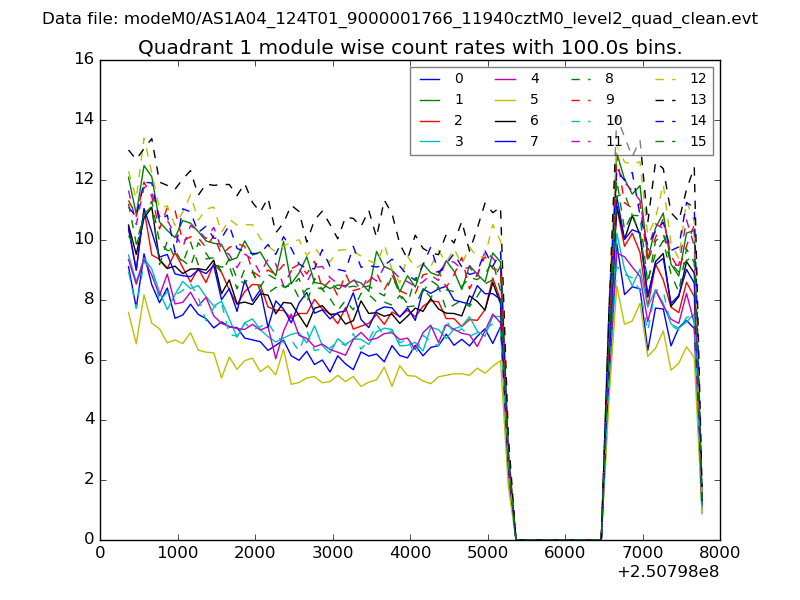
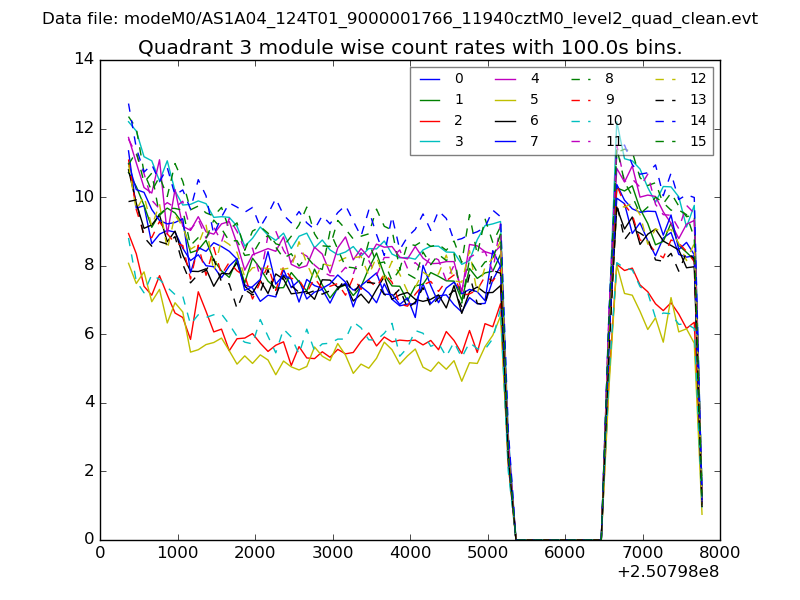
| Module-wise count rates for Quadrant A Data is divided into 100 sec bins |
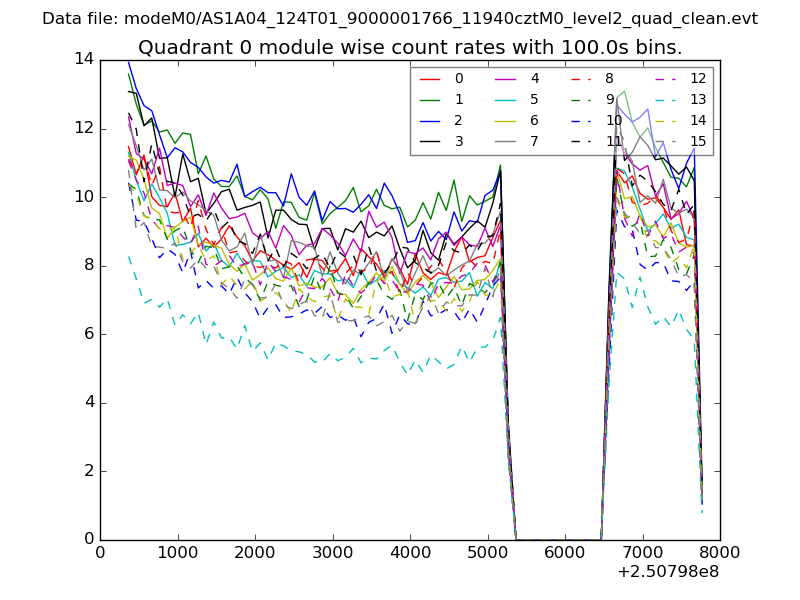 |
 |
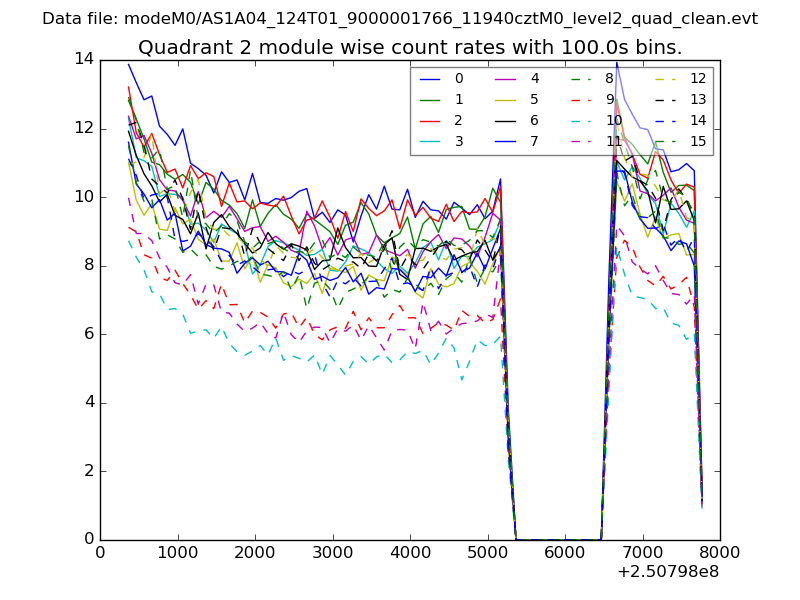
| Module-wise count rates for Quadrant B Data is divided into 100 sec bins |
 |
 |
| Module-wise count rates for Quadrant C Data is divided into 100 sec bins |
 |
 |
| Module-wise count rates for Quadrant D Data is divided into 100 sec bins |
 |
 |
| Parameter | Plot |
|---|---|
| CZT HV Monitor | 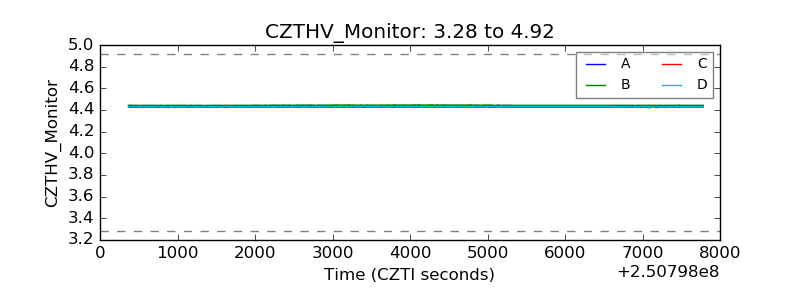 |
| D_VDD | 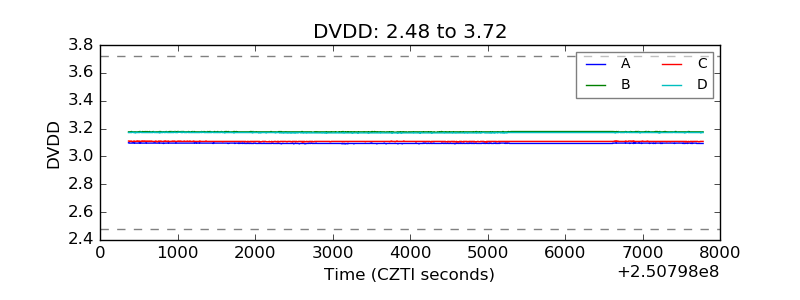 |
| Temperature 1 | 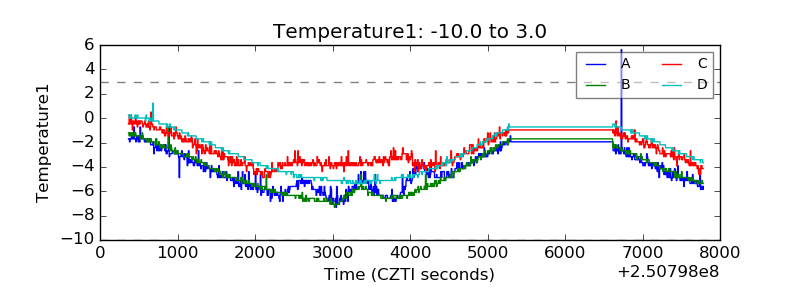 |
| Veto HV Monitor |  |
| Veto LLD | 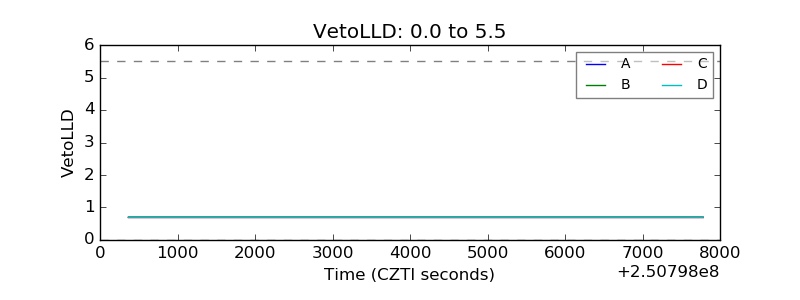 |
| Alpha Counter | 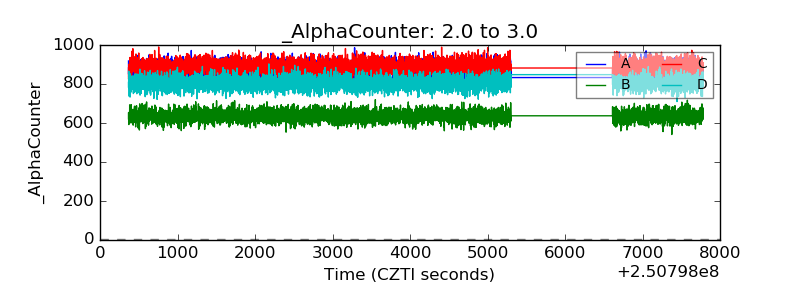 |
| _CPM_Rate | 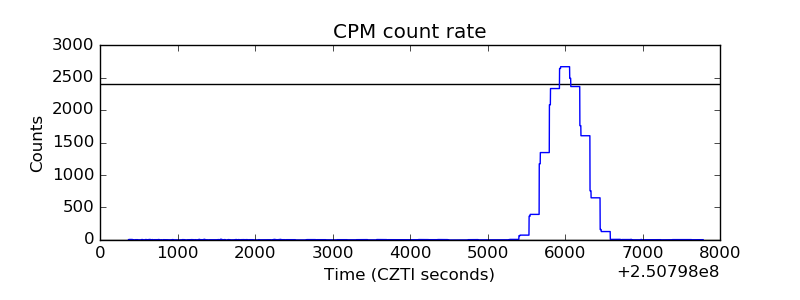 |
| CZT Counter | 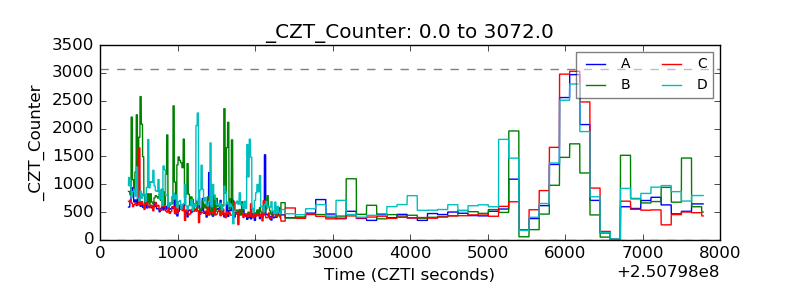 |
| +2.5 Volts monitor |  |
| +5 Volts monitor |  |
| _ROLL_ROT | 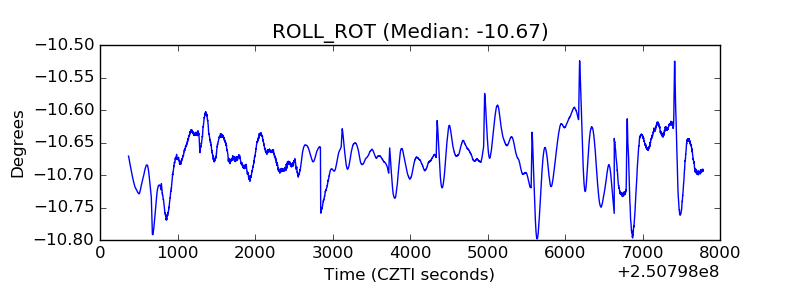 |
| _Roll_DEC | 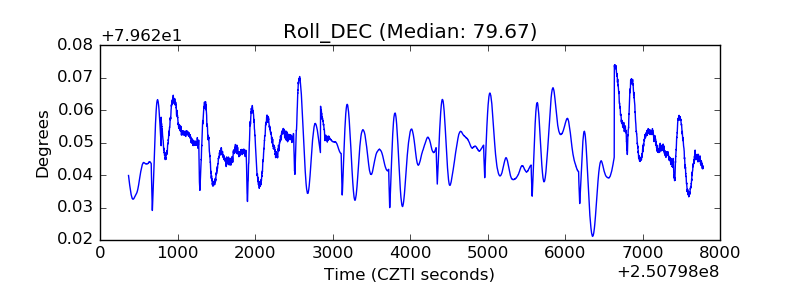 |
| _Roll_RA | 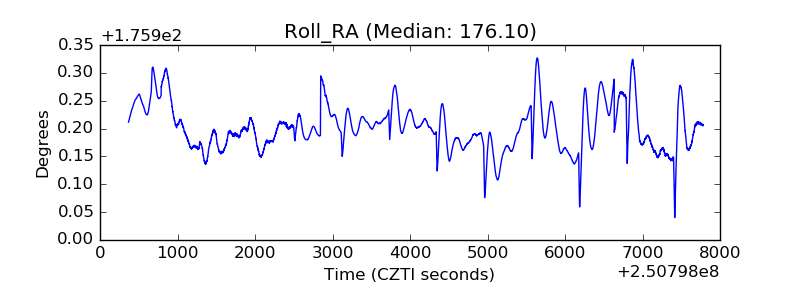 |
| Veto Counter | 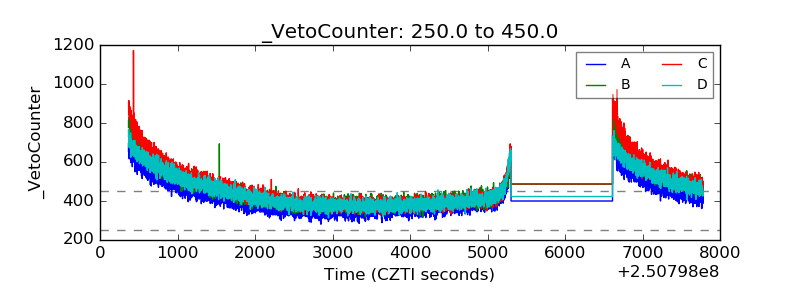 |