| Param | Original file | Final file |
|---|---|---|
| Filename | modeM0/AS1A04_124T01_9000001766_11942cztM0_level2.evt | modeM0/AS1A04_124T01_9000001766_11942cztM0_level2_quad_clean.evt |
| Size (bytes) | 507,936,960 | 121,645,440 |
| Size | 484.4 MB | 116.0 MB |
| Events in quadrant A | 3,286,959 | 820,815 |
| Events in quadrant B | 3,786,884 | 834,649 |
| Events in quadrant C | 2,828,348 | 827,548 |
| Events in quadrant D | 5,056,598 | 764,838 |
| Mode SS | |||
|---|---|---|---|
| Quadrant | BADHDUFLAG | Total packets | Discarded packets |
| A | 0 | 128 | 0 |
| B | 0 | 128 | 0 |
| C | 0 | 128 | 0 |
| D | 0 | 128 | 0 |
| Mode M9 | |||
|---|---|---|---|
| Quadrant | BADHDUFLAG | Total packets | Discarded packets |
| A | 0 | 21 | 0 |
| B | 0 | 21 | 0 |
| C | 0 | 21 | 0 |
| D | 0 | 22 | 0 |
| Mode M0 | |||
|---|---|---|---|
| Quadrant | BADHDUFLAG | Total packets | Discarded packets |
| A | 0 | 14008 | 3 |
| B | 0 | 15460 | 2 |
| C | 0 | 12830 | 2 |
| D | 0 | 19369 | 2 |
| Quadrant | Total seconds | Saturated seconds | Saturation percentage |
|---|---|---|---|
| A | 6249 | 75 | 1.200192% |
| B | 6249 | 281 | 4.496719% |
| C | 6249 | 35 | 0.560090% |
| D | 6249 | 236 | 3.776604% |
Noise dominated data is calculated using 1-second bins in cleaned event files. If a bin has >2000 counts, and if more than 50% of those come from <1% of pixels, then it is considered to be noise-dominated and hence unusable.
| Quadrant | # 1 sec bins | Bins with >0 counts | Bins with >2000 counts | High rate bins dominated by noise | Noise dominated (total time) | Noise dominated (detector-on time) | Marked lightcurve |
|---|---|---|---|---|---|---|---|
| A | 7485 | 6251 | 1 | 1 | 0.01% | 0.02% | 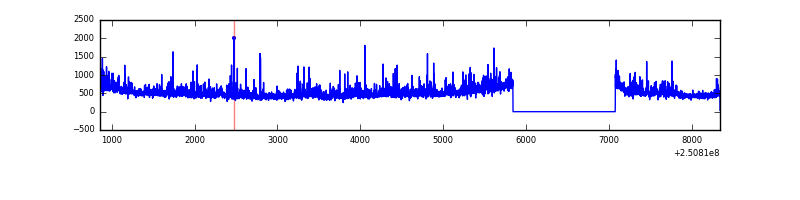 |
| B | 7485 | 6250 | 139 | 139 | 1.86% | 2.22% | 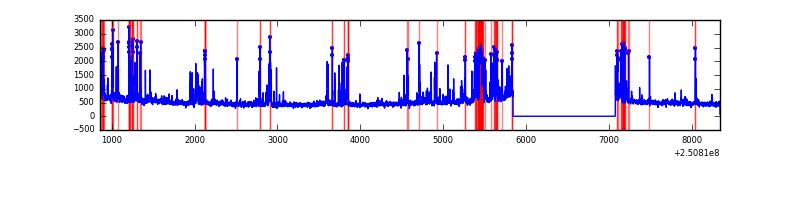 |
| C | 7485 | 6251 | 0 | 0 | 0.00% | 0.00% | 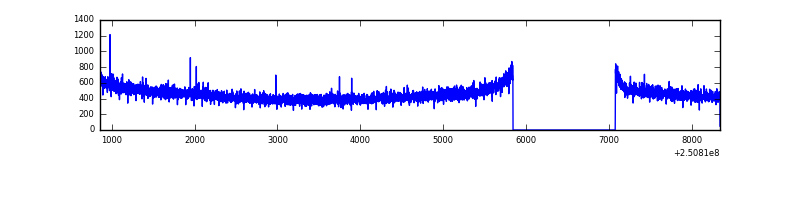 |
| D | 7485 | 6250 | 95 | 95 | 1.27% | 1.52% | 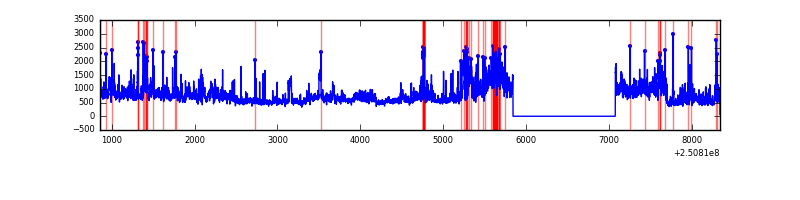 |
Top three noisy pixels from each quadrant. If the there are fewer than three noisy pixels in the level2.evt file, extra rows are filled as -1
| Pixel properties | Quadrant properties | ||||||
|---|---|---|---|---|---|---|---|
| Quadrant | DetID | PixID | Counts | Sigma | Mean | Median | Sigma |
| A | 1 | 162 | 137003 | 916.04 | 732 | 716 | 148.8 |
| A | 1 | 178 | 73882 | 491.78 | 732 | 716 | 148.8 |
| A | 1 | 161 | 64627 | 429.57 | 732 | 716 | 148.8 |
| B | 4 | 239 | 567938 | 4149.36 | 734 | 717 | 136.7 |
| B | 0 | 85 | 192349 | 1401.84 | 734 | 717 | 136.7 |
| B | 15 | 204 | 68522 | 496.01 | 734 | 717 | 136.7 |
| C | 13 | 61 | 5433 | 28.43 | 724 | 727 | 165.5 |
| C | 14 | 234 | 3199 | 14.93 | 724 | 727 | 165.5 |
| C | 3 | 202 | 1817 | 6.59 | 724 | 727 | 165.5 |
| D | 1 | 52 | 1045773 | 6226.66 | 705 | 683 | 167.8 |
| D | 8 | 195 | 533244 | 3173.01 | 705 | 683 | 167.8 |
| D | 13 | 122 | 452394 | 2691.3 | 705 | 683 | 167.8 |
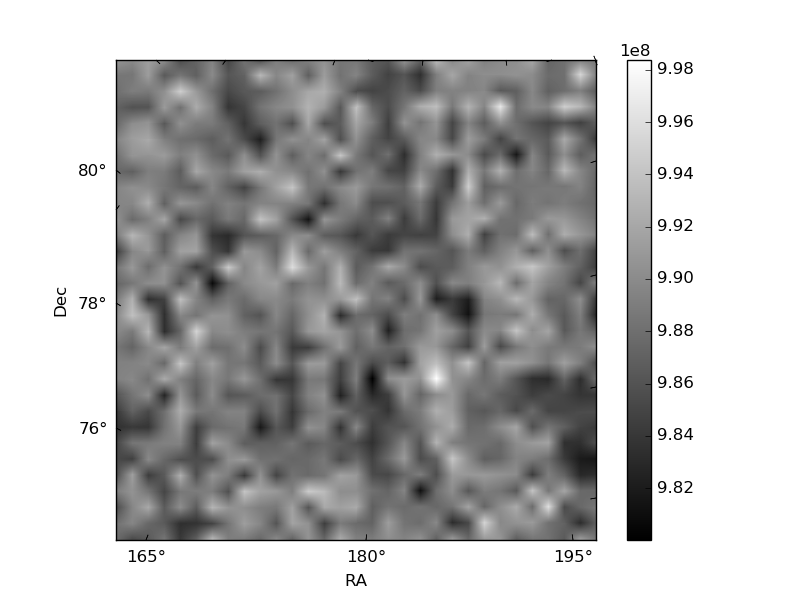
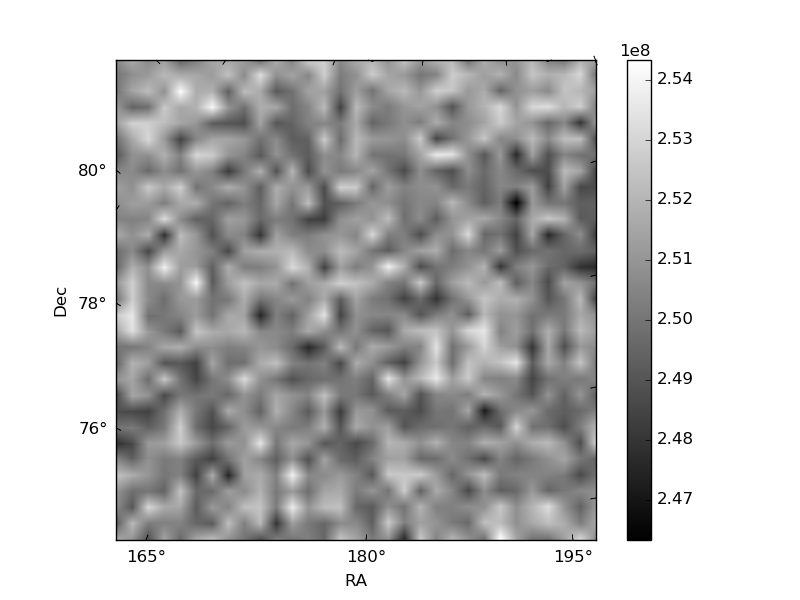
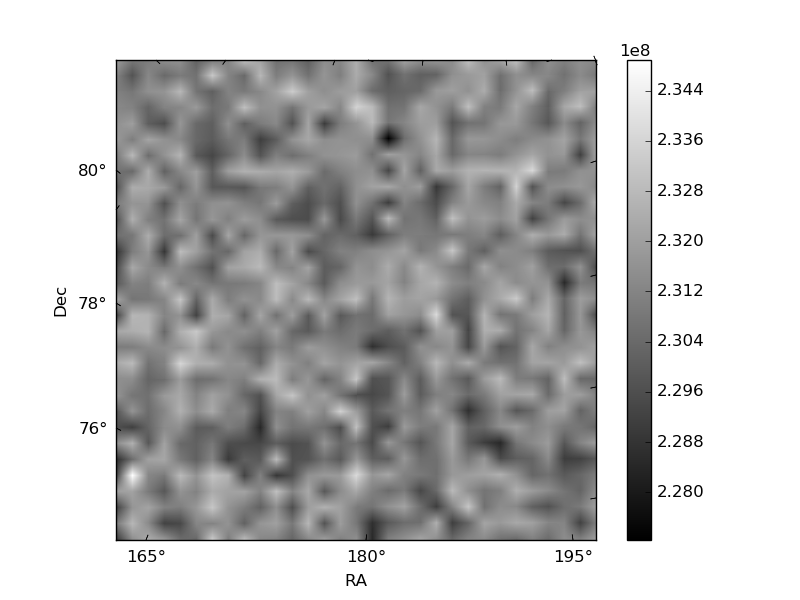
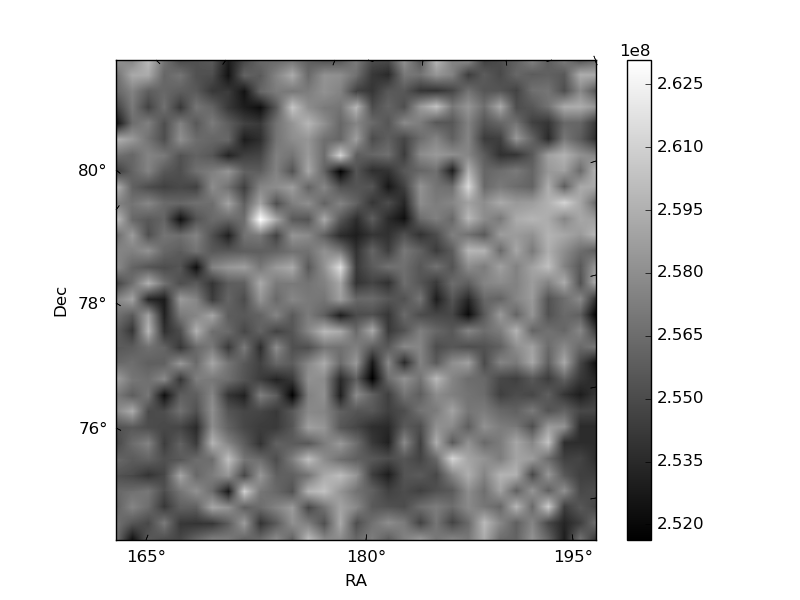
Histogram calculated using DETX and DETY for each event in the final _common_clean file
| Quadrant A | 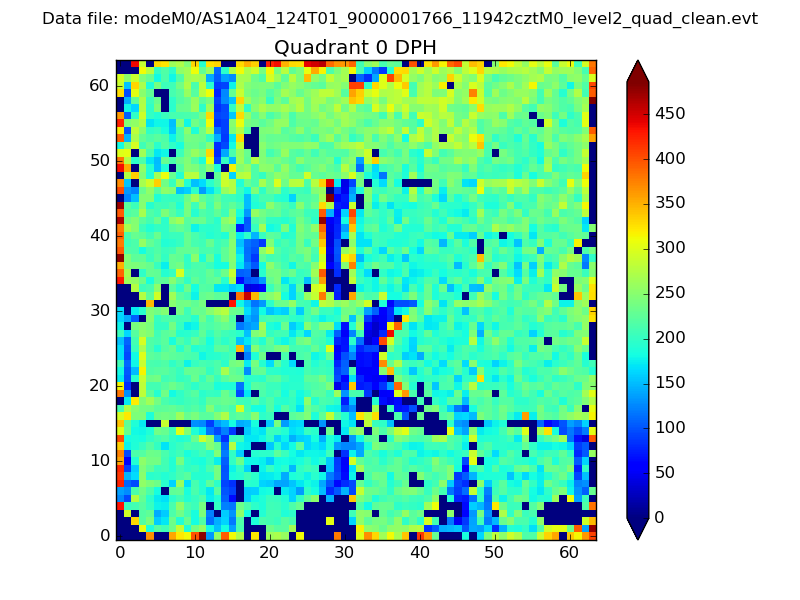 |
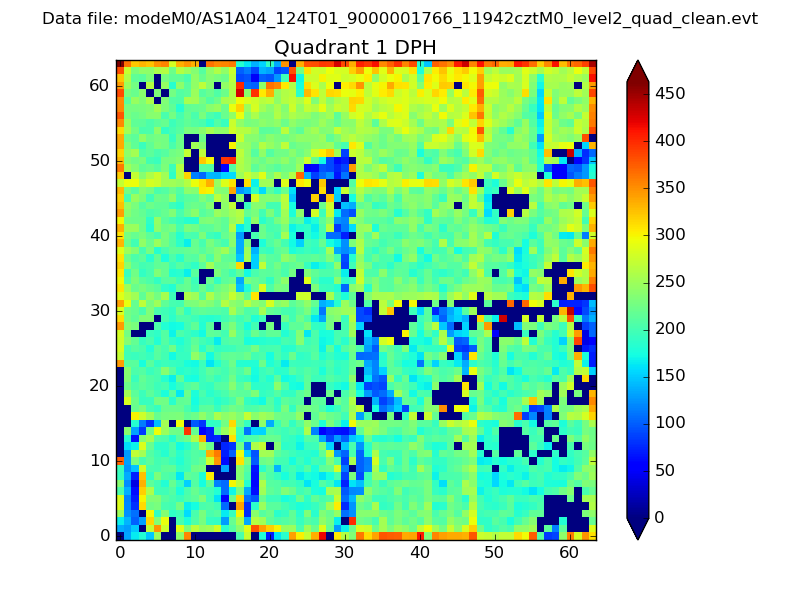 |
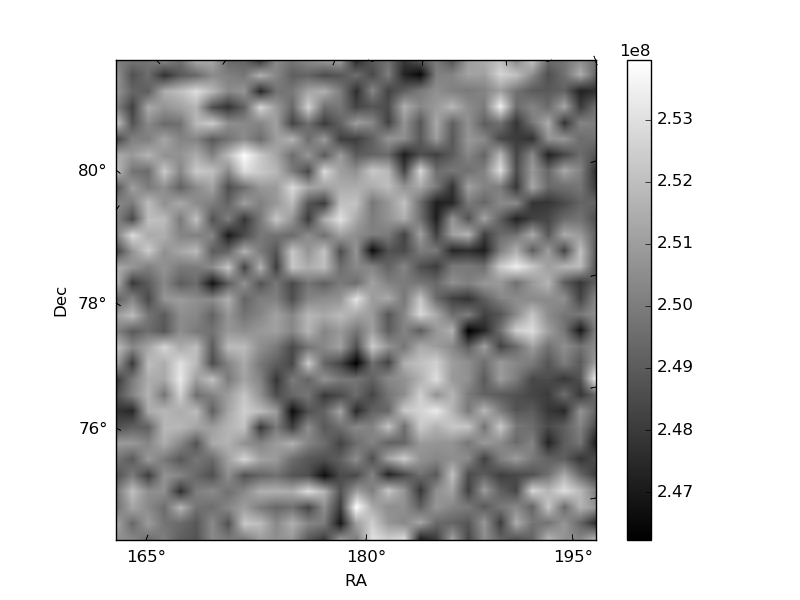
Quadrant B |
|---|---|---|---|
| Quadrant D | 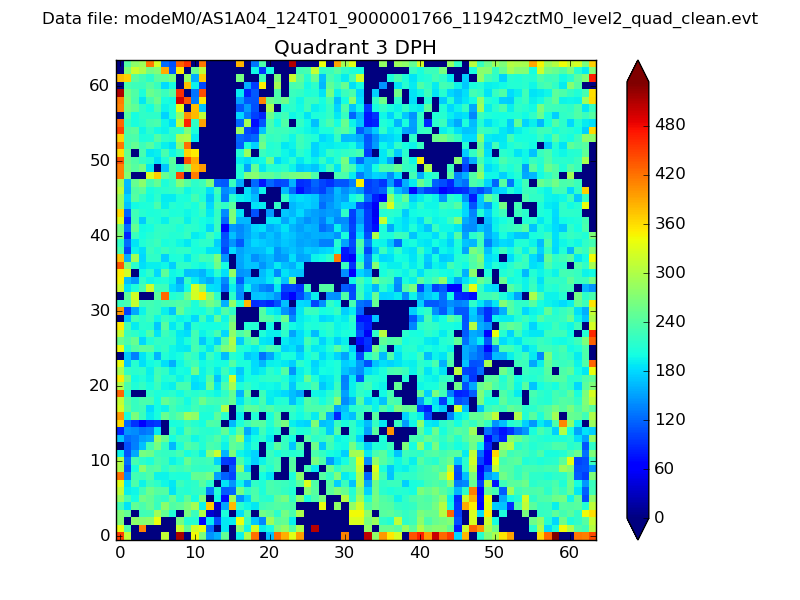 |
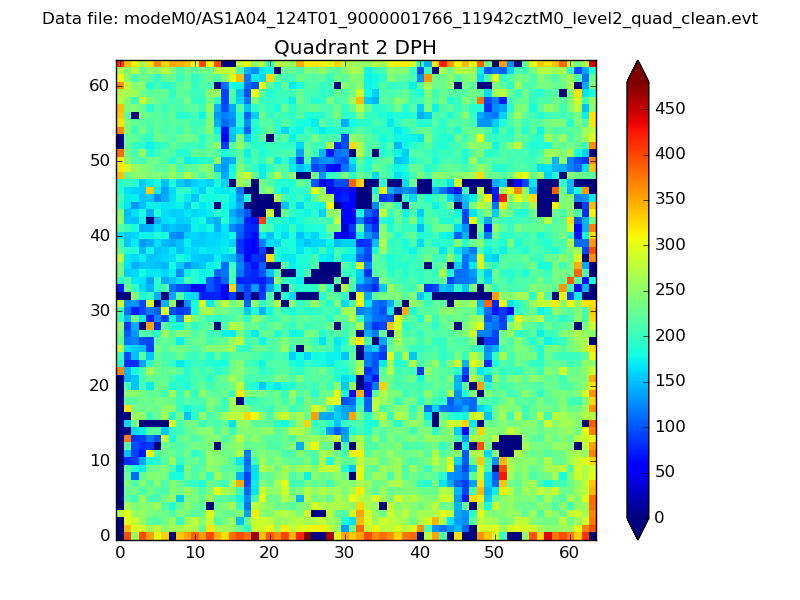 |
Quadrant C |
| Plot type | Count rate plots | Images |
|---|---|---|
| Comparison with Poisson distribution Blue bars denote a histogram of data divided into 1 sec bins. Red curve is a Poisson curve with rate = median count rate of data. |
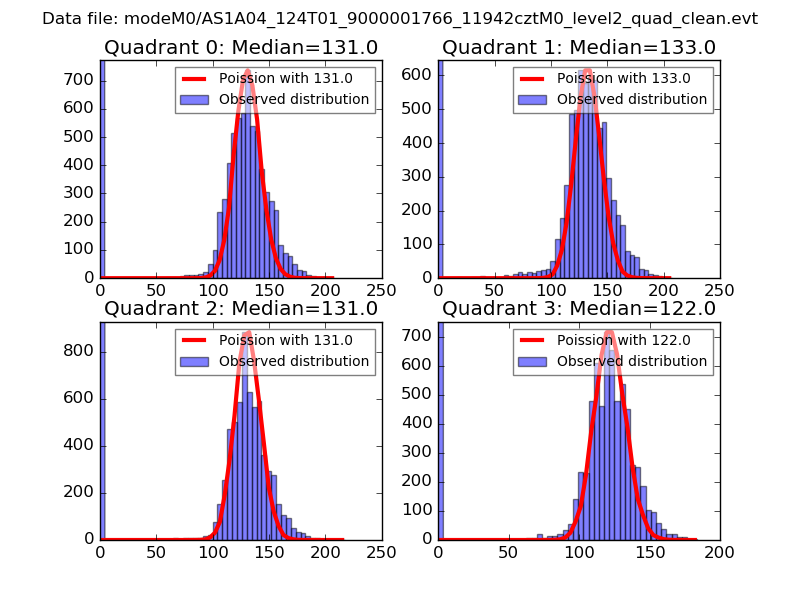 |
 |
| Quadrant-wise count rates Data is divided into 100 sec bins |
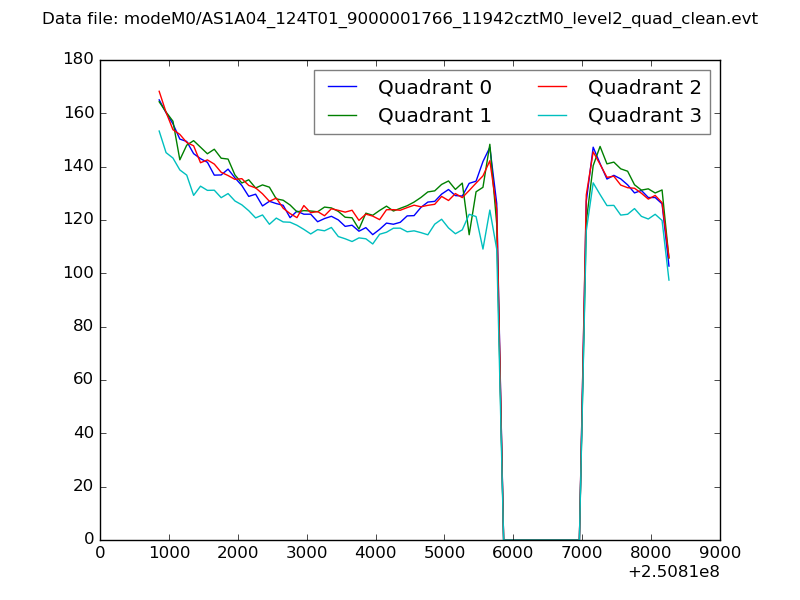 |
|
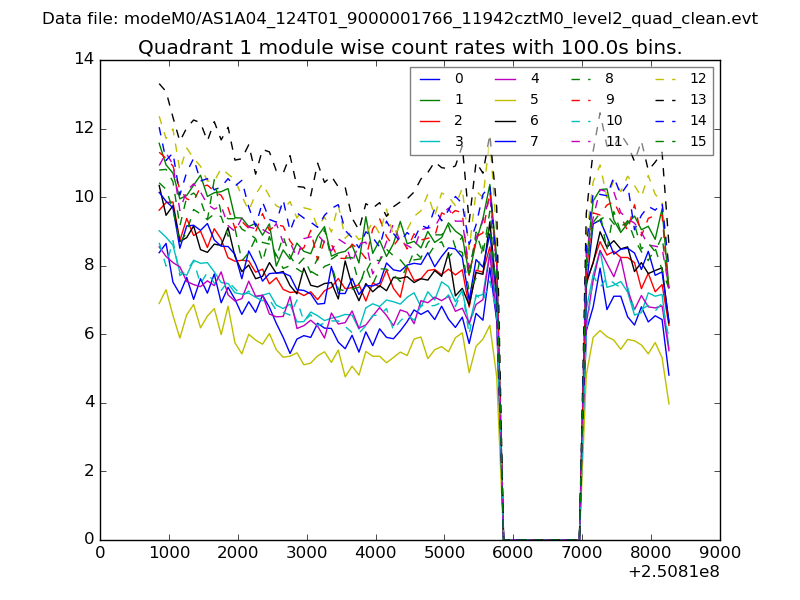
| Module-wise count rates for Quadrant A Data is divided into 100 sec bins |
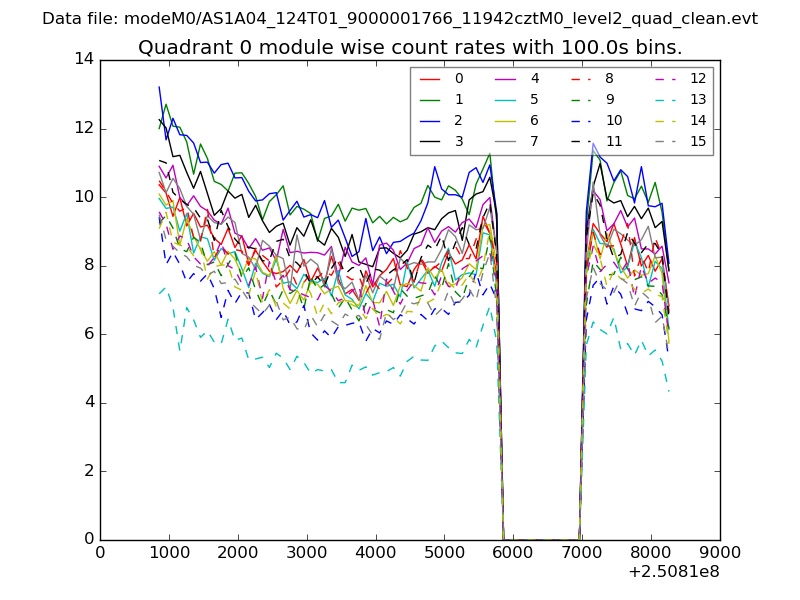 |
 |
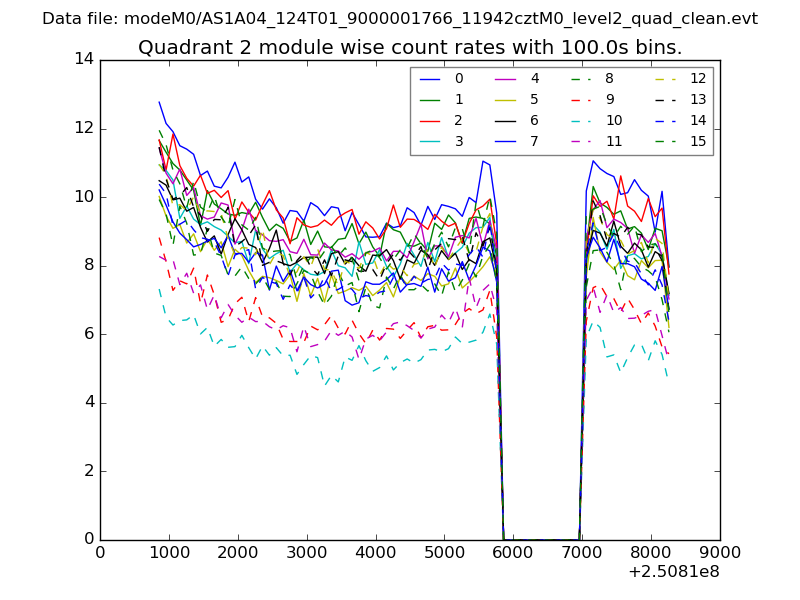
| Module-wise count rates for Quadrant B Data is divided into 100 sec bins |
 |
 |
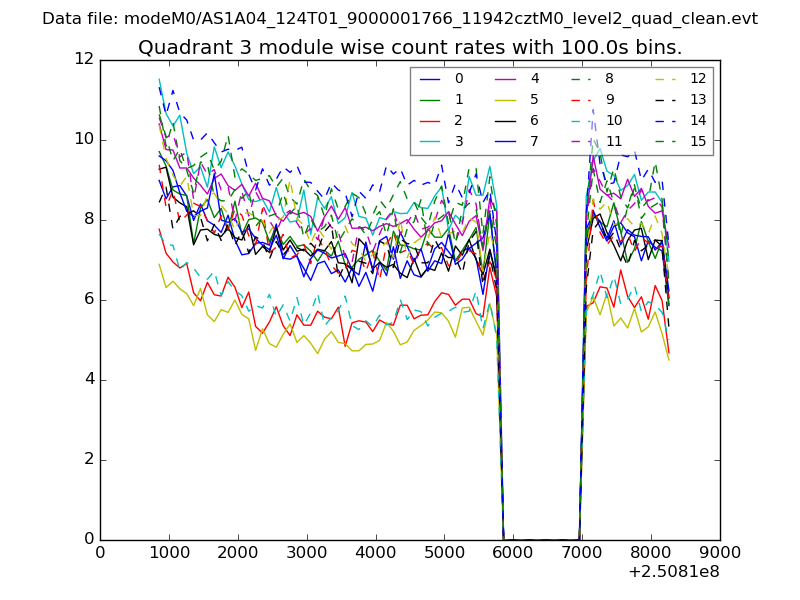
| Module-wise count rates for Quadrant C Data is divided into 100 sec bins |
 |
 |
| Module-wise count rates for Quadrant D Data is divided into 100 sec bins |
 |
 |
| Parameter | Plot |
|---|---|
| CZT HV Monitor | 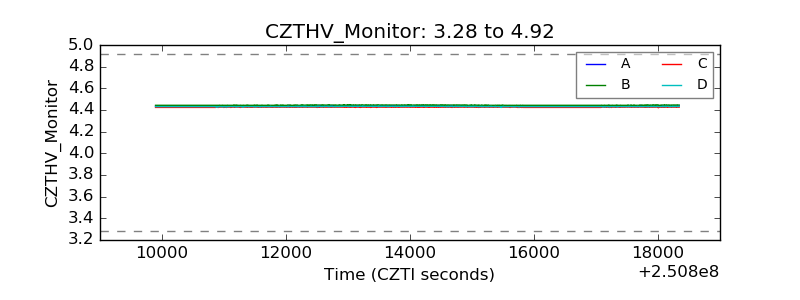 |
| D_VDD | 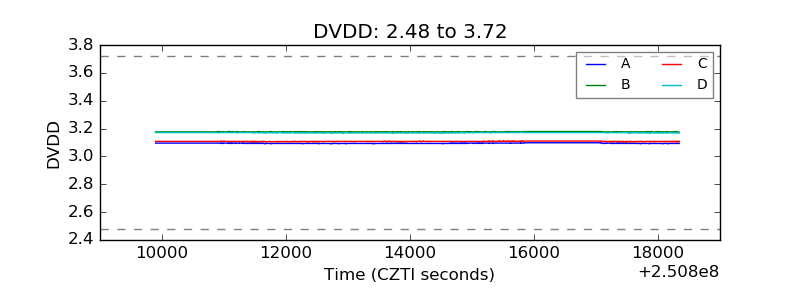 |
| Temperature 1 |  |
| Veto HV Monitor | 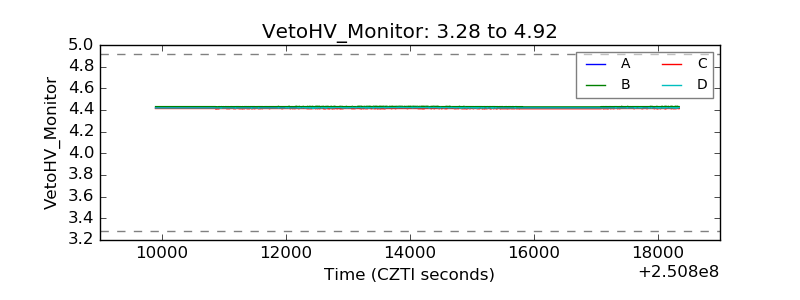 |
| Veto LLD |  |
| Alpha Counter | 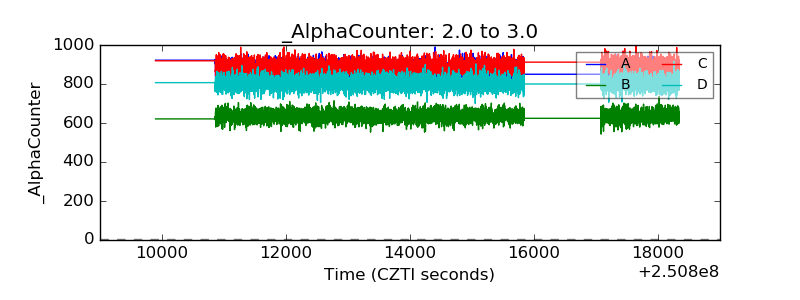 |
| _CPM_Rate | 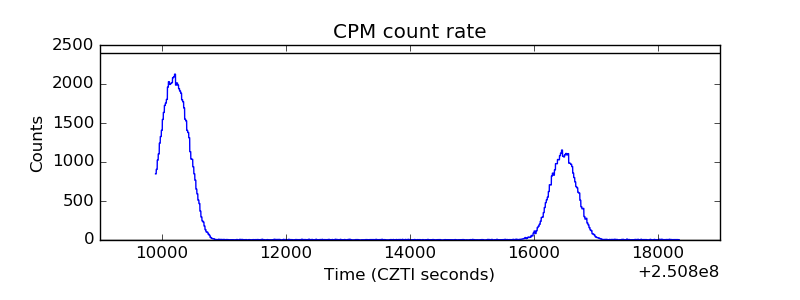 |
| CZT Counter | 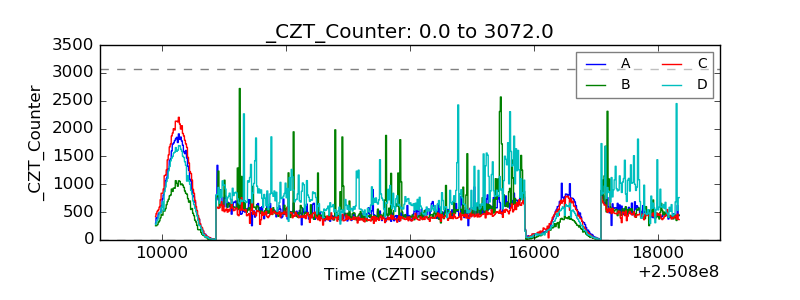 |
| +2.5 Volts monitor |  |
| +5 Volts monitor |  |
| _ROLL_ROT | 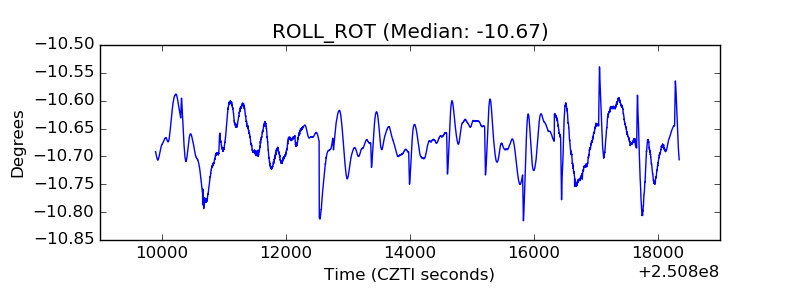 |
| _Roll_DEC | 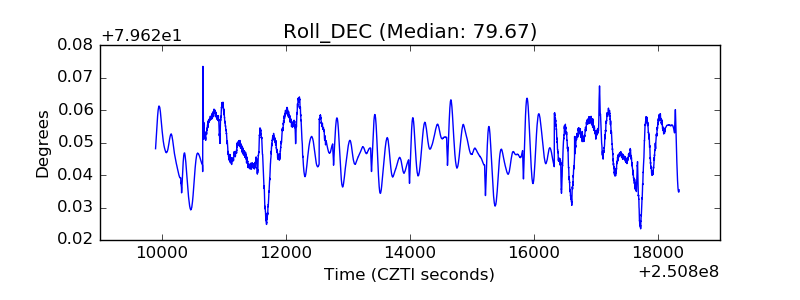 |
| _Roll_RA | 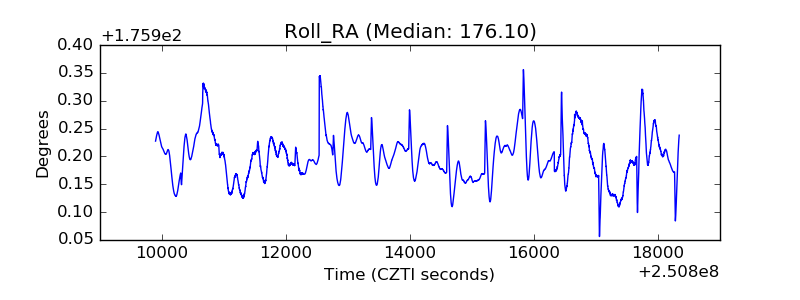 |
| Veto Counter | 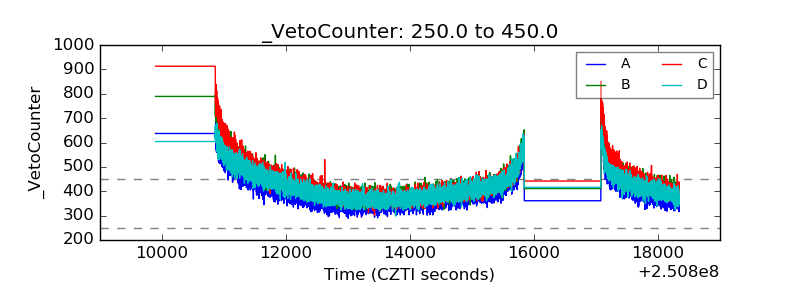 |