| Param | Original file | Final file |
|---|---|---|
| Filename | modeM0/AS1A04_124T01_9000001766_11943cztM0_level2.evt | modeM0/AS1A04_124T01_9000001766_11943cztM0_level2_quad_clean.evt |
| Size (bytes) | 556,727,040 | 125,605,440 |
| Size | 530.9 MB | 119.8 MB |
| Events in quadrant A | 3,313,419 | 854,531 |
| Events in quadrant B | 4,055,984 | 861,868 |
| Events in quadrant C | 2,963,793 | 852,461 |
| Events in quadrant D | 6,066,087 | 761,199 |
| Mode SS | |||
|---|---|---|---|
| Quadrant | BADHDUFLAG | Total packets | Discarded packets |
| A | 0 | 138 | 0 |
| B | 0 | 138 | 0 |
| C | 0 | 138 | 0 |
| D | 0 | 138 | 0 |
| Mode M9 | |||
|---|---|---|---|
| Quadrant | BADHDUFLAG | Total packets | Discarded packets |
| A | 0 | 21 | 0 |
| B | 0 | 21 | 0 |
| C | 0 | 21 | 0 |
| D | 0 | 22 | 0 |
| Mode M0 | |||
|---|---|---|---|
| Quadrant | BADHDUFLAG | Total packets | Discarded packets |
| A | 0 | 14528 | 3 |
| B | 0 | 16806 | 2 |
| C | 0 | 13857 | 2 |
| D | 0 | 22841 | 2 |
| Quadrant | Total seconds | Saturated seconds | Saturation percentage |
|---|---|---|---|
| A | 6801 | 44 | 0.646964% |
| B | 6801 | 270 | 3.970004% |
| C | 6801 | 9 | 0.132333% |
| D | 6801 | 705 | 10.366123% |
Noise dominated data is calculated using 1-second bins in cleaned event files. If a bin has >2000 counts, and if more than 50% of those come from <1% of pixels, then it is considered to be noise-dominated and hence unusable.
| Quadrant | # 1 sec bins | Bins with >0 counts | Bins with >2000 counts | High rate bins dominated by noise | Noise dominated (total time) | Noise dominated (detector-on time) | Marked lightcurve |
|---|---|---|---|---|---|---|---|
| A | 7847 | 6803 | 3 | 3 | 0.04% | 0.04% | 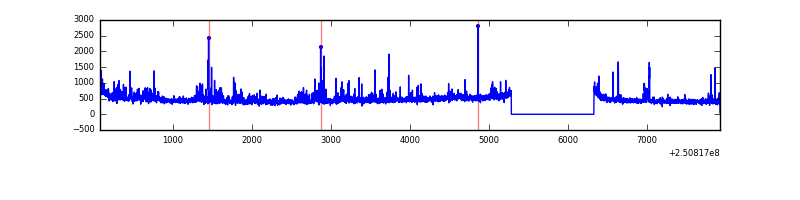 |
| B | 7847 | 6803 | 120 | 120 | 1.53% | 1.76% | 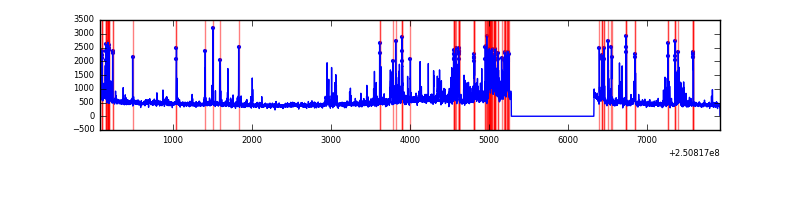 |
| C | 7847 | 6803 | 1 | 1 | 0.01% | 0.01% | 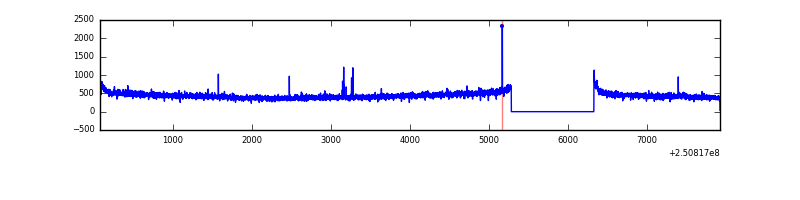 |
| D | 7847 | 6803 | 769 | 769 | 9.80% | 11.30% | 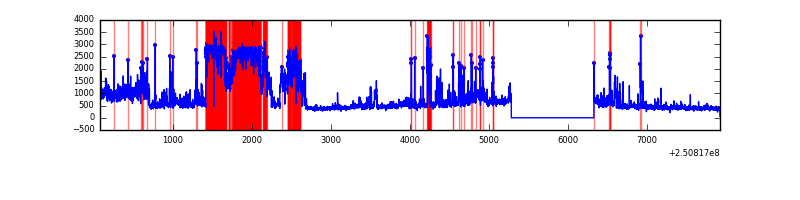 |
Top three noisy pixels from each quadrant. If the there are fewer than three noisy pixels in the level2.evt file, extra rows are filled as -1
| Pixel properties | Quadrant properties | ||||||
|---|---|---|---|---|---|---|---|
| Quadrant | DetID | PixID | Counts | Sigma | Mean | Median | Sigma |
| A | 1 | 162 | 83591 | 531.96 | 771 | 756 | 155.7 |
| A | 6 | 254 | 53199 | 336.79 | 771 | 756 | 155.7 |
| A | 1 | 178 | 43708 | 275.84 | 771 | 756 | 155.7 |
| B | 4 | 239 | 777907 | 5399.46 | 773 | 754 | 143.9 |
| B | 15 | 204 | 100133 | 690.46 | 773 | 754 | 143.9 |
| B | 11 | 51 | 58436 | 400.76 | 773 | 754 | 143.9 |
| C | 14 | 234 | 9694 | 51.65 | 755 | 758 | 173.0 |
| C | 0 | 10 | 6718 | 34.45 | 755 | 758 | 173.0 |
| C | 13 | 61 | 5545 | 27.67 | 755 | 758 | 173.0 |
| D | 1 | 52 | 2338085 | 13718.92 | 712 | 693 | 170.4 |
| D | 13 | 122 | 394805 | 2313.17 | 712 | 693 | 170.4 |
| D | 8 | 195 | 239838 | 1403.62 | 712 | 693 | 170.4 |
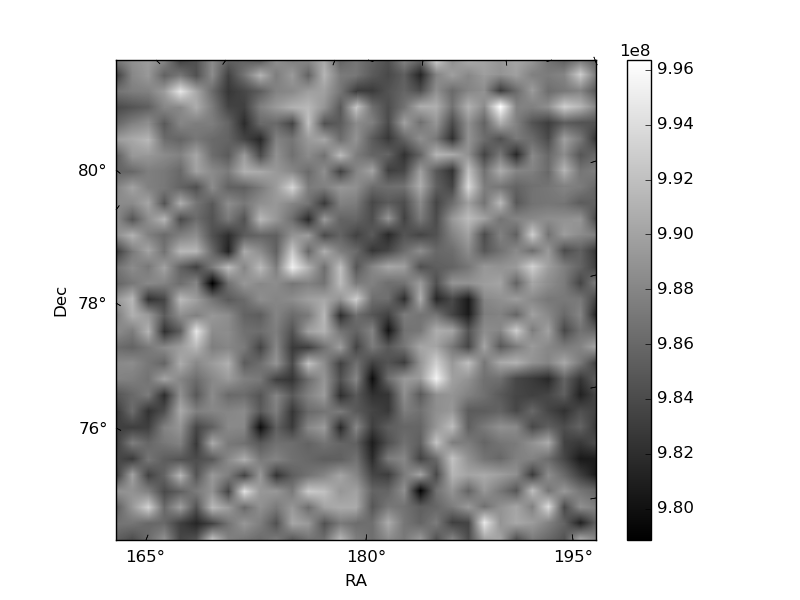
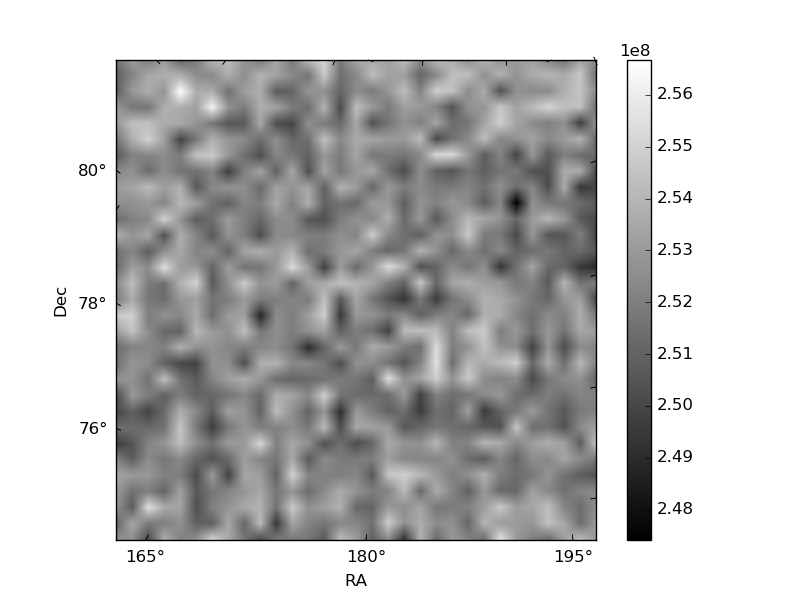
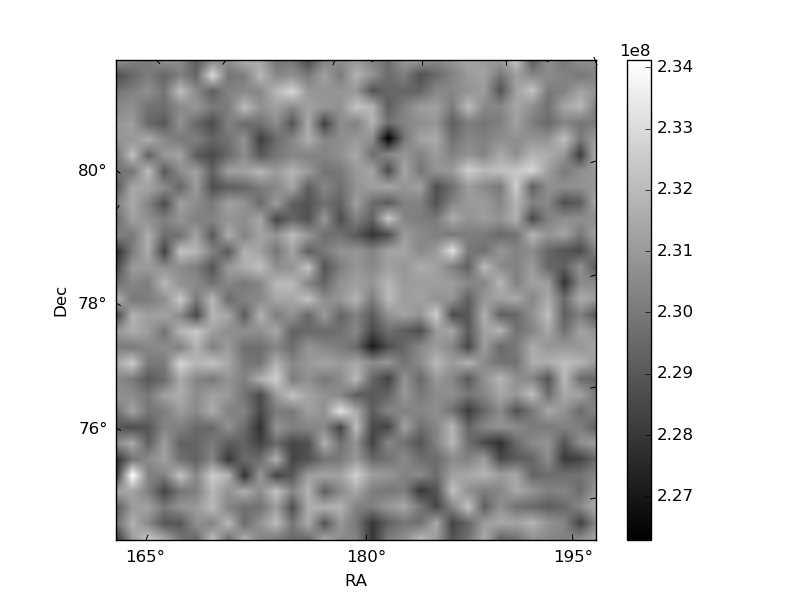
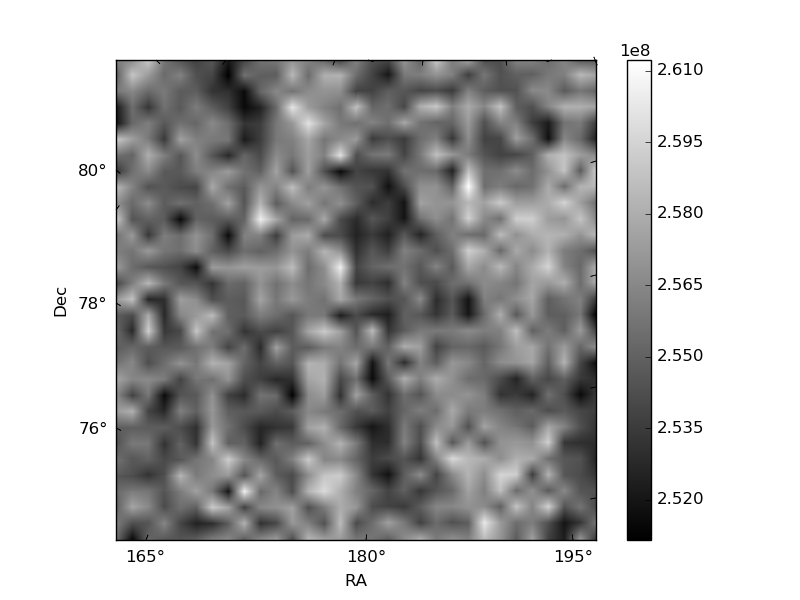
Histogram calculated using DETX and DETY for each event in the final _common_clean file
| Quadrant A | 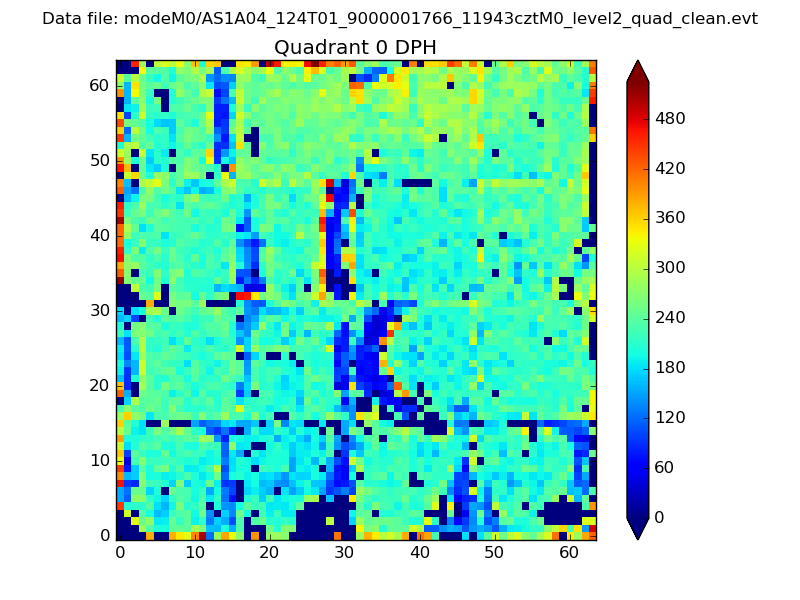 |
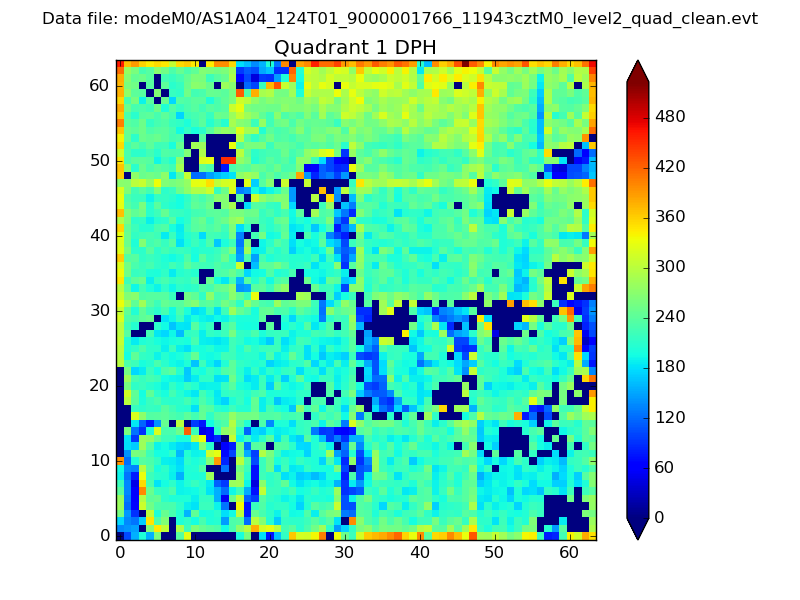 |
Quadrant B |
|---|---|---|---|
| Quadrant D | 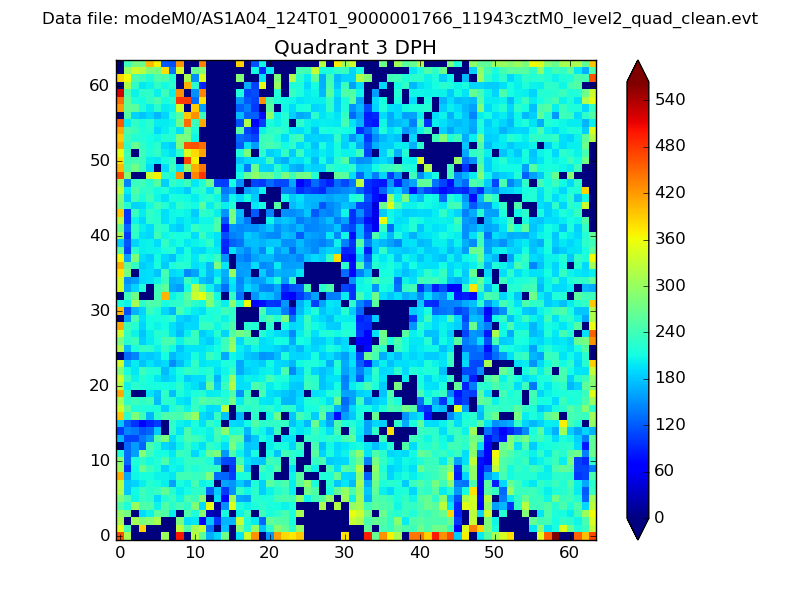 |
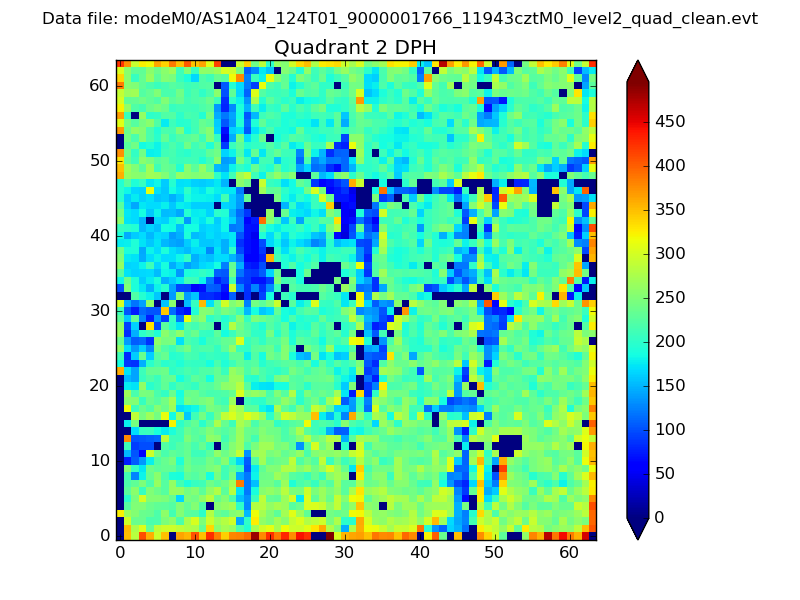 |
Quadrant C |
| Plot type | Count rate plots | Images |
|---|---|---|
| Comparison with Poisson distribution Blue bars denote a histogram of data divided into 1 sec bins. Red curve is a Poisson curve with rate = median count rate of data. |
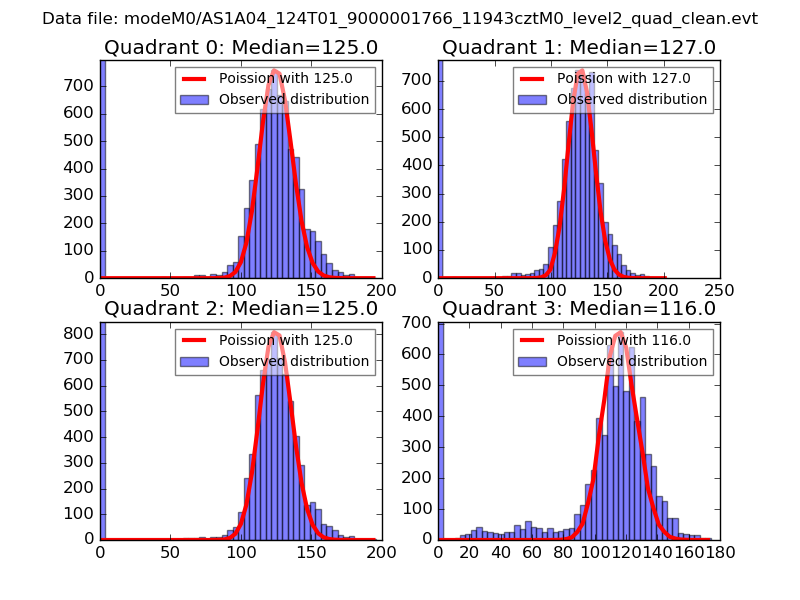 |
 |
| Quadrant-wise count rates Data is divided into 100 sec bins |
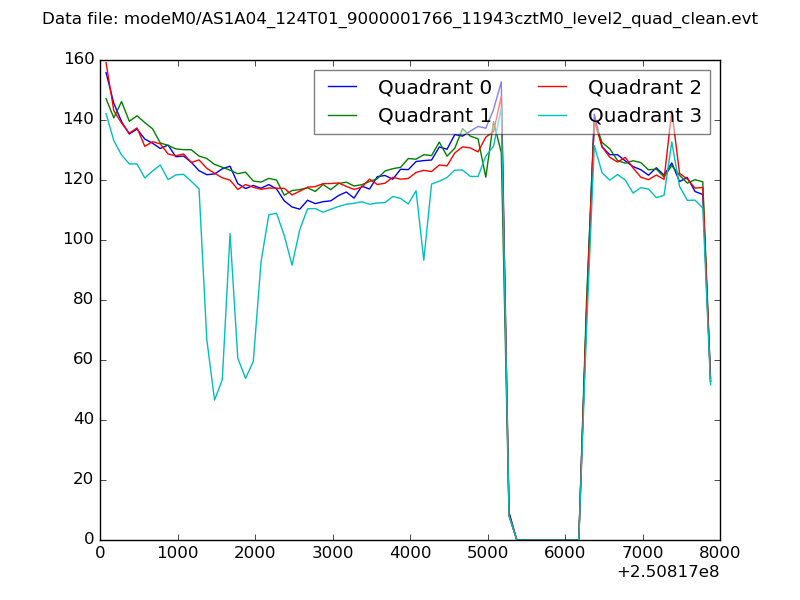 |
|
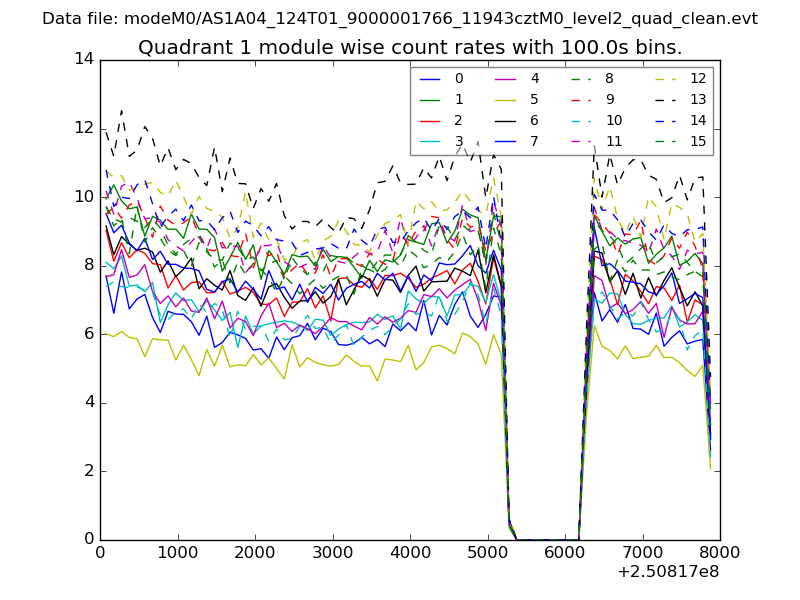
| Module-wise count rates for Quadrant A Data is divided into 100 sec bins |
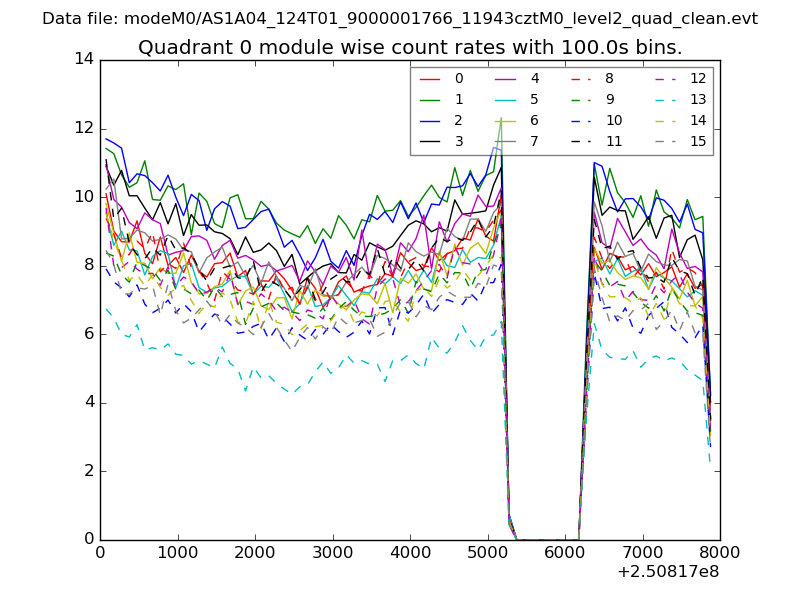 |
 |
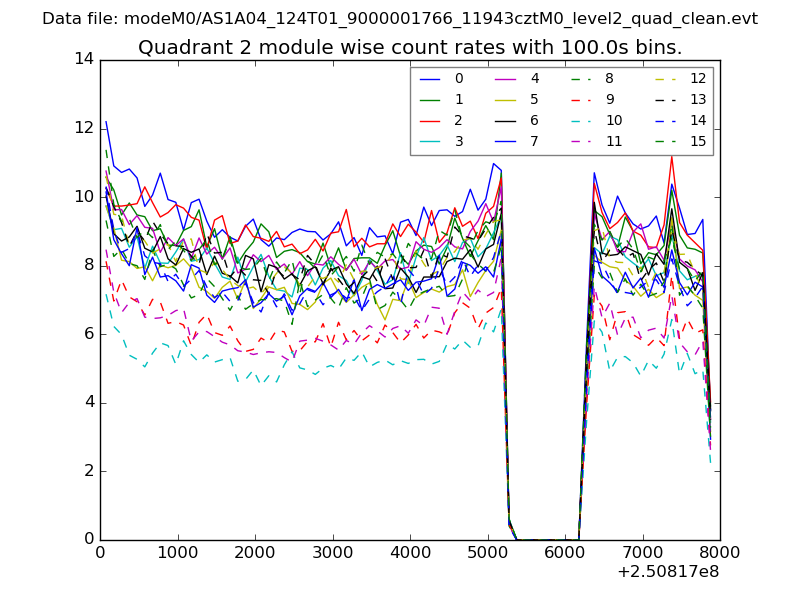
| Module-wise count rates for Quadrant B Data is divided into 100 sec bins |
 |
 |
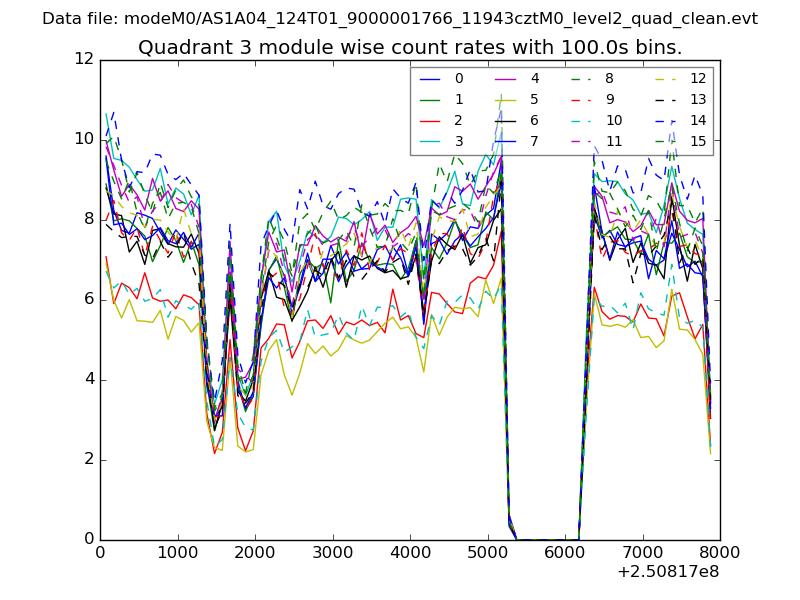
| Module-wise count rates for Quadrant C Data is divided into 100 sec bins |
 |
 |
| Module-wise count rates for Quadrant D Data is divided into 100 sec bins |
 |
 |
| Parameter | Plot |
|---|---|
| CZT HV Monitor | 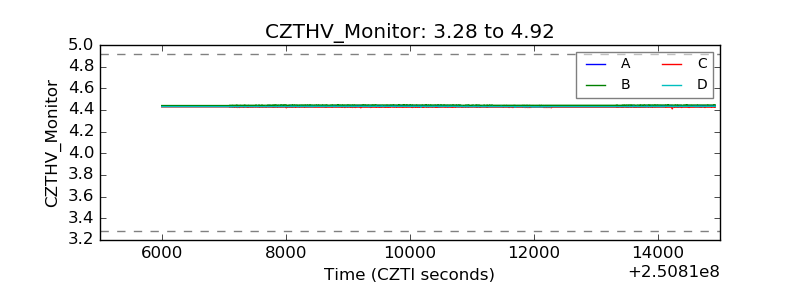 |
| D_VDD | 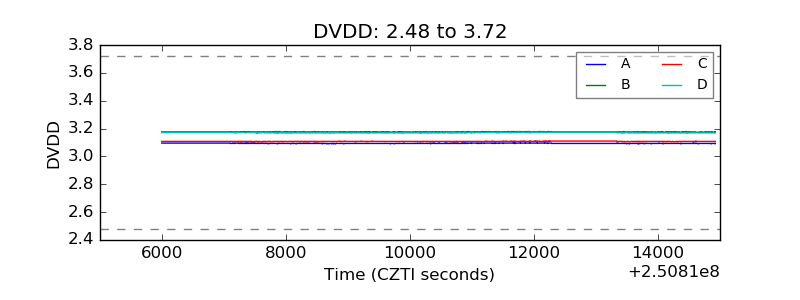 |
| Temperature 1 | 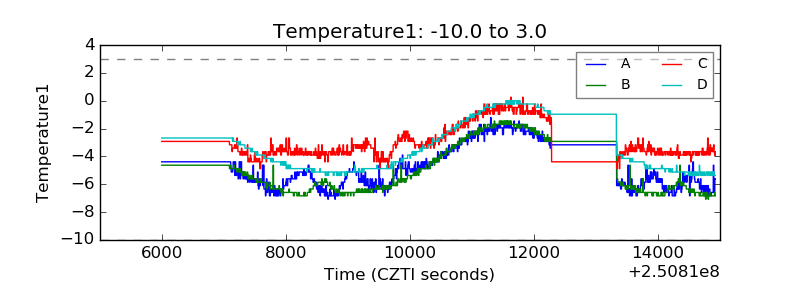 |
| Veto HV Monitor |  |
| Veto LLD | 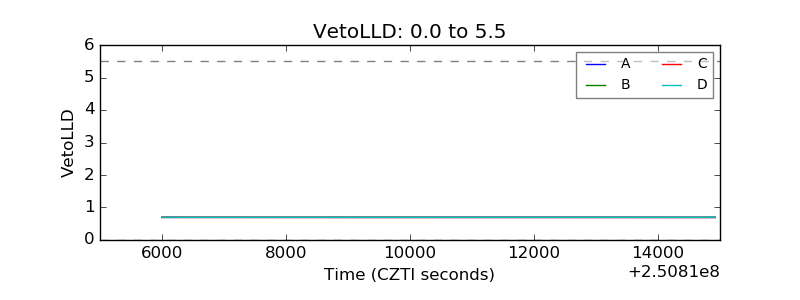 |
| Alpha Counter | 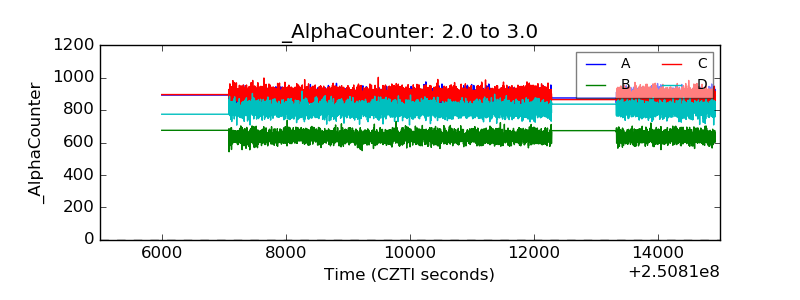 |
| _CPM_Rate | 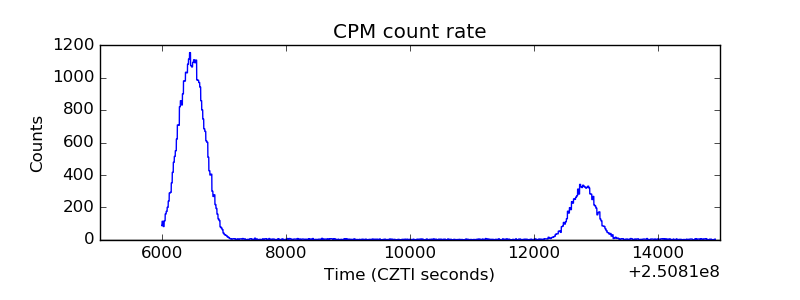 |
| CZT Counter | 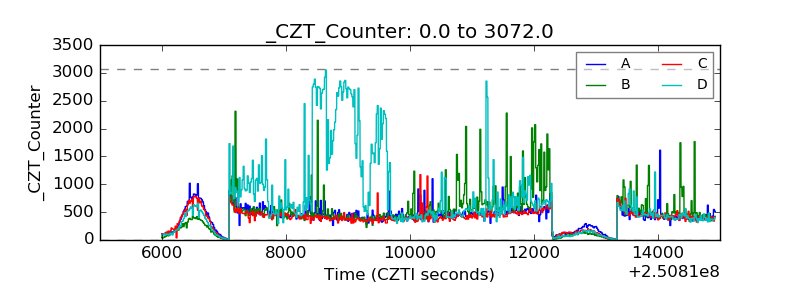 |
| +2.5 Volts monitor |  |
| +5 Volts monitor |  |
| _ROLL_ROT | 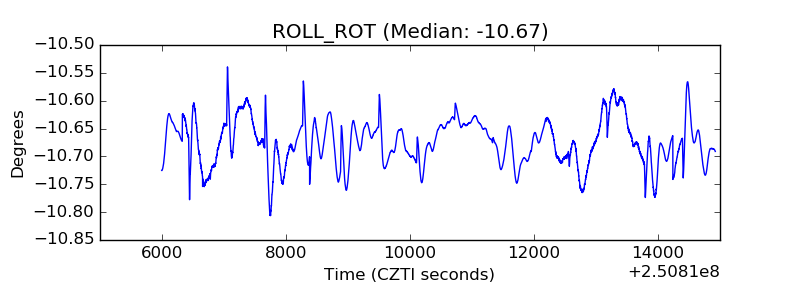 |
| _Roll_DEC | 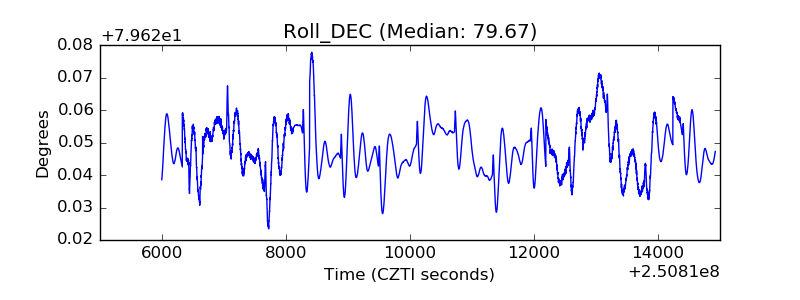 |
| _Roll_RA | 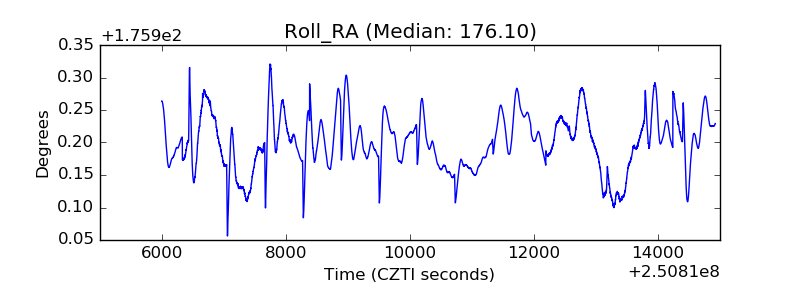 |
| Veto Counter | 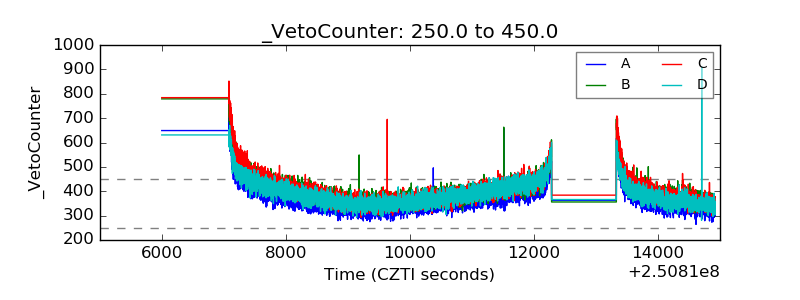 |