| Param | Original file | Final file |
|---|---|---|
| Filename | modeM0/AS1A04_124T01_9000001766_11944cztM0_level2.evt | modeM0/AS1A04_124T01_9000001766_11944cztM0_level2_quad_clean.evt |
| Size (bytes) | 552,683,520 | 137,727,360 |
| Size | 527.1 MB | 131.3 MB |
| Events in quadrant A | 3,597,469 | 927,001 |
| Events in quadrant B | 4,982,272 | 926,311 |
| Events in quadrant C | 3,292,418 | 919,967 |
| Events in quadrant D | 4,355,629 | 874,916 |
| Mode SS | |||
|---|---|---|---|
| Quadrant | BADHDUFLAG | Total packets | Discarded packets |
| A | 0 | 152 | 0 |
| B | 0 | 152 | 0 |
| C | 0 | 152 | 0 |
| D | 0 | 152 | 0 |
| Mode M9 | |||
|---|---|---|---|
| Quadrant | BADHDUFLAG | Total packets | Discarded packets |
| A | 0 | 18 | 0 |
| B | 0 | 18 | 0 |
| C | 0 | 18 | 0 |
| D | 0 | 18 | 0 |
| Mode M0 | |||
|---|---|---|---|
| Quadrant | BADHDUFLAG | Total packets | Discarded packets |
| A | 0 | 16032 | 3 |
| B | 0 | 20082 | 2 |
| C | 0 | 15432 | 2 |
| D | 0 | 18537 | 2 |
| Quadrant | Total seconds | Saturated seconds | Saturation percentage |
|---|---|---|---|
| A | 7530 | 59 | 0.783533% |
| B | 7530 | 422 | 5.604250% |
| C | 7530 | 18 | 0.239044% |
| D | 7530 | 75 | 0.996016% |
Noise dominated data is calculated using 1-second bins in cleaned event files. If a bin has >2000 counts, and if more than 50% of those come from <1% of pixels, then it is considered to be noise-dominated and hence unusable.
| Quadrant | # 1 sec bins | Bins with >0 counts | Bins with >2000 counts | High rate bins dominated by noise | Noise dominated (total time) | Noise dominated (detector-on time) | Marked lightcurve |
|---|---|---|---|---|---|---|---|
| A | 9236 | 7533 | 2 | 2 | 0.02% | 0.03% | 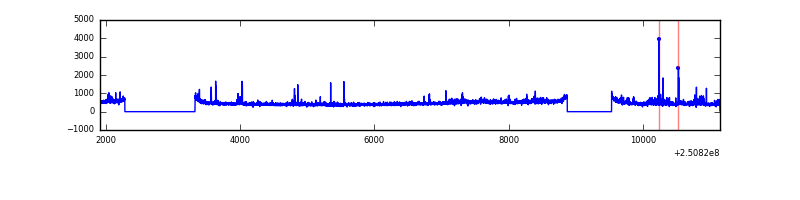 |
| B | 9236 | 7532 | 219 | 219 | 2.37% | 2.91% | 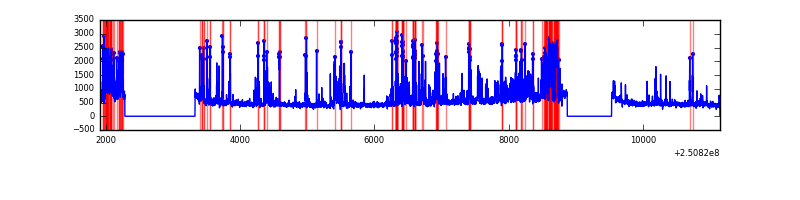 |
| C | 9236 | 7533 | 1 | 1 | 0.01% | 0.01% |  |
| D | 9236 | 7532 | 47 | 47 | 0.51% | 0.62% | 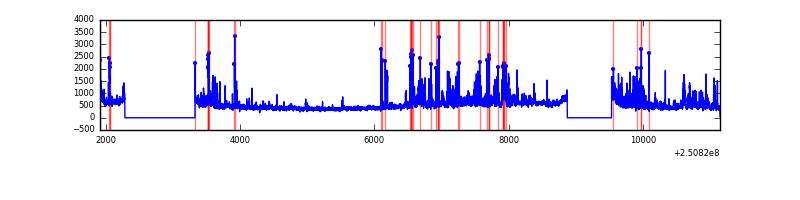 |
Top three noisy pixels from each quadrant. If the there are fewer than three noisy pixels in the level2.evt file, extra rows are filled as -1
| Pixel properties | Quadrant properties | ||||||
|---|---|---|---|---|---|---|---|
| Quadrant | DetID | PixID | Counts | Sigma | Mean | Median | Sigma |
| A | 8 | 15 | 67467 | 385.38 | 858 | 838 | 172.9 |
| A | 1 | 162 | 56146 | 319.9 | 858 | 838 | 172.9 |
| A | 11 | 29 | 38103 | 215.54 | 858 | 838 | 172.9 |
| B | 4 | 239 | 1081684 | 6694.31 | 856 | 834 | 161.5 |
| B | 3 | 64 | 282645 | 1745.41 | 856 | 834 | 161.5 |
| B | 15 | 204 | 162647 | 1002.2 | 856 | 834 | 161.5 |
| C | 0 | 10 | 15895 | 78.21 | 839 | 841 | 192.5 |
| C | 13 | 61 | 6212 | 27.9 | 839 | 841 | 192.5 |
| C | 0 | 207 | 4704 | 20.07 | 839 | 841 | 192.5 |
| D | 1 | 52 | 518787 | 2629.8 | 826 | 803 | 197.0 |
| D | 8 | 195 | 269761 | 1365.5 | 826 | 803 | 197.0 |
| D | 13 | 122 | 181874 | 919.3 | 826 | 803 | 197.0 |
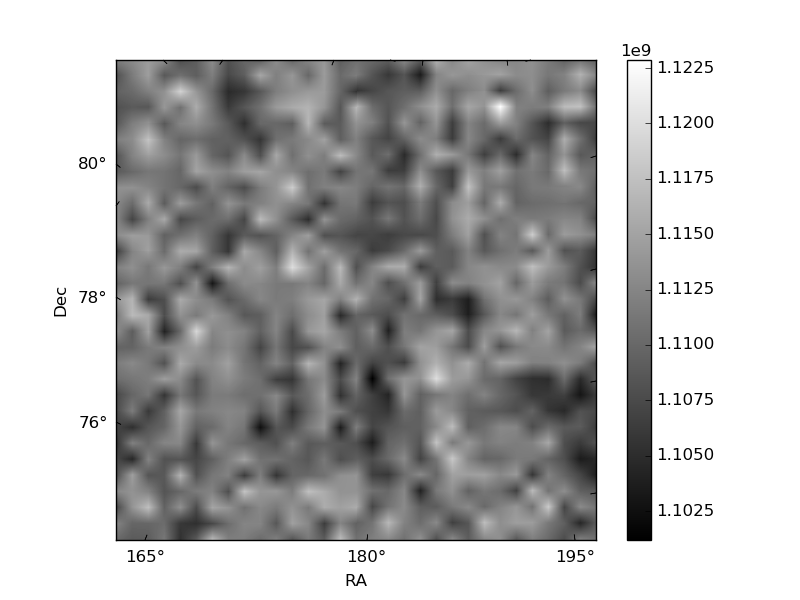
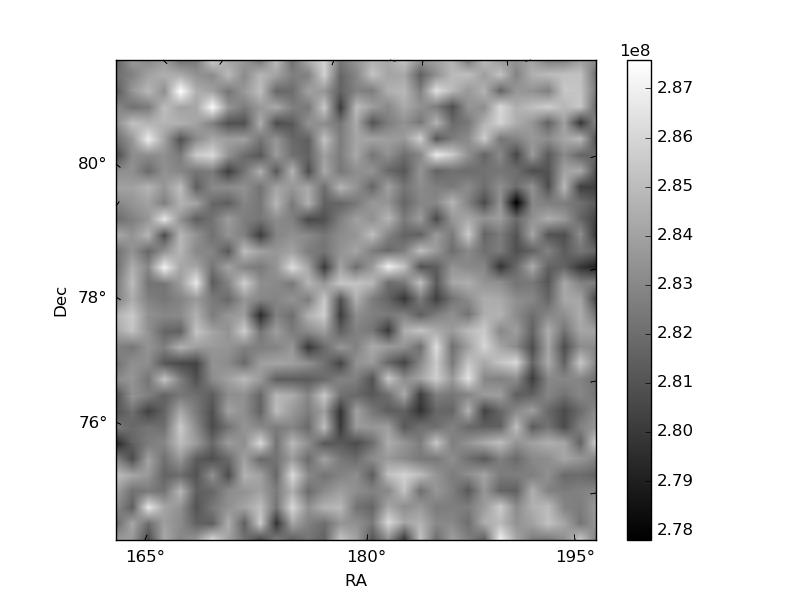
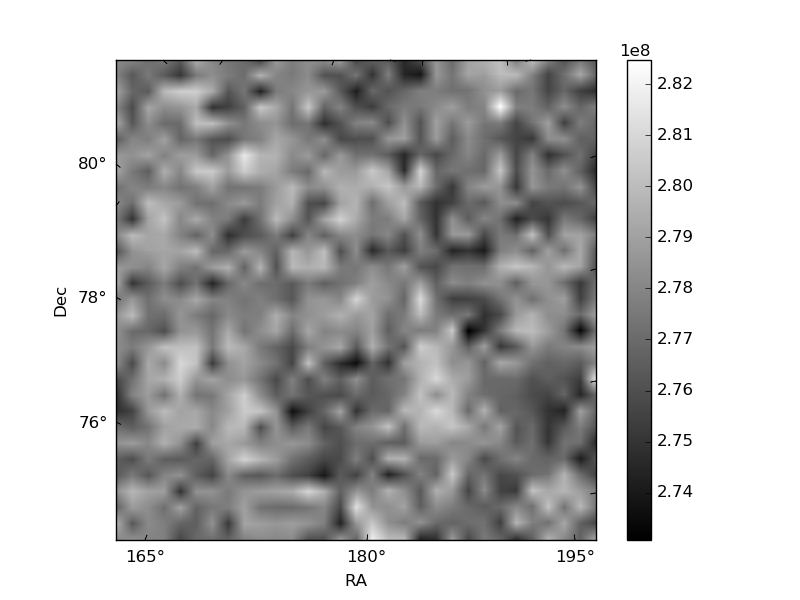
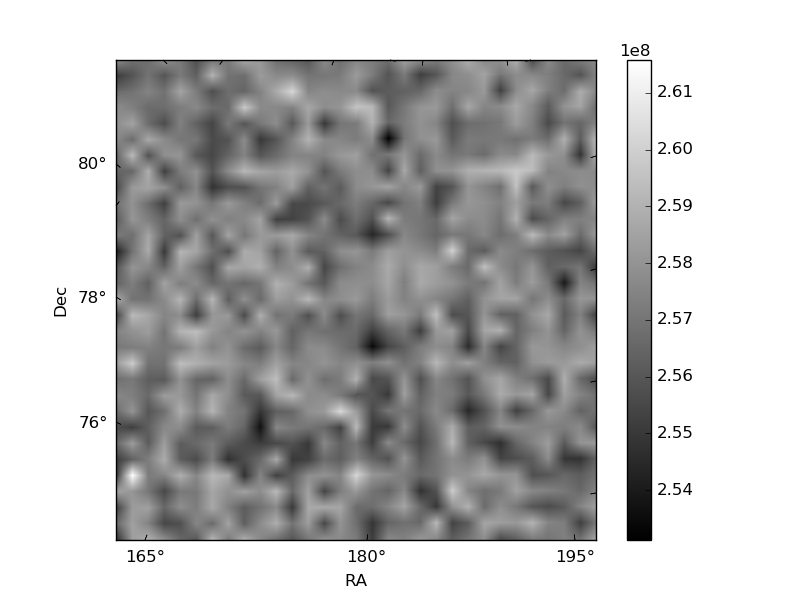
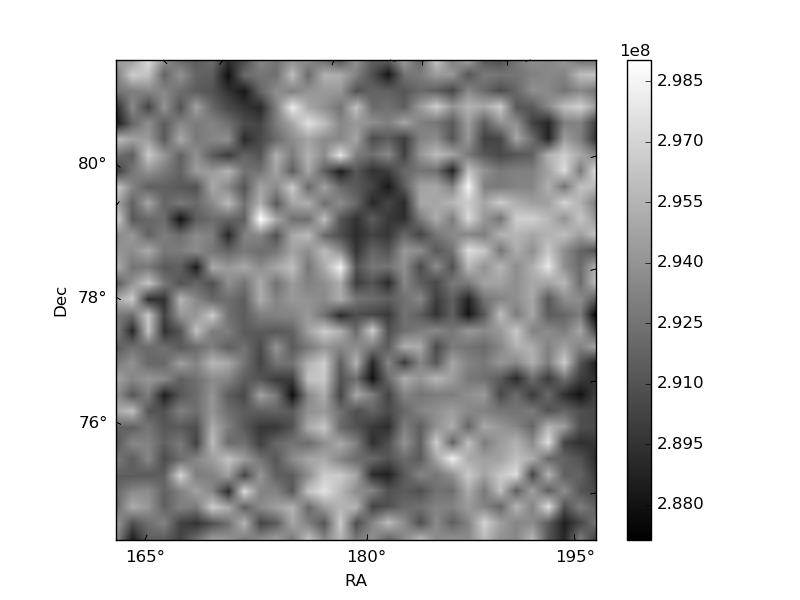
Histogram calculated using DETX and DETY for each event in the final _common_clean file
| Quadrant A | 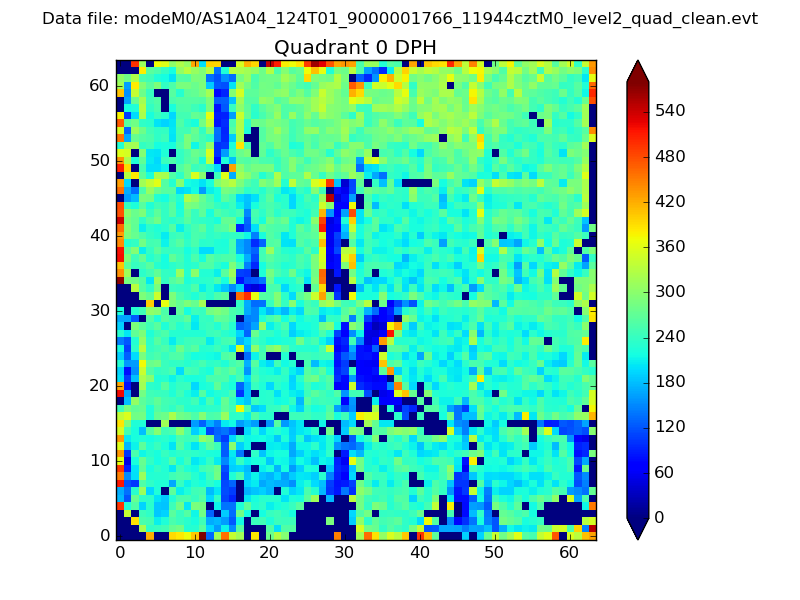 |
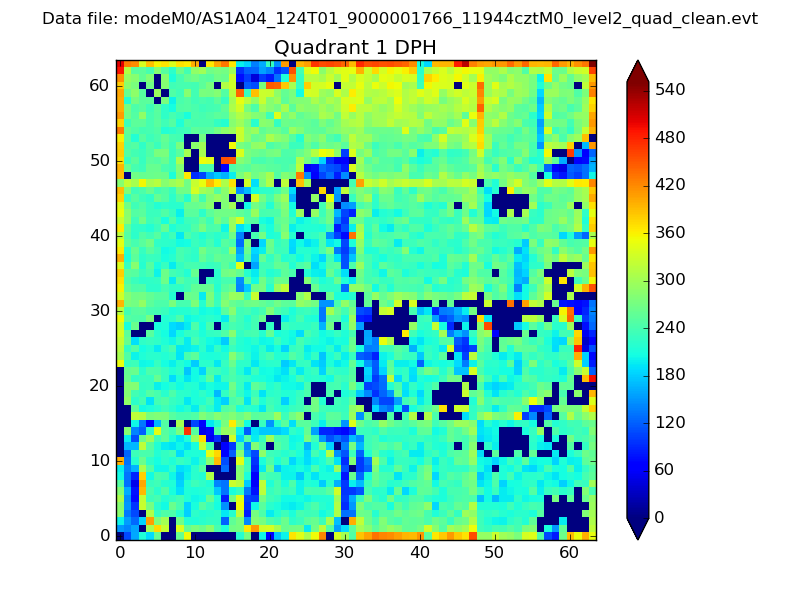 |
Quadrant B |
|---|---|---|---|
| Quadrant D | 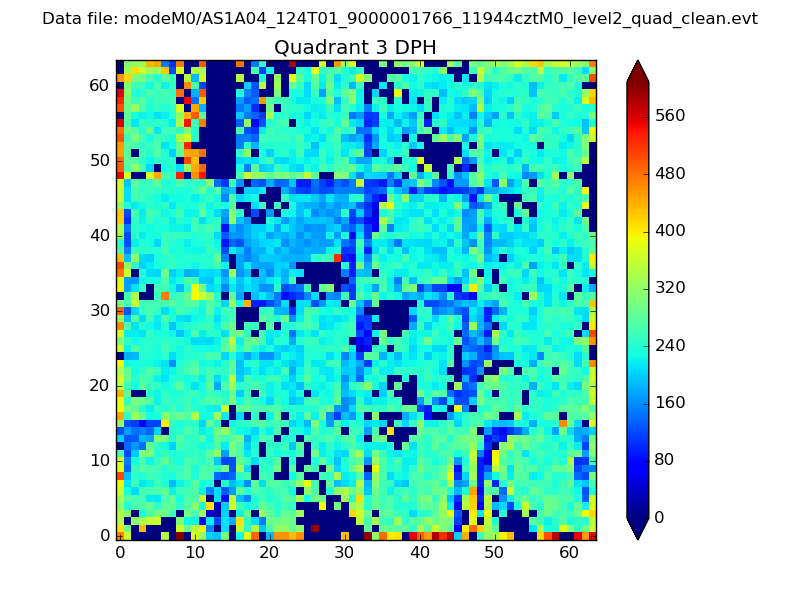 |
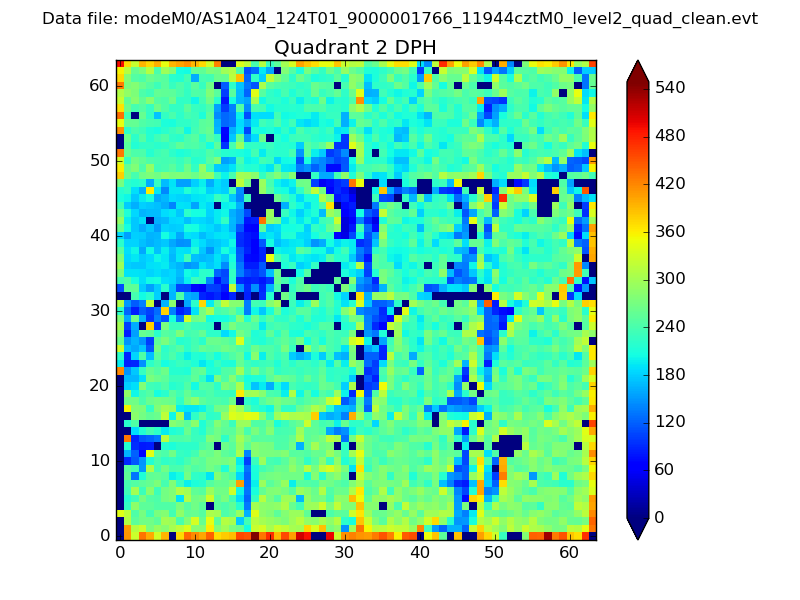 |
Quadrant C |
| Plot type | Count rate plots | Images |
|---|---|---|
| Comparison with Poisson distribution Blue bars denote a histogram of data divided into 1 sec bins. Red curve is a Poisson curve with rate = median count rate of data. |
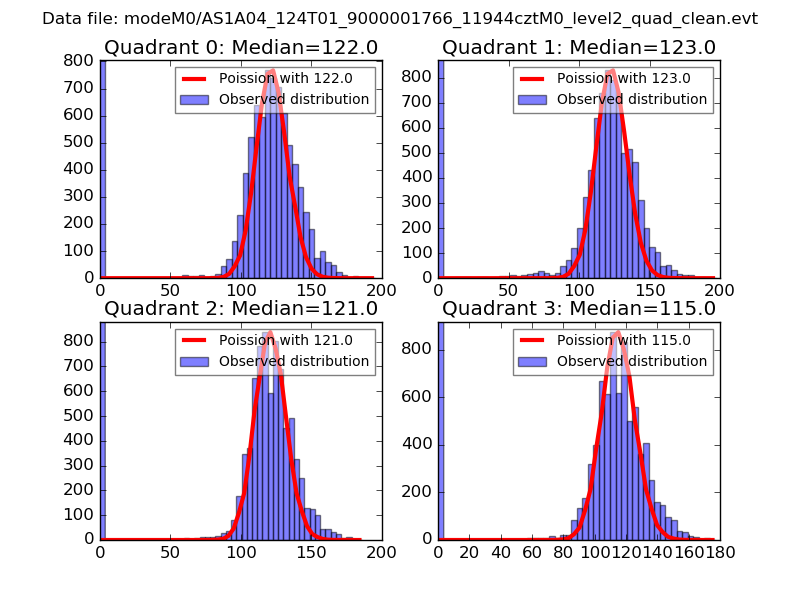 |
 |
| Quadrant-wise count rates Data is divided into 100 sec bins |
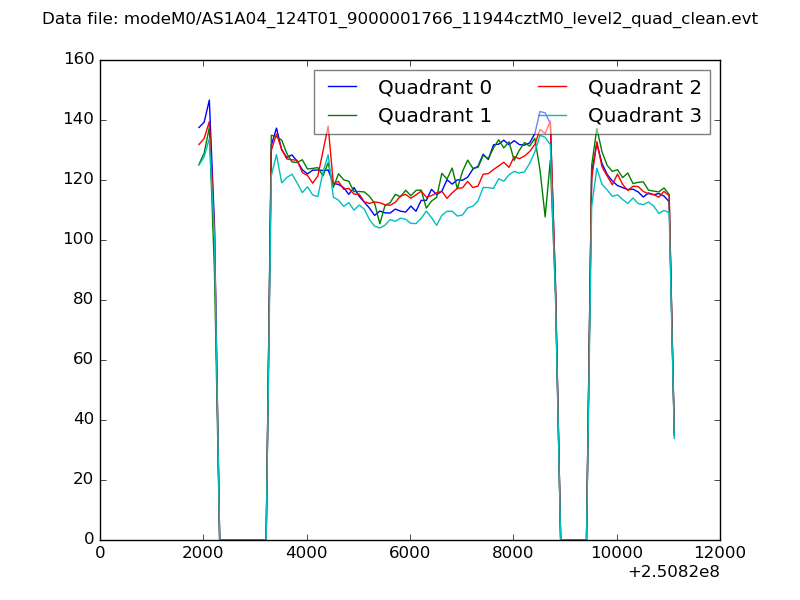 |
|
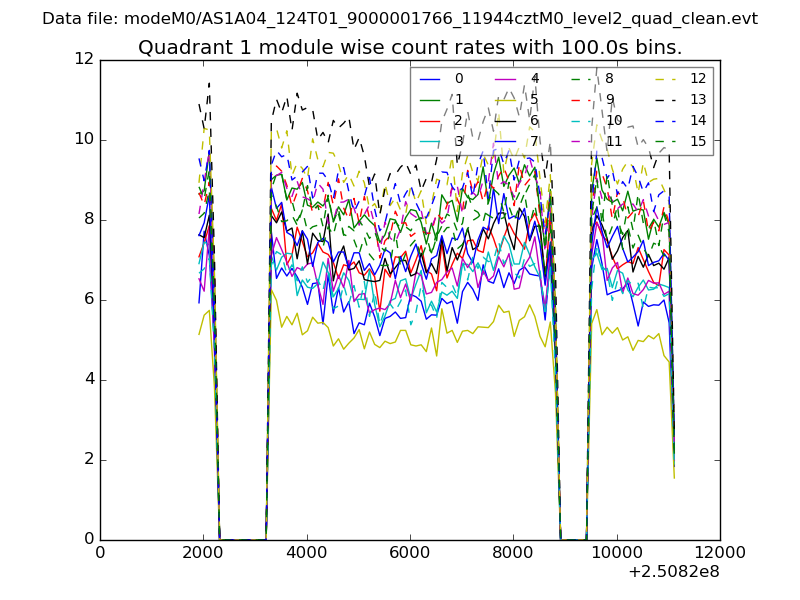
| Module-wise count rates for Quadrant A Data is divided into 100 sec bins |
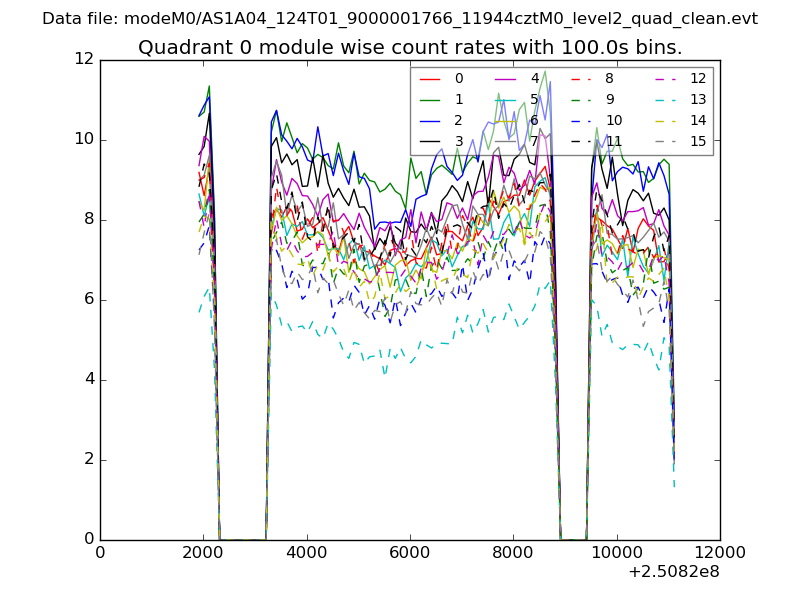 |
 |
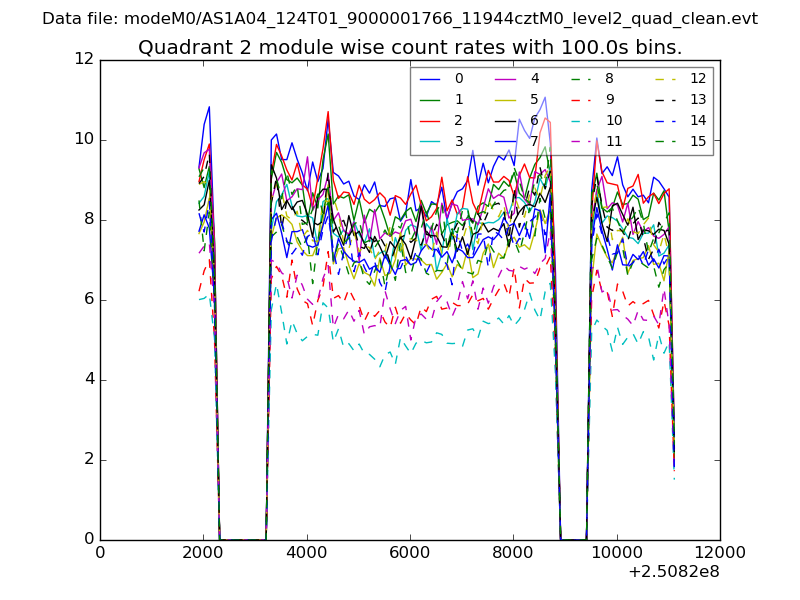
| Module-wise count rates for Quadrant B Data is divided into 100 sec bins |
 |
 |
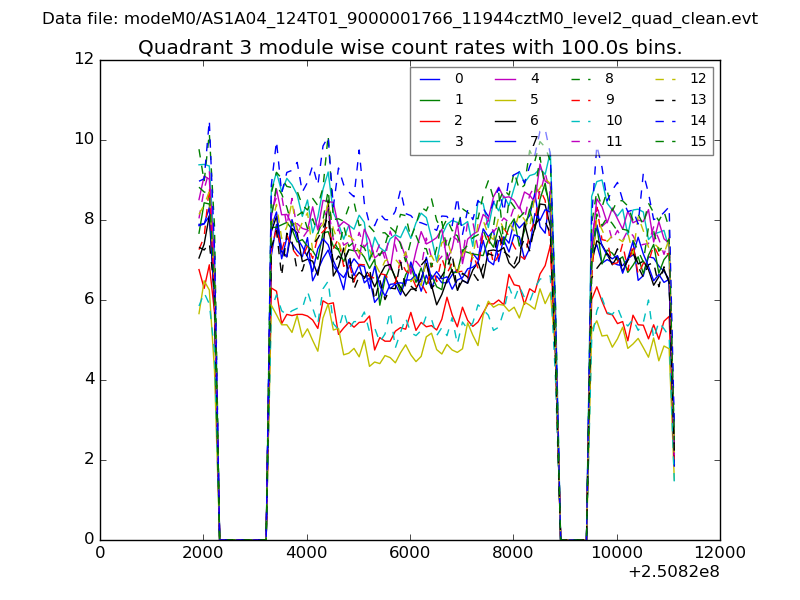
| Module-wise count rates for Quadrant C Data is divided into 100 sec bins |
 |
 |
| Module-wise count rates for Quadrant D Data is divided into 100 sec bins |
 |
 |
| Parameter | Plot |
|---|---|
| CZT HV Monitor | 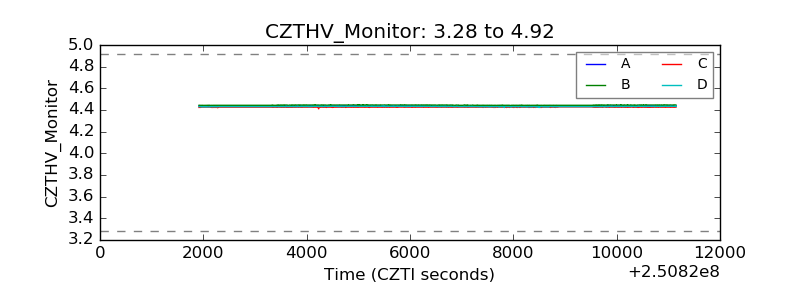 |
| D_VDD | 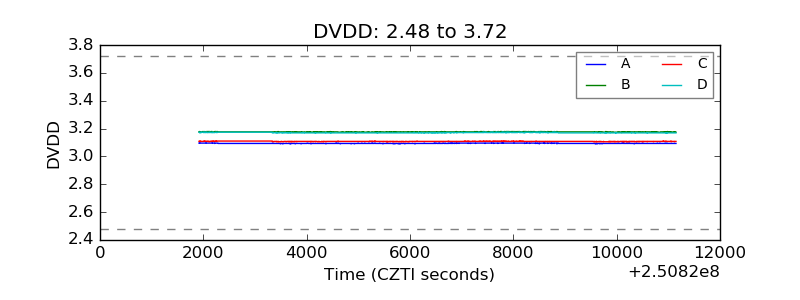 |
| Temperature 1 | 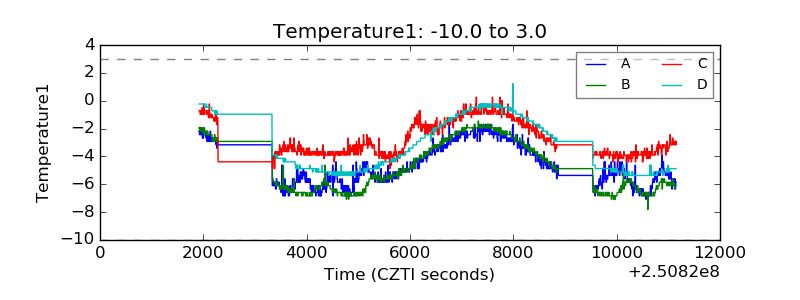 |
| Veto HV Monitor | 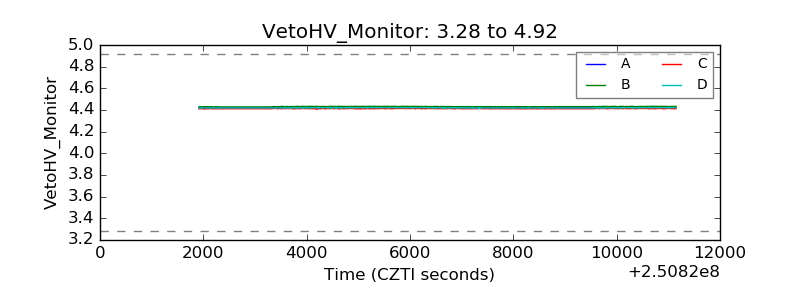 |
| Veto LLD | 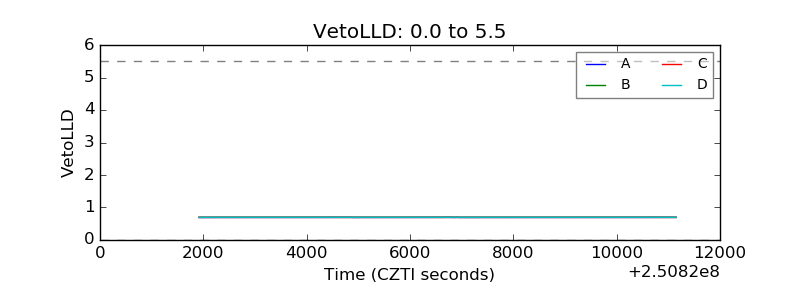 |
| Alpha Counter | 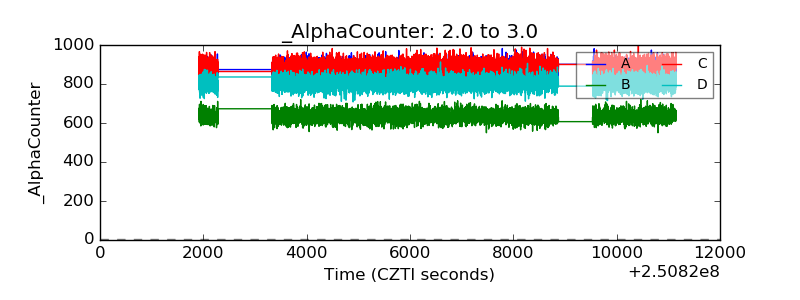 |
| _CPM_Rate | 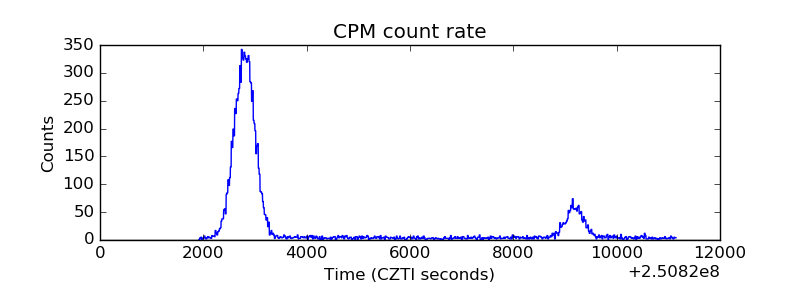 |
| CZT Counter | 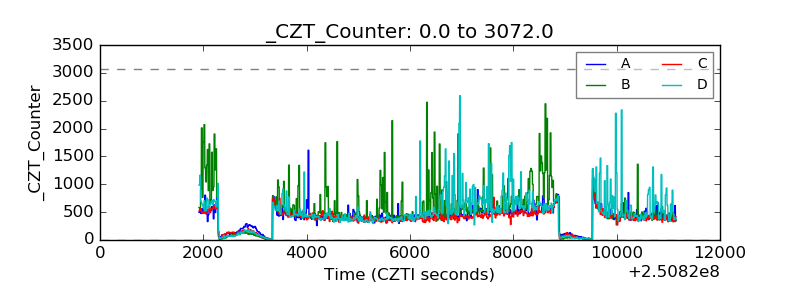 |
| +2.5 Volts monitor |  |
| +5 Volts monitor |  |
| _ROLL_ROT | 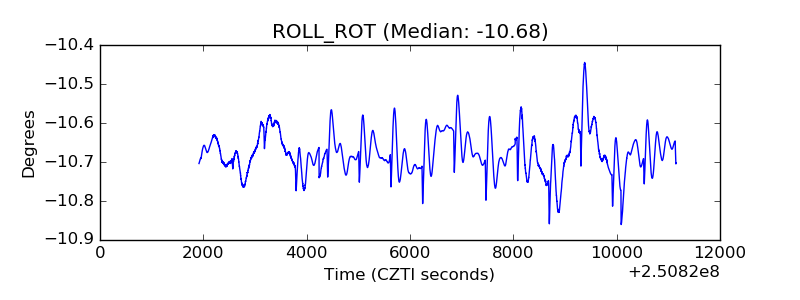 |
| _Roll_DEC | 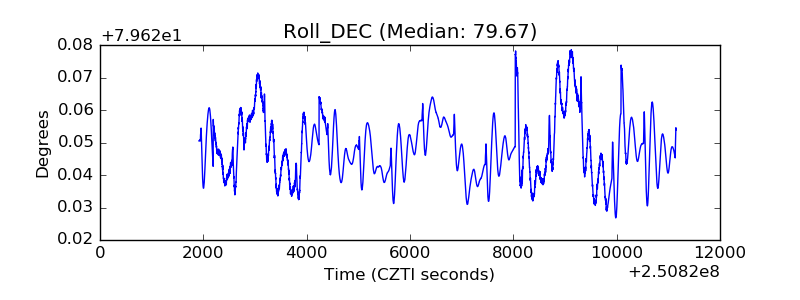 |
| _Roll_RA | 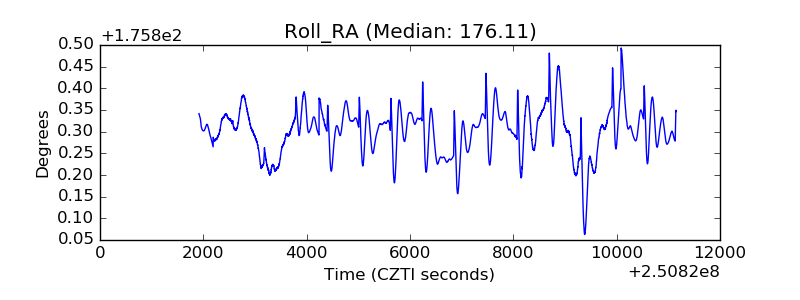 |
| Veto Counter | 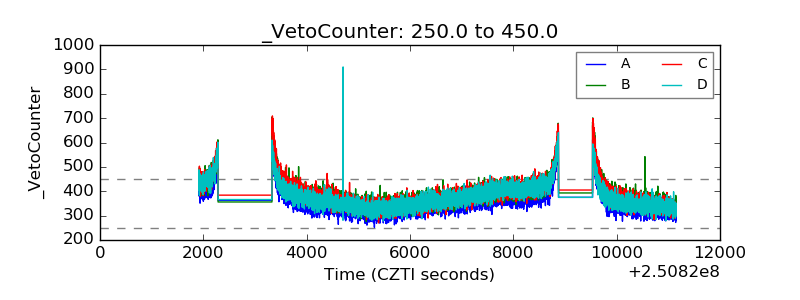 |