| Param | Original file | Final file |
|---|---|---|
| Filename | modeM0/AS1A04_124T01_9000001766_11945cztM0_level2.evt | modeM0/AS1A04_124T01_9000001766_11945cztM0_level2_quad_clean.evt |
| Size (bytes) | 507,954,240 | 120,804,480 |
| Size | 484.4 MB | 115.2 MB |
| Events in quadrant A | 3,419,672 | 807,102 |
| Events in quadrant B | 3,995,259 | 818,885 |
| Events in quadrant C | 2,906,418 | 803,421 |
| Events in quadrant D | 4,601,069 | 756,035 |
| Mode SS | |||
|---|---|---|---|
| Quadrant | BADHDUFLAG | Total packets | Discarded packets |
| A | 0 | 138 | 0 |
| B | 0 | 138 | 0 |
| C | 0 | 138 | 0 |
| D | 0 | 138 | 0 |
| Mode M9 | |||
|---|---|---|---|
| Quadrant | BADHDUFLAG | Total packets | Discarded packets |
| A | 0 | 3 | 0 |
| B | 0 | 3 | 0 |
| C | 0 | 3 | 0 |
| D | 0 | 3 | 0 |
| Mode M0 | |||
|---|---|---|---|
| Quadrant | BADHDUFLAG | Total packets | Discarded packets |
| A | 0 | 14730 | 2 |
| B | 0 | 16598 | 1 |
| C | 0 | 13824 | 1 |
| D | 0 | 18576 | 1 |
| Quadrant | Total seconds | Saturated seconds | Saturation percentage |
|---|---|---|---|
| A | 6791 | 110 | 1.619791% |
| B | 6791 | 275 | 4.049477% |
| C | 6791 | 20 | 0.294507% |
| D | 6791 | 213 | 3.136504% |
Noise dominated data is calculated using 1-second bins in cleaned event files. If a bin has >2000 counts, and if more than 50% of those come from <1% of pixels, then it is considered to be noise-dominated and hence unusable.
| Quadrant | # 1 sec bins | Bins with >0 counts | Bins with >2000 counts | High rate bins dominated by noise | Noise dominated (total time) | Noise dominated (detector-on time) | Marked lightcurve |
|---|---|---|---|---|---|---|---|
| A | 7072 | 6793 | 4 | 4 | 0.06% | 0.06% | 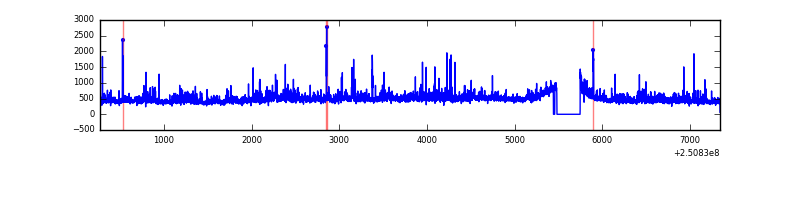 |
| B | 7072 | 6794 | 133 | 133 | 1.88% | 1.96% | 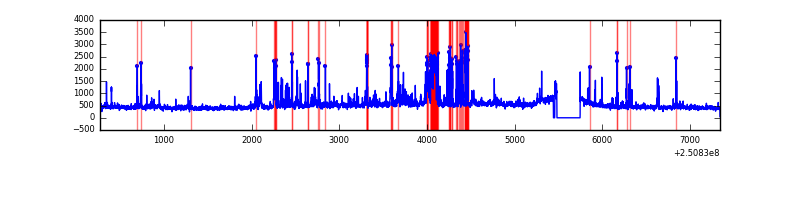 |
| C | 7072 | 6794 | 0 | 0 | 0.00% | 0.00% | 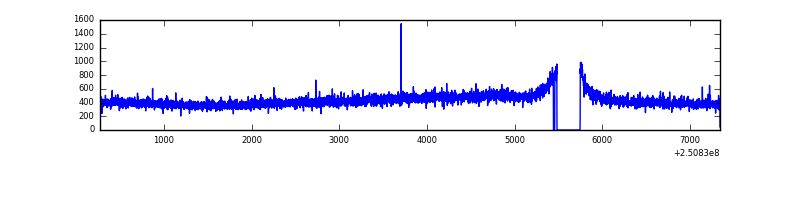 |
| D | 7072 | 6793 | 109 | 109 | 1.54% | 1.60% | 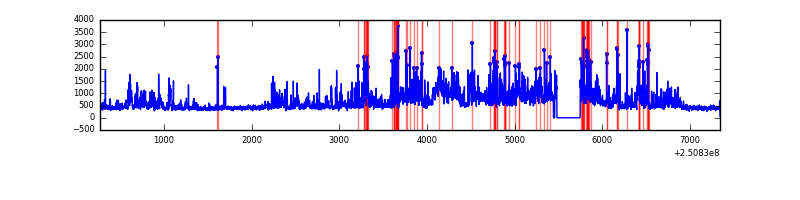 |
Top three noisy pixels from each quadrant. If the there are fewer than three noisy pixels in the level2.evt file, extra rows are filled as -1
| Pixel properties | Quadrant properties | ||||||
|---|---|---|---|---|---|---|---|
| Quadrant | DetID | PixID | Counts | Sigma | Mean | Median | Sigma |
| A | 1 | 162 | 136460 | 868.13 | 765 | 750 | 156.3 |
| A | 7 | 144 | 82761 | 524.62 | 765 | 750 | 156.3 |
| A | 1 | 178 | 73575 | 465.86 | 765 | 750 | 156.3 |
| B | 4 | 239 | 708904 | 4824.58 | 765 | 744 | 146.8 |
| B | 15 | 204 | 115023 | 778.56 | 765 | 744 | 146.8 |
| B | 11 | 51 | 69553 | 468.78 | 765 | 744 | 146.8 |
| C | 0 | 10 | 6707 | 34.88 | 741 | 743 | 171.0 |
| C | 13 | 61 | 5499 | 27.82 | 741 | 743 | 171.0 |
| C | 8 | 128 | 3921 | 18.59 | 741 | 743 | 171.0 |
| D | 1 | 52 | 756253 | 4269.74 | 729 | 706 | 177.0 |
| D | 13 | 122 | 605620 | 3418.49 | 729 | 706 | 177.0 |
| D | 8 | 195 | 224529 | 1264.87 | 729 | 706 | 177.0 |
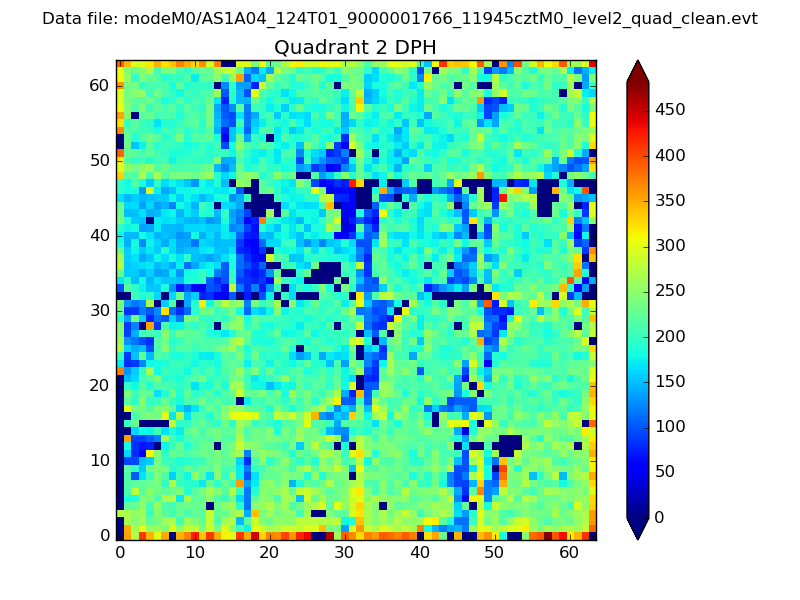
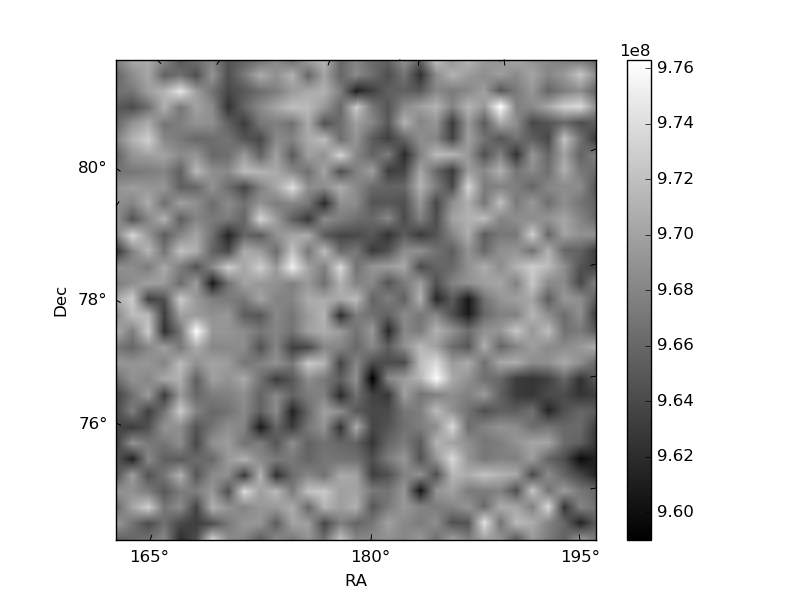
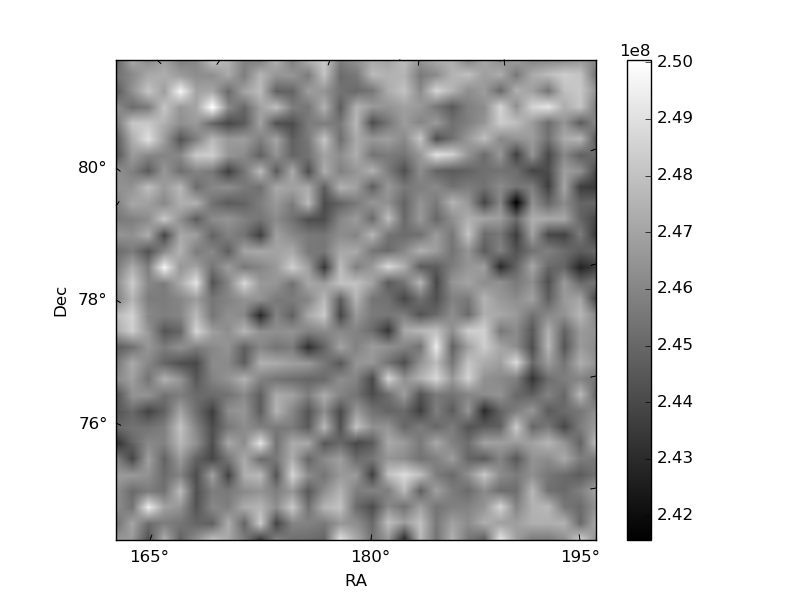
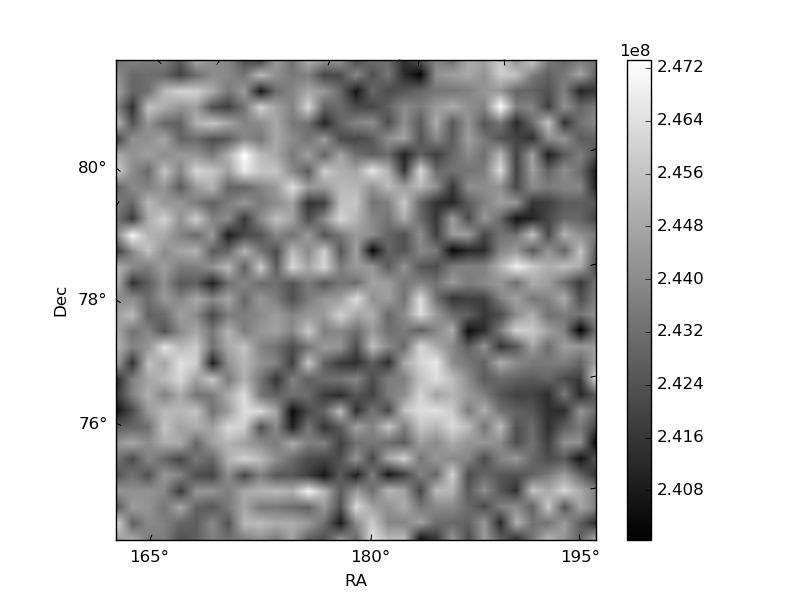
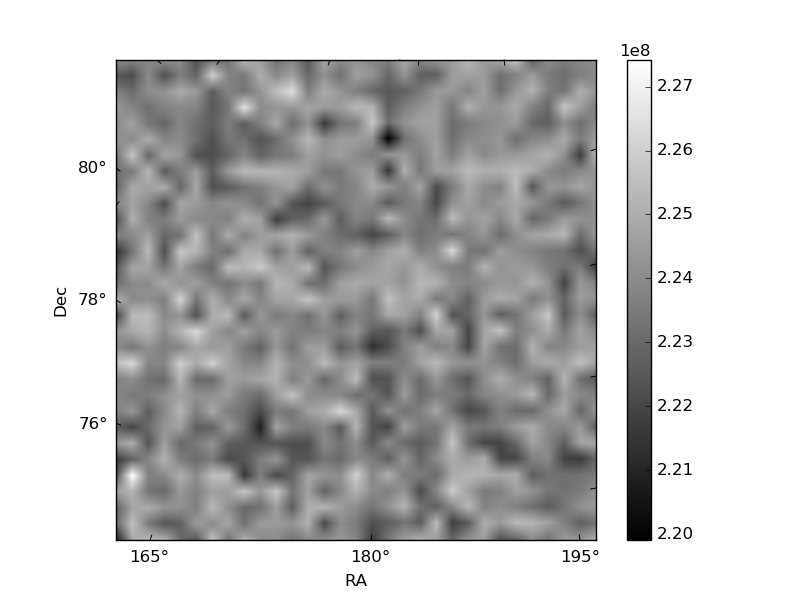
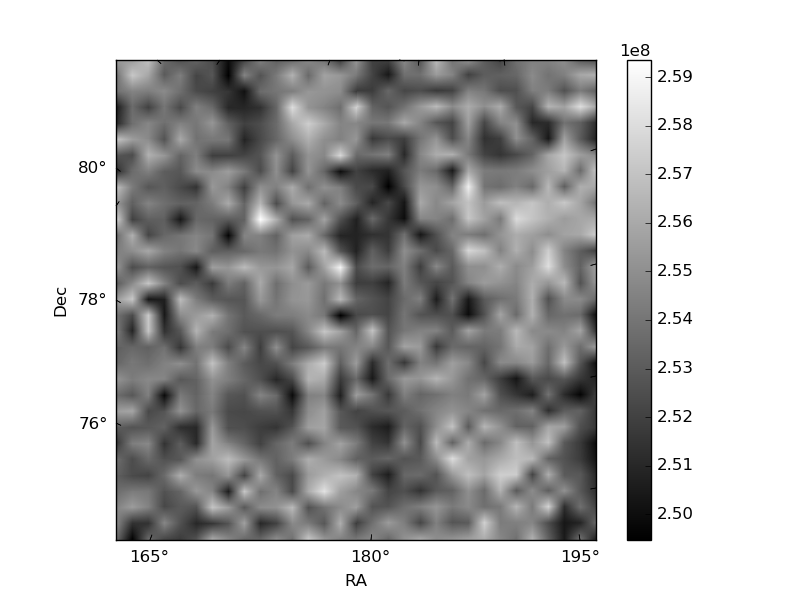
Histogram calculated using DETX and DETY for each event in the final _common_clean file
| Quadrant A | 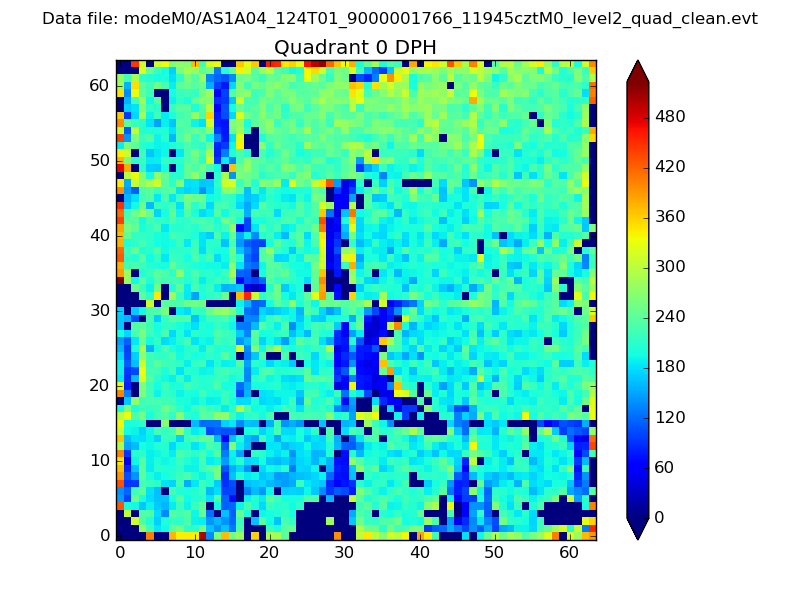 |
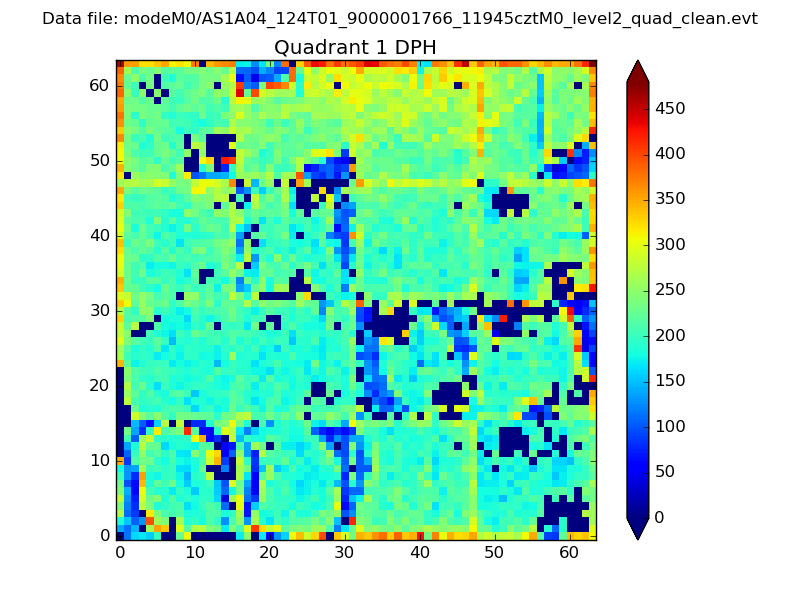 |
Quadrant B |
|---|---|---|---|
| Quadrant D | 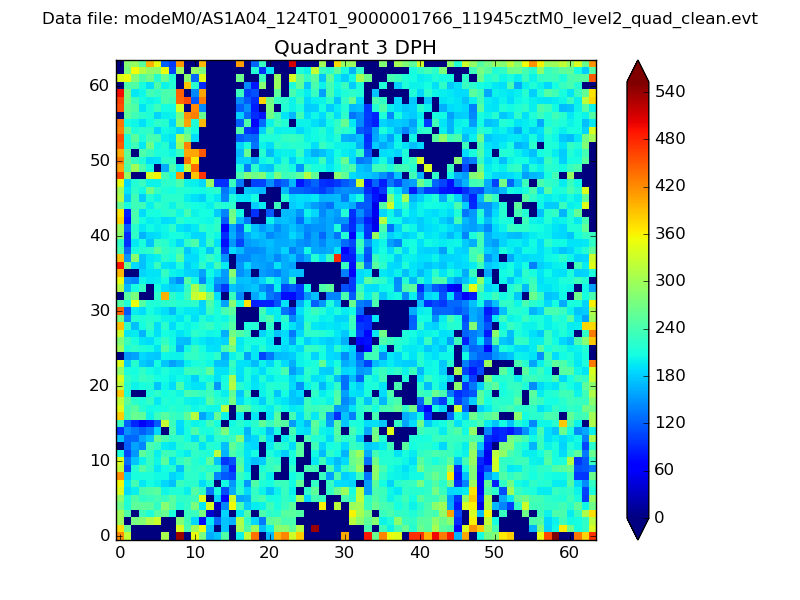 |
 |
Quadrant C |
| Plot type | Count rate plots | Images |
|---|---|---|
| Comparison with Poisson distribution Blue bars denote a histogram of data divided into 1 sec bins. Red curve is a Poisson curve with rate = median count rate of data. |
 |
 |
| Quadrant-wise count rates Data is divided into 100 sec bins |
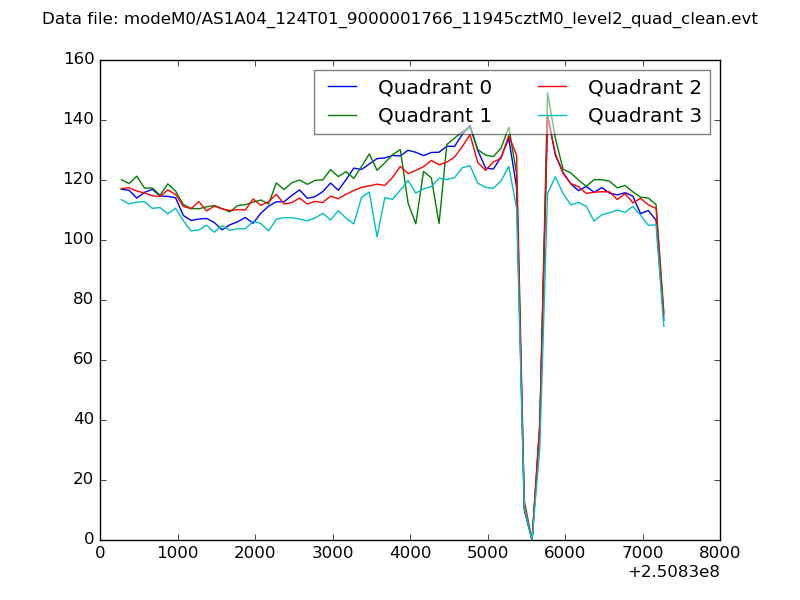 |
|
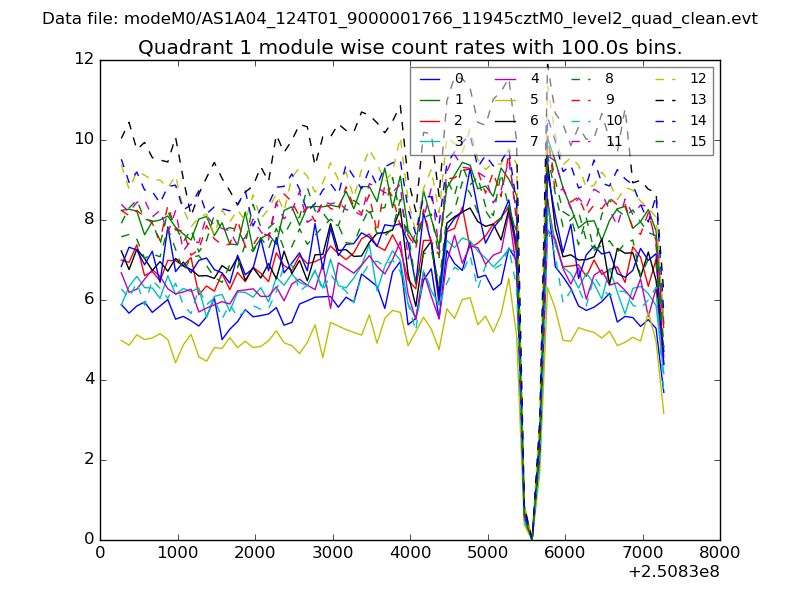
| Module-wise count rates for Quadrant A Data is divided into 100 sec bins |
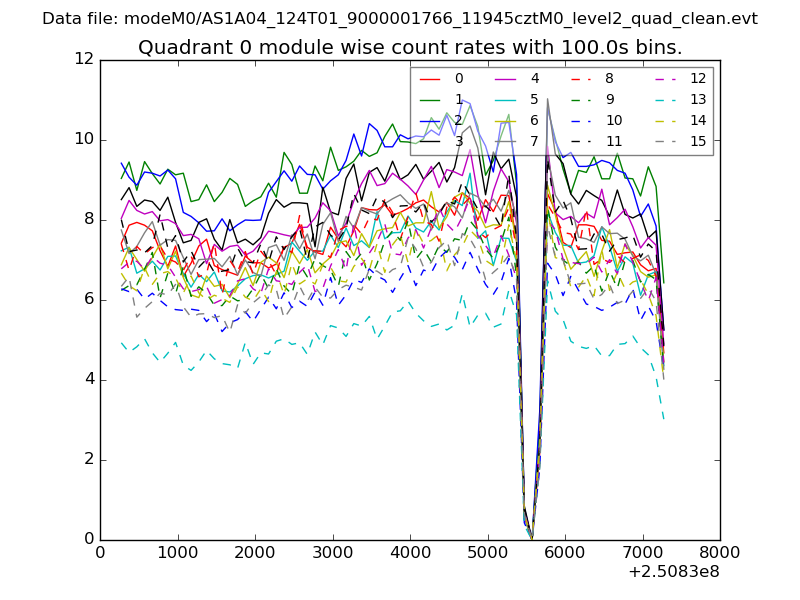 |
 |
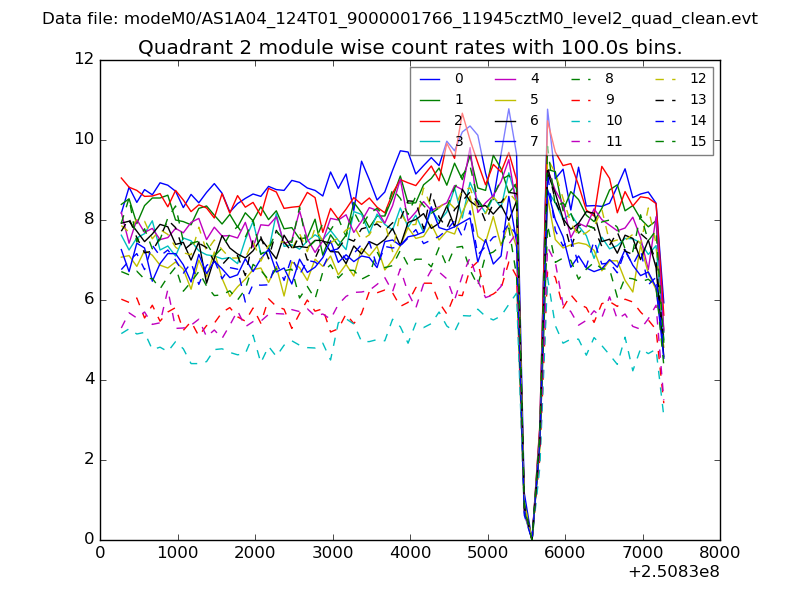
| Module-wise count rates for Quadrant B Data is divided into 100 sec bins |
 |
 |
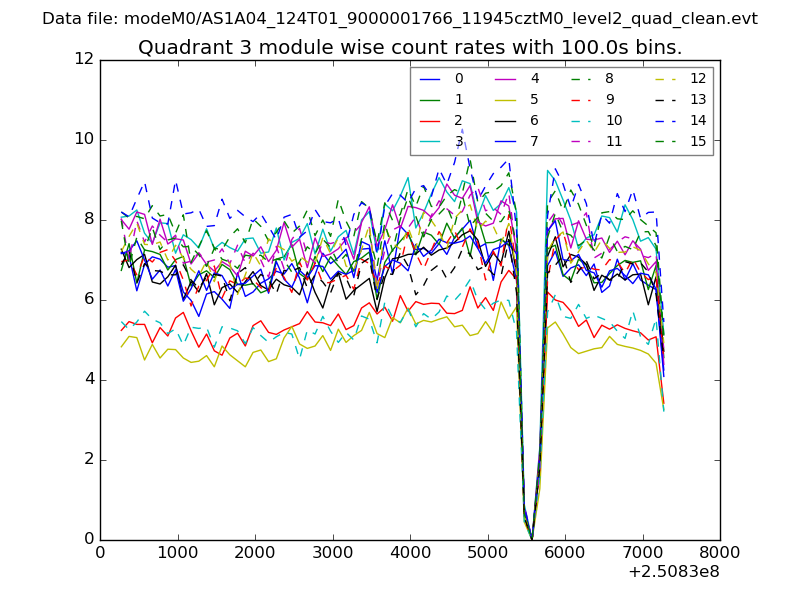
| Module-wise count rates for Quadrant C Data is divided into 100 sec bins |
 |
 |
| Module-wise count rates for Quadrant D Data is divided into 100 sec bins |
 |
 |
| Parameter | Plot |
|---|---|
| CZT HV Monitor | 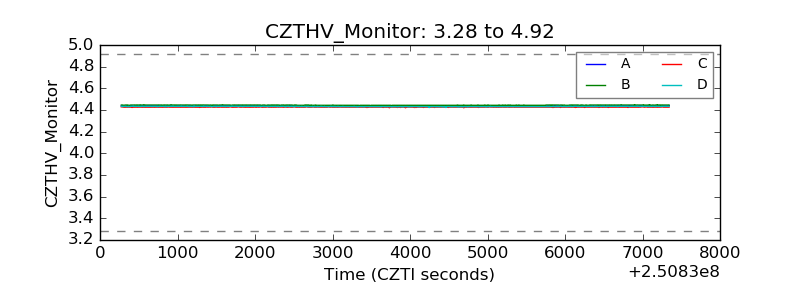 |
| D_VDD | 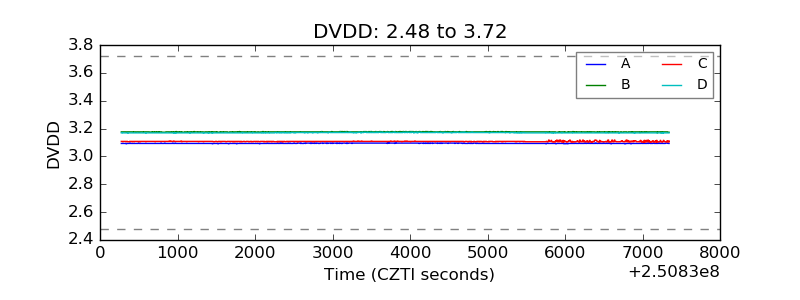 |
| Temperature 1 | 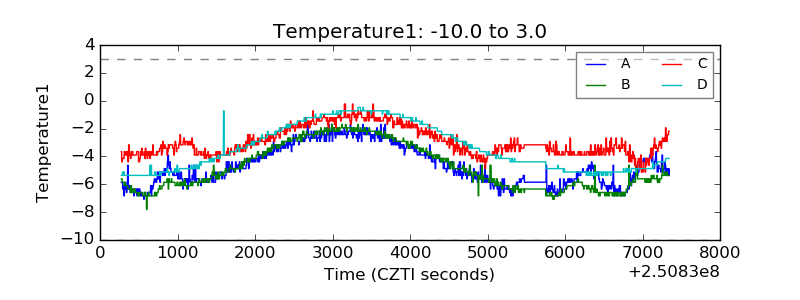 |
| Veto HV Monitor | 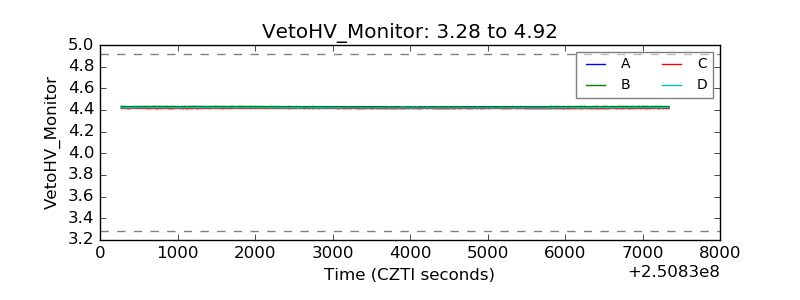 |
| Veto LLD | 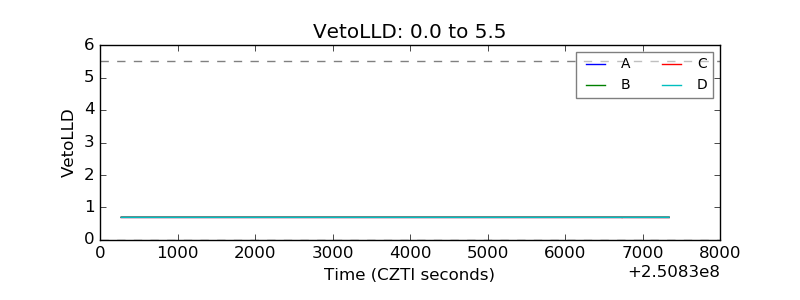 |
| Alpha Counter | 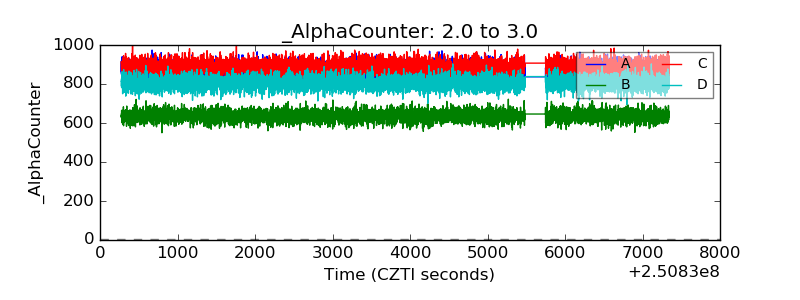 |
| _CPM_Rate | 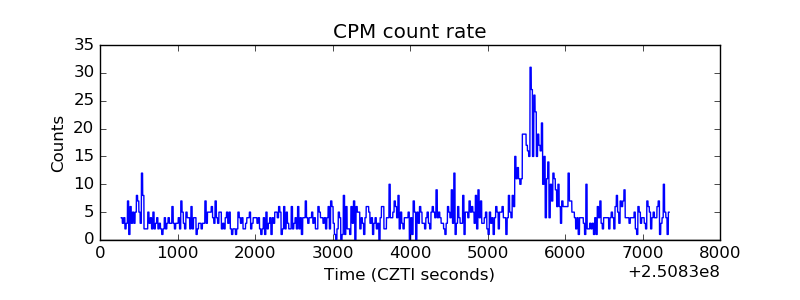 |
| CZT Counter | 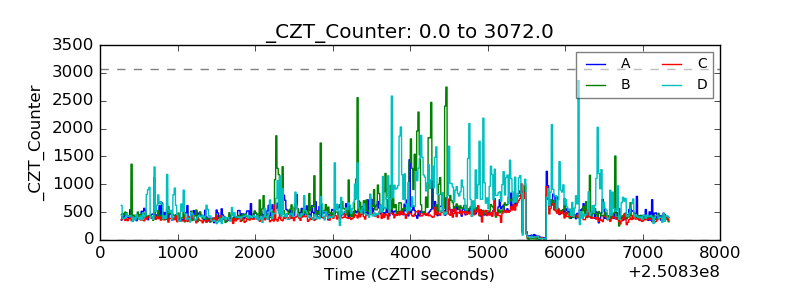 |
| +2.5 Volts monitor |  |
| +5 Volts monitor | 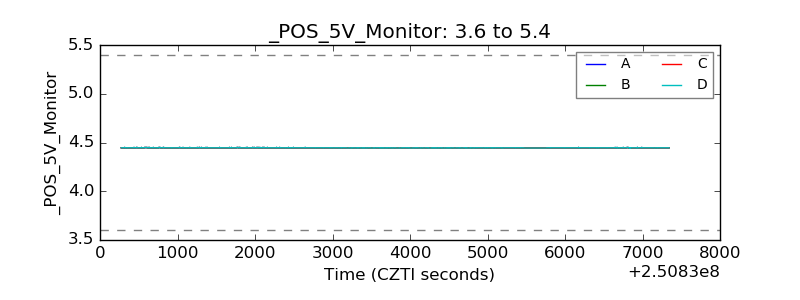 |
| _ROLL_ROT | 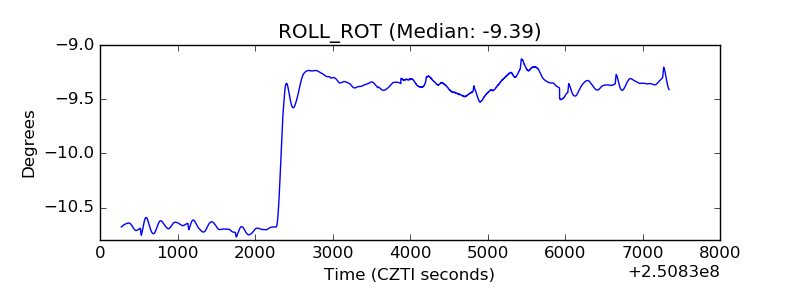 |
| _Roll_DEC | 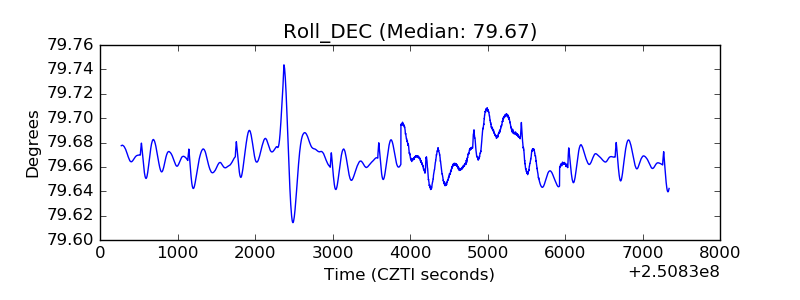 |
| _Roll_RA | 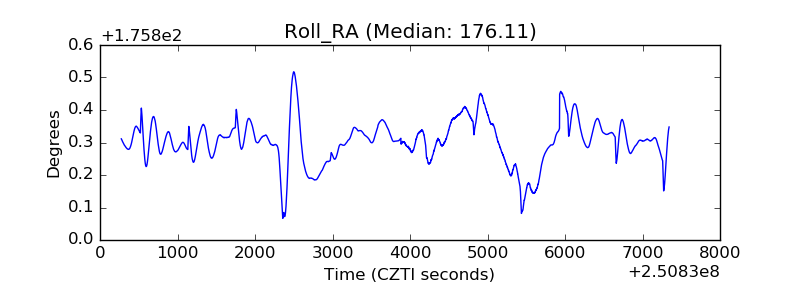 |
| Veto Counter | 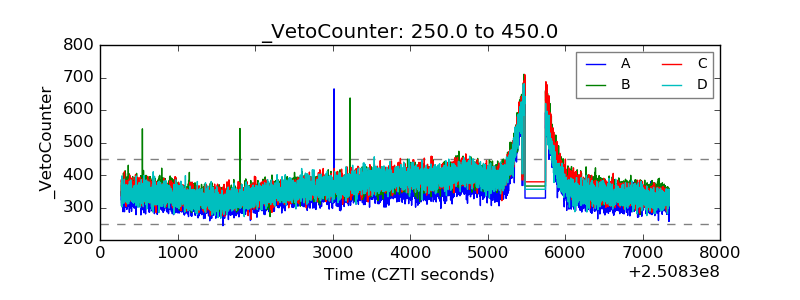 |