| Param | Original file | Final file |
|---|---|---|
| Filename | modeM0/AS1A04_124T01_9000001766_11950cztM0_level2.evt | modeM0/AS1A04_124T01_9000001766_11950cztM0_level2_quad_clean.evt |
| Size (bytes) | 1,698,802,560 | 406,909,440 |
| Size | 1.6 GB | 388.1 MB |
| Events in quadrant A | 11,792,042 | 2,752,501 |
| Events in quadrant B | 14,897,020 | 2,737,720 |
| Events in quadrant C | 9,914,601 | 2,695,403 |
| Events in quadrant D | 13,291,570 | 2,557,080 |
| Mode SS | |||
|---|---|---|---|
| Quadrant | BADHDUFLAG | Total packets | Discarded packets |
| A | 0 | 470 | 0 |
| B | 0 | 470 | 0 |
| C | 0 | 470 | 0 |
| D | 0 | 470 | 0 |
| Mode M9 | |||
|---|---|---|---|
| Quadrant | BADHDUFLAG | Total packets | Discarded packets |
| A | 0 | 25 | 0 |
| B | 0 | 25 | 0 |
| C | 0 | 25 | 0 |
| D | 0 | 25 | 0 |
| Mode M0 | |||
|---|---|---|---|
| Quadrant | BADHDUFLAG | Total packets | Discarded packets |
| A | 0 | 50054 | 5 |
| B | 0 | 59229 | 4 |
| C | 0 | 46442 | 4 |
| D | 0 | 54312 | 4 |
| Quadrant | Total seconds | Saturated seconds | Saturation percentage |
|---|---|---|---|
| A | 22989 | 422 | 1.835661% |
| B | 22989 | 1210 | 5.263387% |
| C | 22989 | 141 | 0.613337% |
| D | 22989 | 741 | 3.223281% |
Noise dominated data is calculated using 1-second bins in cleaned event files. If a bin has >2000 counts, and if more than 50% of those come from <1% of pixels, then it is considered to be noise-dominated and hence unusable.
| Quadrant | # 1 sec bins | Bins with >0 counts | Bins with >2000 counts | High rate bins dominated by noise | Noise dominated (total time) | Noise dominated (detector-on time) | Marked lightcurve |
|---|---|---|---|---|---|---|---|
| A | 25565 | 22990 | 78 | 78 | 0.31% | 0.34% | 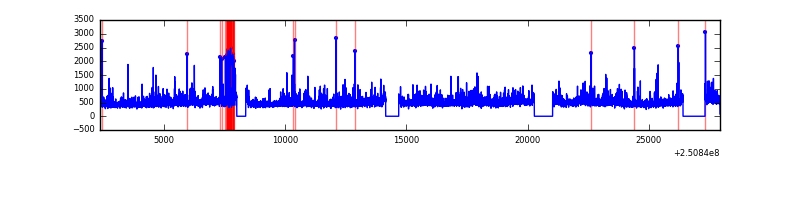 |
| B | 25565 | 22990 | 777 | 777 | 3.04% | 3.38% | 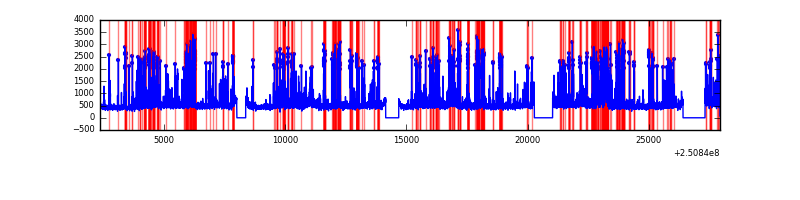 |
| C | 25565 | 22990 | 0 | 0 | 0.00% | 0.00% | 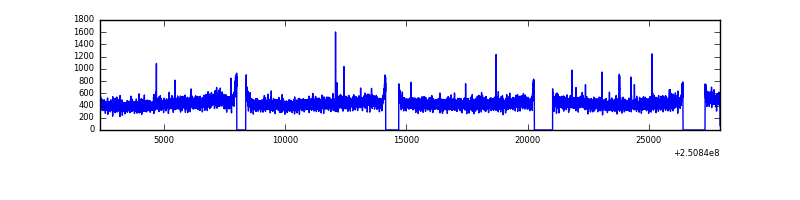 |
| D | 25565 | 22990 | 559 | 559 | 2.19% | 2.43% | 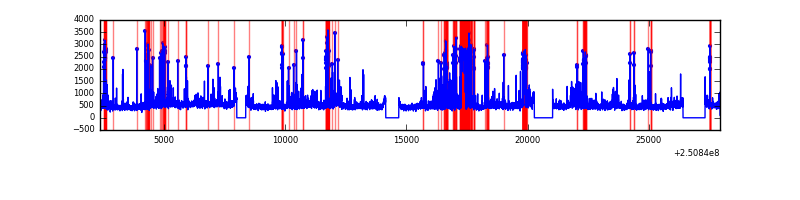 |
Top three noisy pixels from each quadrant. If the there are fewer than three noisy pixels in the level2.evt file, extra rows are filled as -1
| Pixel properties | Quadrant properties | ||||||
|---|---|---|---|---|---|---|---|
| Quadrant | DetID | PixID | Counts | Sigma | Mean | Median | Sigma |
| A | 11 | 29 | 366064 | 690.44 | 2616 | 2560 | 526.5 |
| A | 8 | 15 | 364834 | 688.1 | 2616 | 2560 | 526.5 |
| A | 1 | 162 | 362005 | 682.73 | 2616 | 2560 | 526.5 |
| B | 4 | 239 | 3868116 | 7900.17 | 2588 | 2527 | 489.3 |
| B | 15 | 204 | 515808 | 1049.0 | 2588 | 2527 | 489.3 |
| B | 5 | 255 | 95397 | 189.8 | 2588 | 2527 | 489.3 |
| C | 13 | 61 | 18389 | 27.36 | 2530 | 2535 | 579.4 |
| C | 1 | 16 | 17131 | 25.19 | 2530 | 2535 | 579.4 |
| C | 14 | 234 | 15450 | 22.29 | 2530 | 2535 | 579.4 |
| D | 8 | 195 | 1035074 | 1728.48 | 2493 | 2419 | 597.4 |
| D | 10 | 199 | 768408 | 1282.13 | 2493 | 2419 | 597.4 |
| D | 1 | 52 | 534507 | 890.62 | 2493 | 2419 | 597.4 |
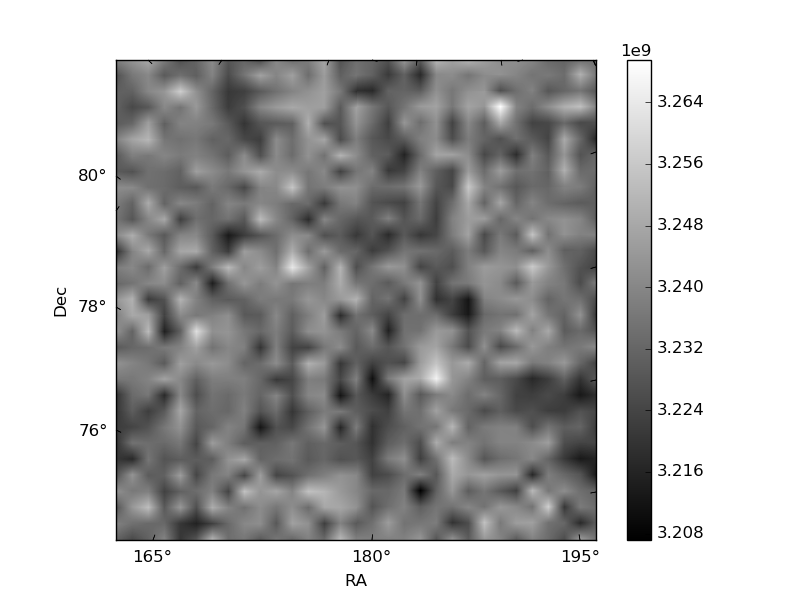
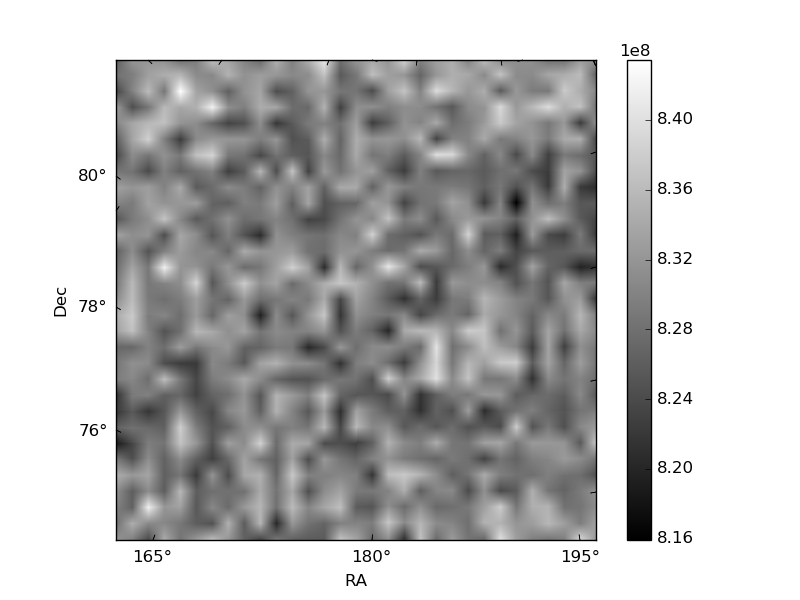
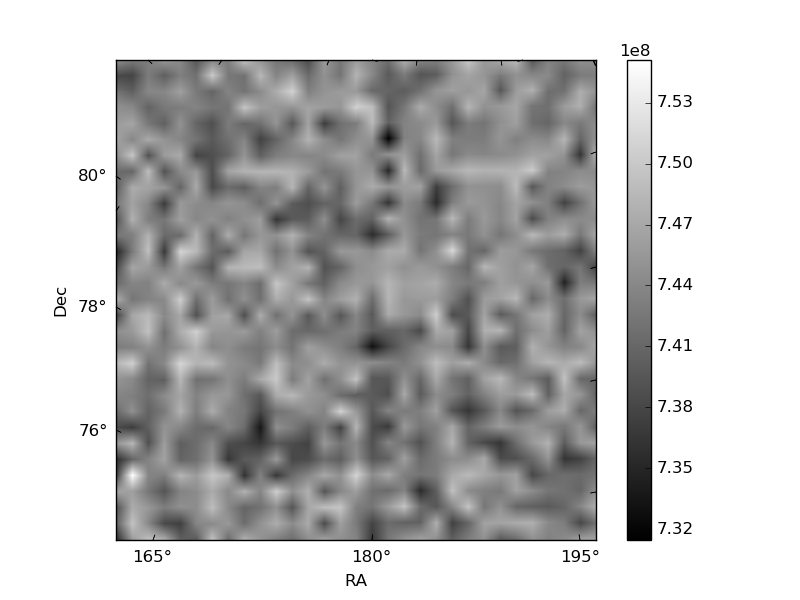
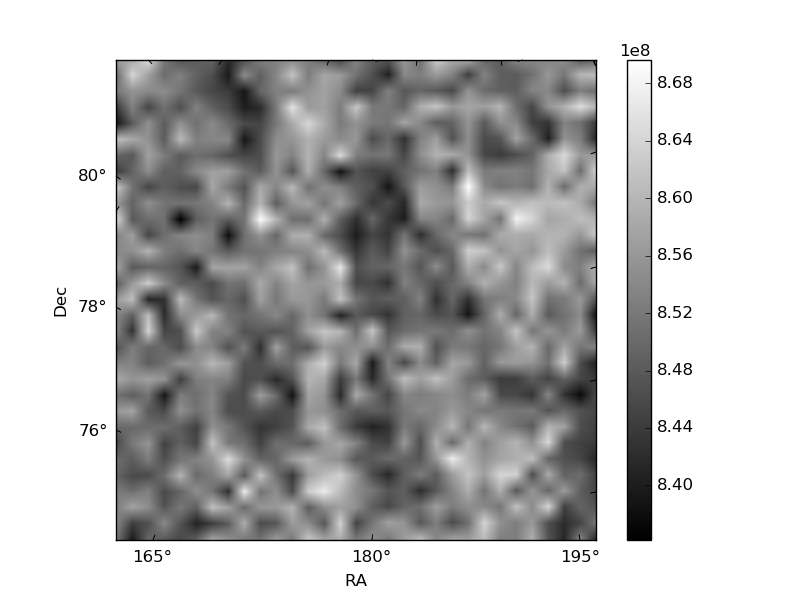
Histogram calculated using DETX and DETY for each event in the final _common_clean file
| Quadrant A | 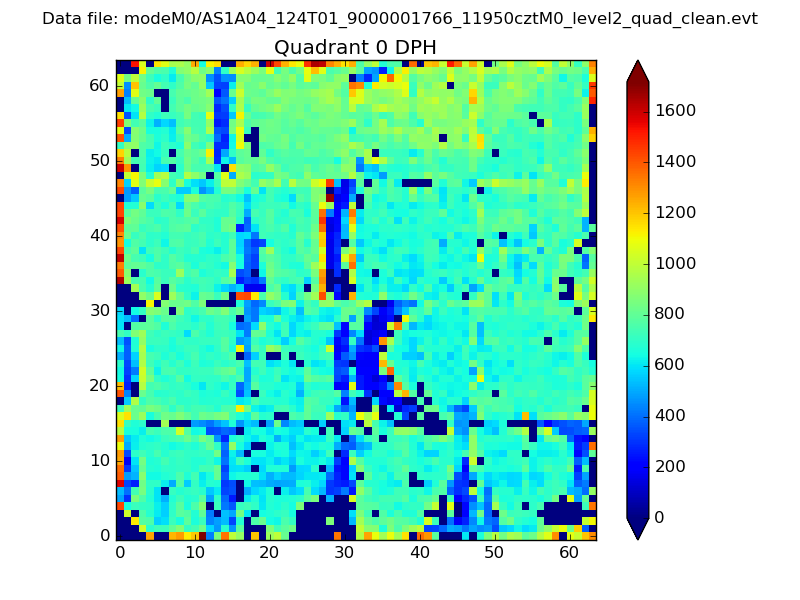 |
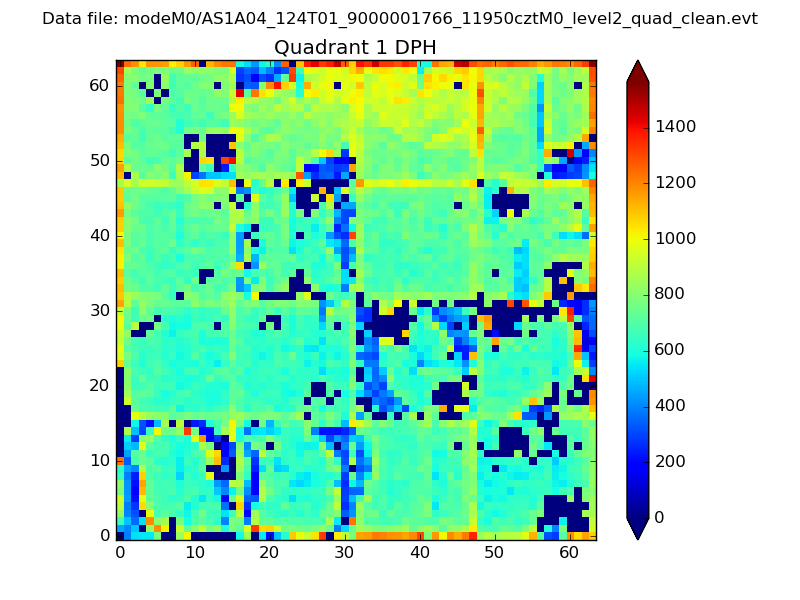 |
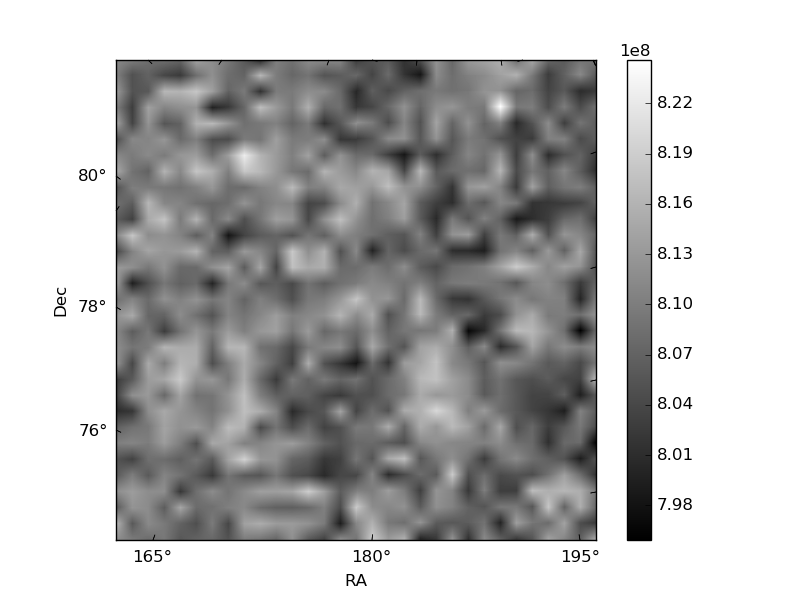
Quadrant B |
|---|---|---|---|
| Quadrant D | 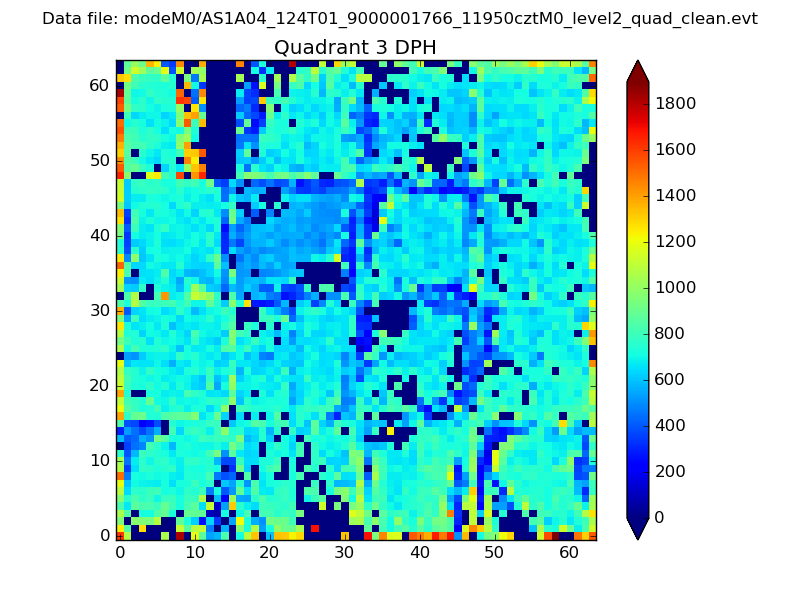 |
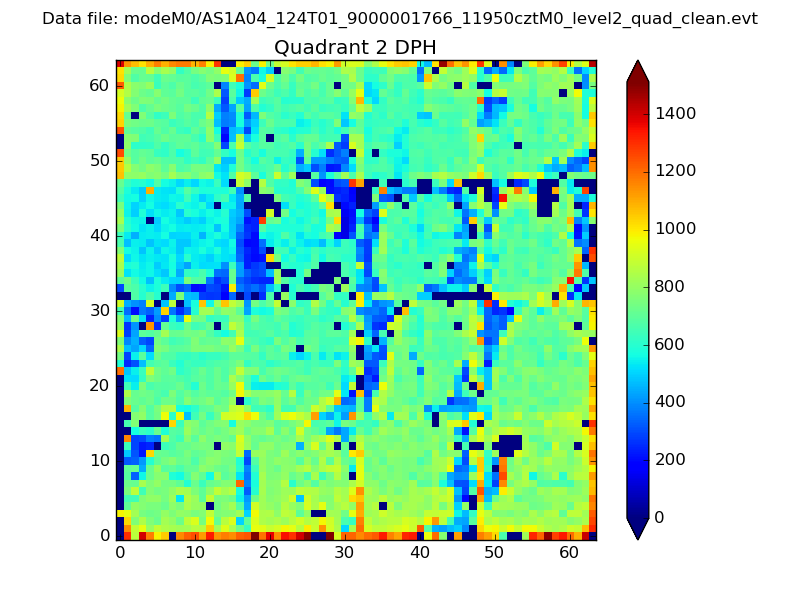 |
Quadrant C |
| Plot type | Count rate plots | Images |
|---|---|---|
| Comparison with Poisson distribution Blue bars denote a histogram of data divided into 1 sec bins. Red curve is a Poisson curve with rate = median count rate of data. |
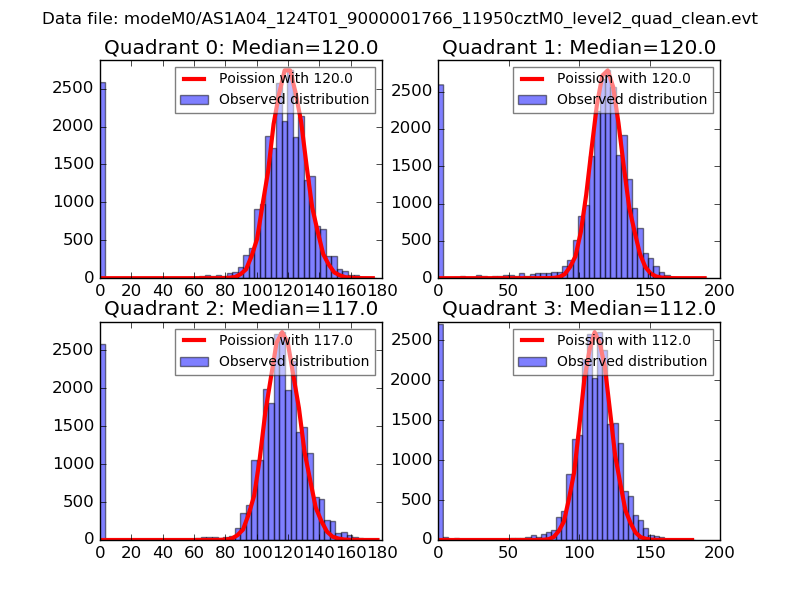 |
 |
| Quadrant-wise count rates Data is divided into 100 sec bins |
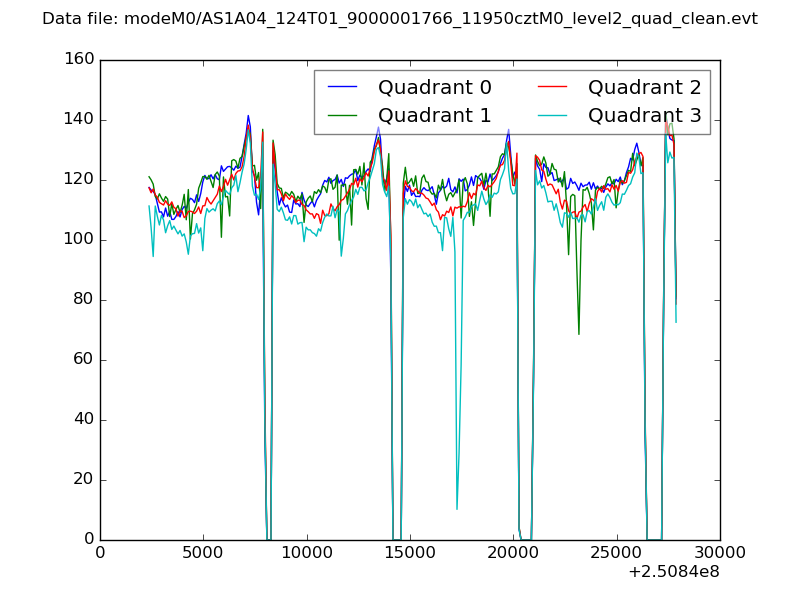 |
|
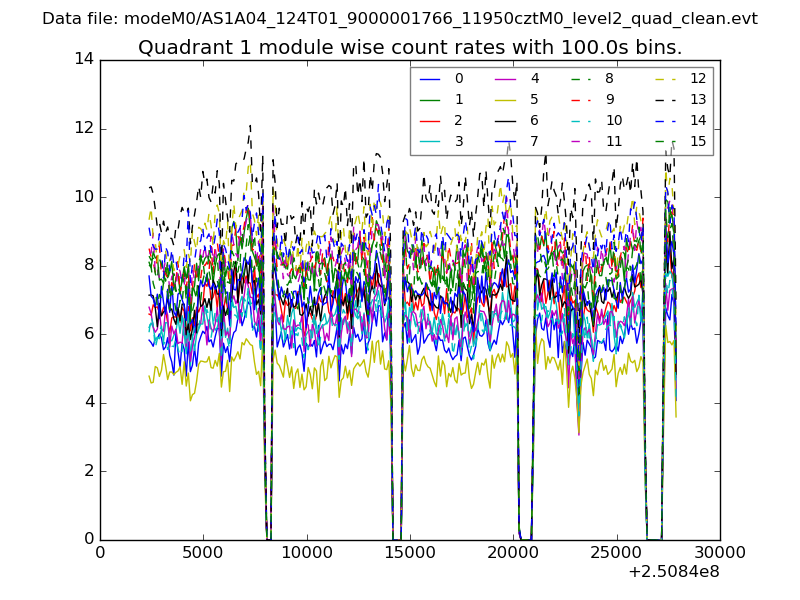
| Module-wise count rates for Quadrant A Data is divided into 100 sec bins |
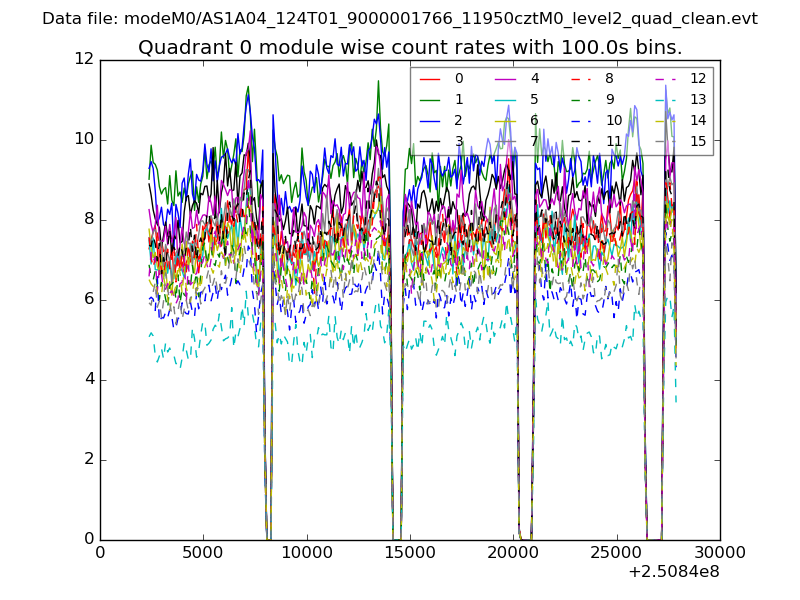 |
 |
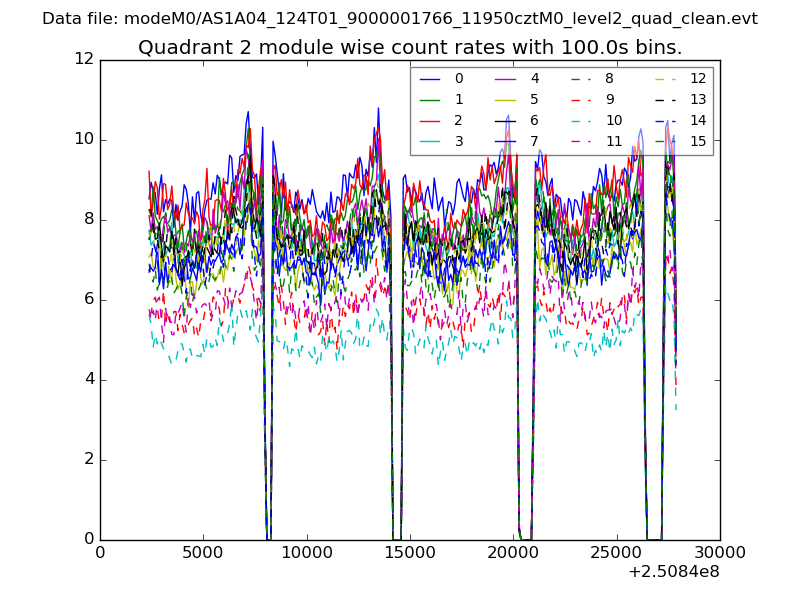
| Module-wise count rates for Quadrant B Data is divided into 100 sec bins |
 |
 |
| Module-wise count rates for Quadrant C Data is divided into 100 sec bins |
 |
 |
| Module-wise count rates for Quadrant D Data is divided into 100 sec bins |
 |
 |
| Parameter | Plot |
|---|---|
| CZT HV Monitor | 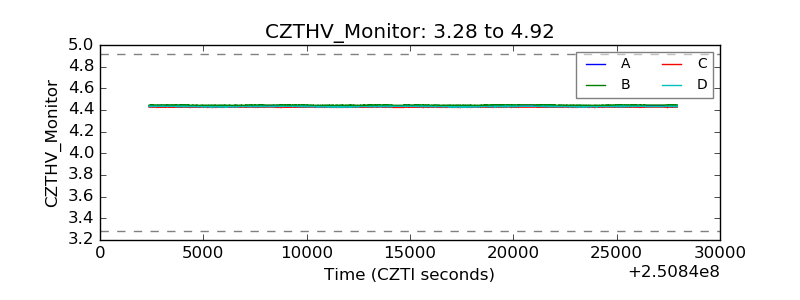 |
| D_VDD | 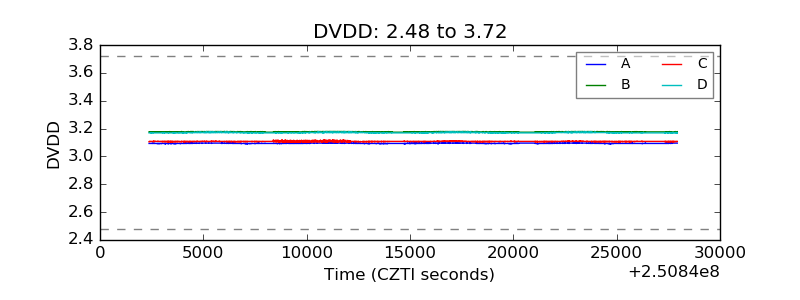 |
| Temperature 1 | 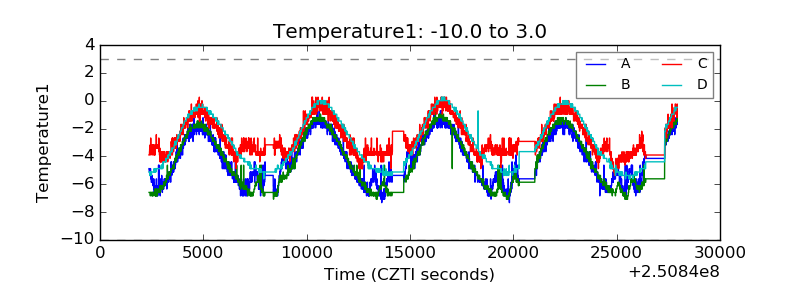 |
| Veto HV Monitor | 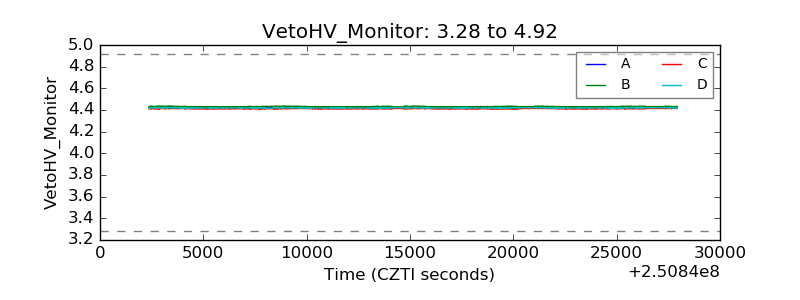 |
| Veto LLD | 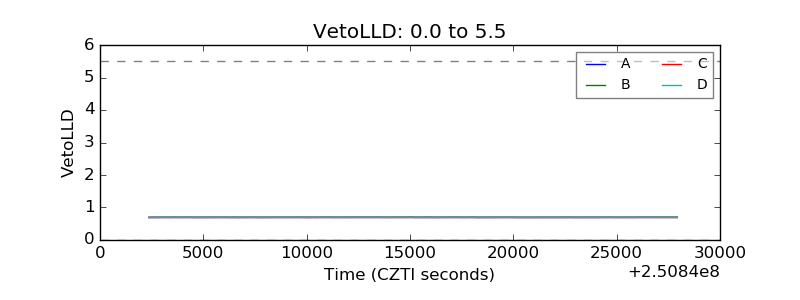 |
| Alpha Counter | 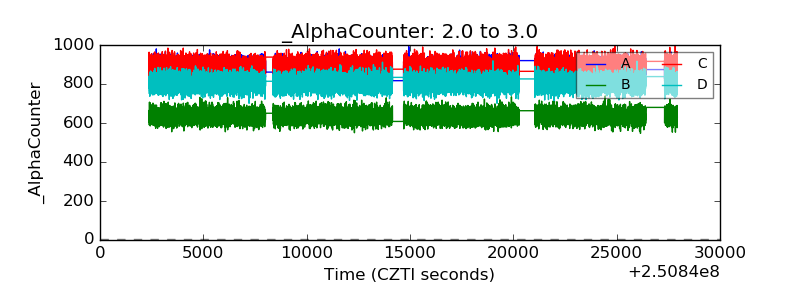 |
| _CPM_Rate | 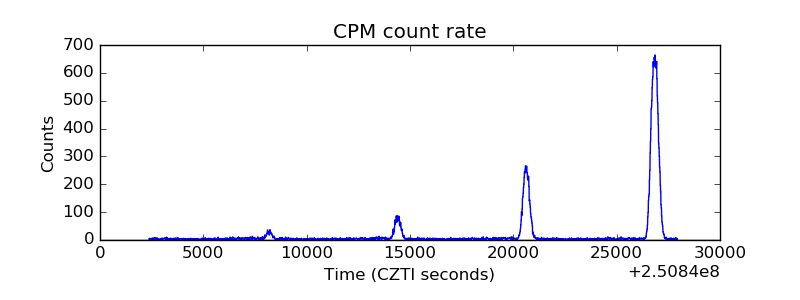 |
| CZT Counter | 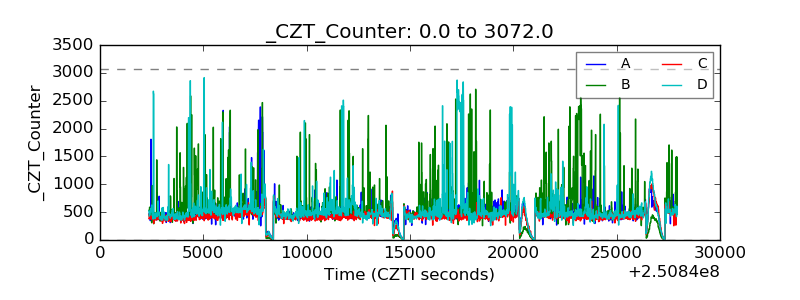 |
| +2.5 Volts monitor |  |
| +5 Volts monitor |  |
| _ROLL_ROT | 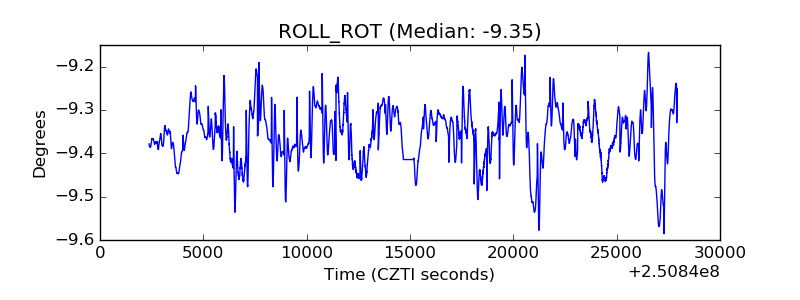 |
| _Roll_DEC | 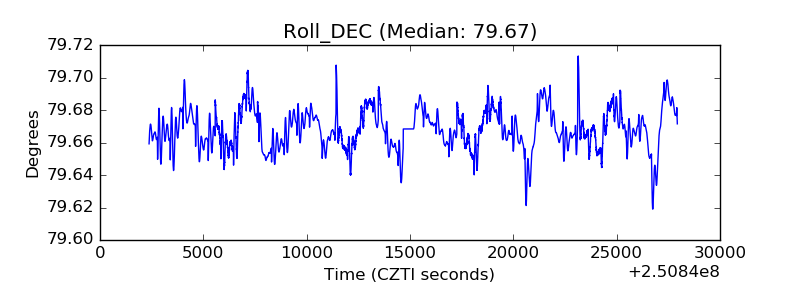 |
| _Roll_RA | 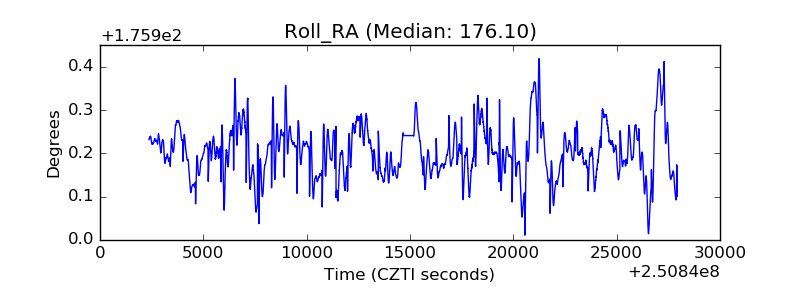 |
| Veto Counter | 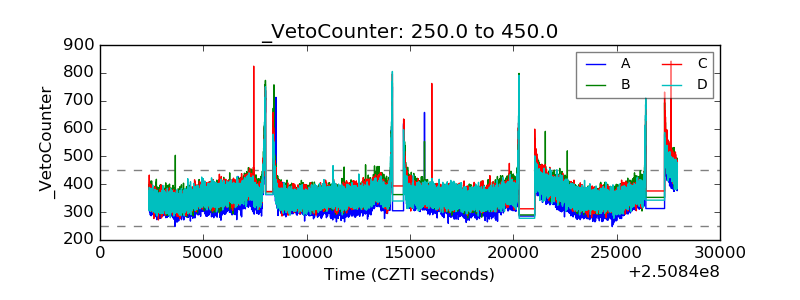 |