| Param | Original file | Final file |
|---|---|---|
| Filename | modeM0/AS1A04_124T01_9000001766_11953cztM0_level2.evt | modeM0/AS1A04_124T01_9000001766_11953cztM0_level2_quad_clean.evt |
| Size (bytes) | 466,954,560 | 118,186,560 |
| Size | 445.3 MB | 112.7 MB |
| Events in quadrant A | 3,241,861 | 802,524 |
| Events in quadrant B | 4,138,390 | 794,855 |
| Events in quadrant C | 2,811,934 | 798,822 |
| Events in quadrant D | 3,533,803 | 756,026 |
| Mode SS | |||
|---|---|---|---|
| Quadrant | BADHDUFLAG | Total packets | Discarded packets |
| A | 0 | 126 | 0 |
| B | 0 | 126 | 0 |
| C | 0 | 126 | 0 |
| D | 0 | 126 | 0 |
| Mode M9 | |||
|---|---|---|---|
| Quadrant | BADHDUFLAG | Total packets | Discarded packets |
| A | 0 | 11 | 0 |
| B | 0 | 11 | 0 |
| C | 0 | 11 | 0 |
| D | 0 | 11 | 0 |
| Mode M0 | |||
|---|---|---|---|
| Quadrant | BADHDUFLAG | Total packets | Discarded packets |
| A | 0 | 13810 | 2 |
| B | 0 | 16485 | 1 |
| C | 0 | 12628 | 1 |
| D | 0 | 14740 | 1 |
| Quadrant | Total seconds | Saturated seconds | Saturation percentage |
|---|---|---|---|
| A | 6113 | 90 | 1.472272% |
| B | 6113 | 411 | 6.723376% |
| C | 6113 | 54 | 0.883363% |
| D | 6113 | 173 | 2.830034% |
Noise dominated data is calculated using 1-second bins in cleaned event files. If a bin has >2000 counts, and if more than 50% of those come from <1% of pixels, then it is considered to be noise-dominated and hence unusable.
| Quadrant | # 1 sec bins | Bins with >0 counts | Bins with >2000 counts | High rate bins dominated by noise | Noise dominated (total time) | Noise dominated (detector-on time) | Marked lightcurve |
|---|---|---|---|---|---|---|---|
| A | 7254 | 6114 | 1 | 1 | 0.01% | 0.02% | 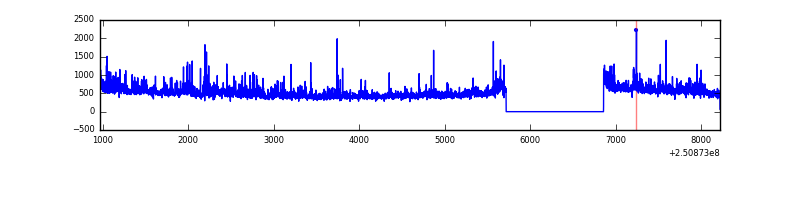 |
| B | 7254 | 6114 | 264 | 264 | 3.64% | 4.32% | 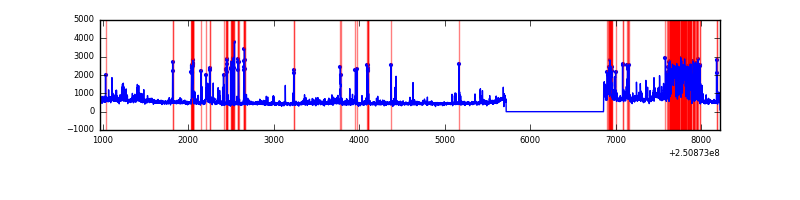 |
| C | 7254 | 6114 | 3 | 3 | 0.04% | 0.05% | 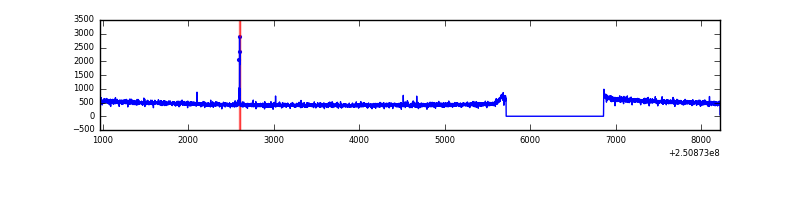 |
| D | 7254 | 6114 | 103 | 103 | 1.42% | 1.68% | 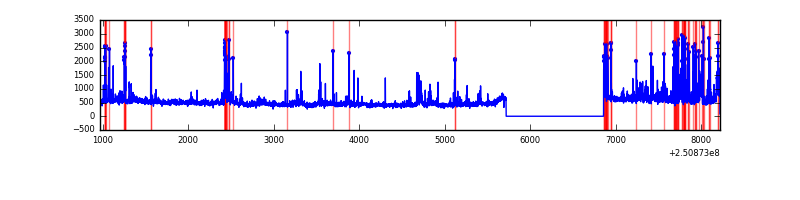 |
Top three noisy pixels from each quadrant. If the there are fewer than three noisy pixels in the level2.evt file, extra rows are filled as -1
| Pixel properties | Quadrant properties | ||||||
|---|---|---|---|---|---|---|---|
| Quadrant | DetID | PixID | Counts | Sigma | Mean | Median | Sigma |
| A | 1 | 162 | 127406 | 854.13 | 730 | 714 | 148.3 |
| A | 1 | 178 | 66678 | 444.71 | 730 | 714 | 148.3 |
| A | 1 | 161 | 58316 | 388.34 | 730 | 714 | 148.3 |
| B | 4 | 239 | 1019727 | 7684.4 | 715 | 699 | 132.6 |
| B | 15 | 204 | 169786 | 1275.07 | 715 | 699 | 132.6 |
| B | 0 | 219 | 45480 | 337.69 | 715 | 699 | 132.6 |
| C | 14 | 234 | 14562 | 83.86 | 717 | 720 | 165.1 |
| C | 13 | 61 | 5403 | 28.37 | 717 | 720 | 165.1 |
| C | 0 | 207 | 2409 | 10.23 | 717 | 720 | 165.1 |
| D | 1 | 52 | 332494 | 1953.48 | 708 | 688 | 169.9 |
| D | 8 | 195 | 171401 | 1005.06 | 708 | 688 | 169.9 |
| D | 10 | 50 | 73208 | 426.95 | 708 | 688 | 169.9 |
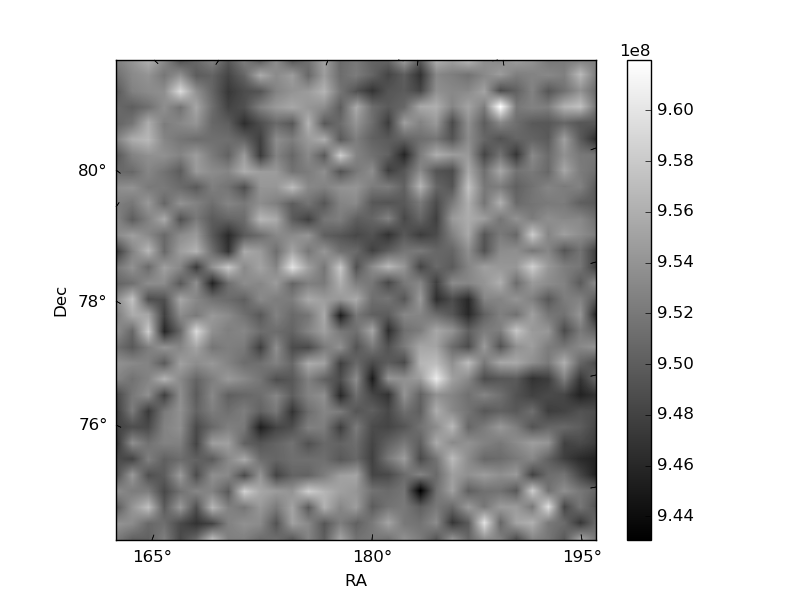
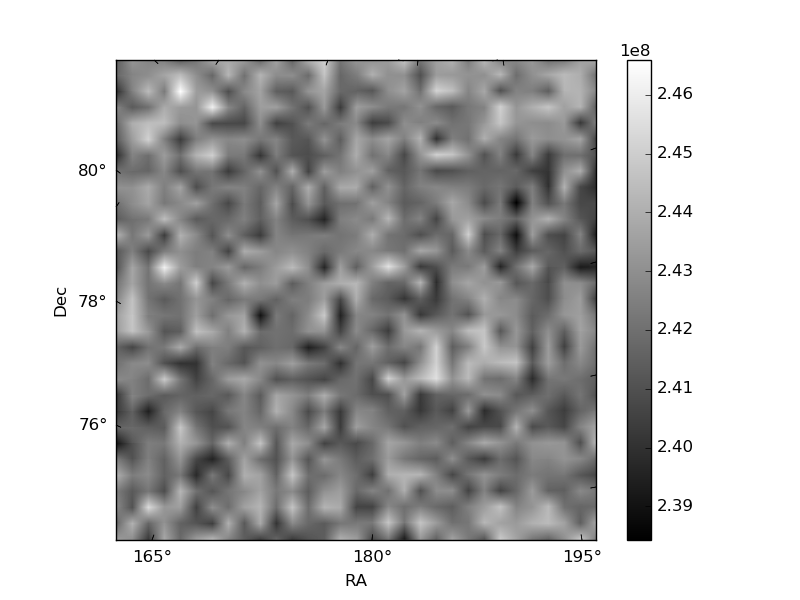
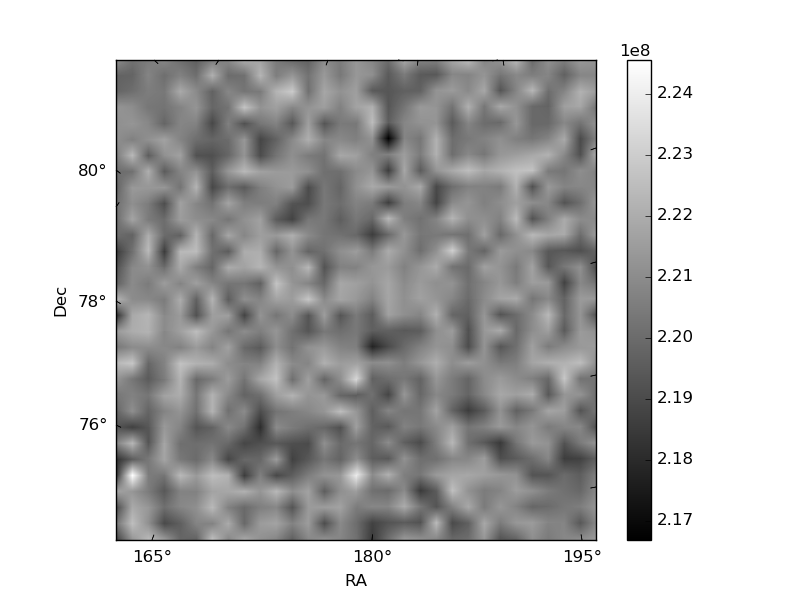
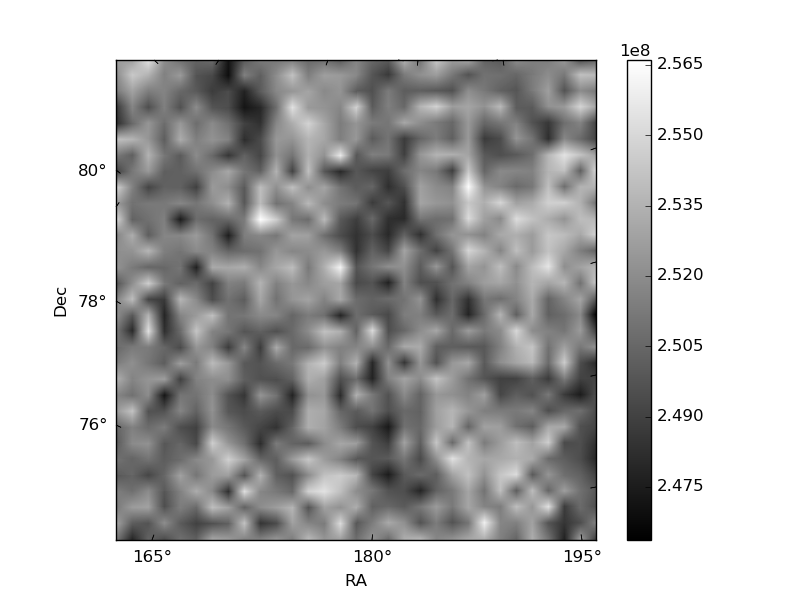
Histogram calculated using DETX and DETY for each event in the final _common_clean file
| Quadrant A | 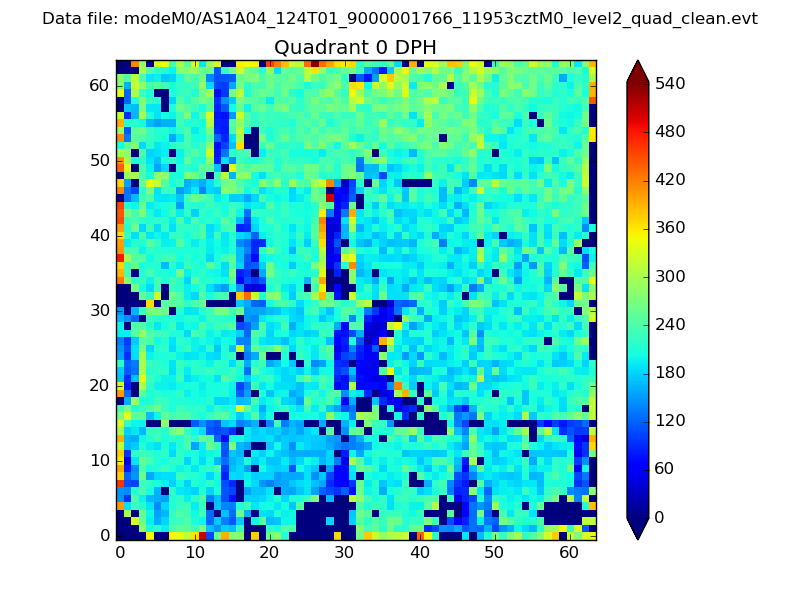 |
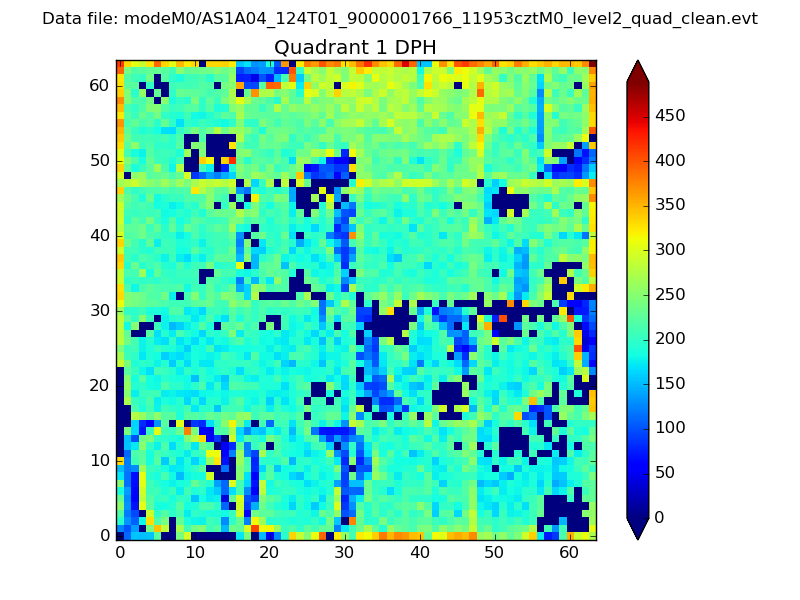 |
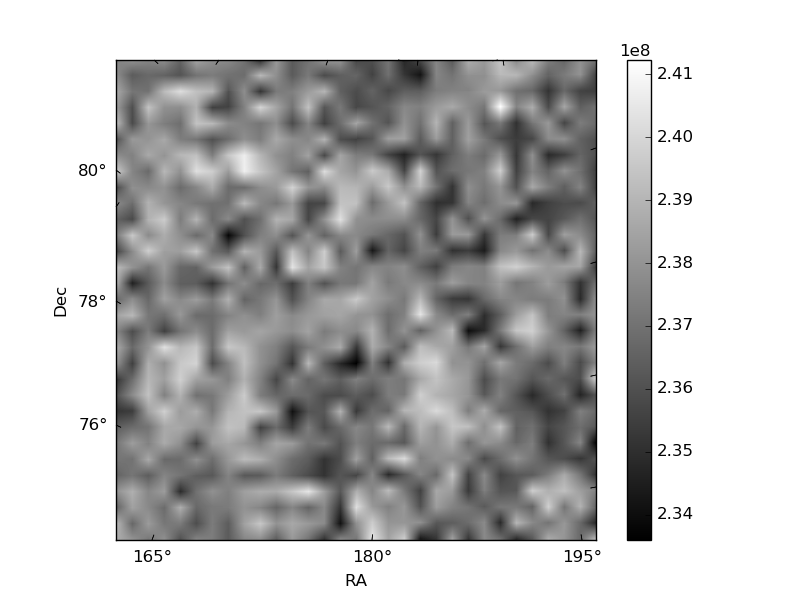
Quadrant B |
|---|---|---|---|
| Quadrant D | 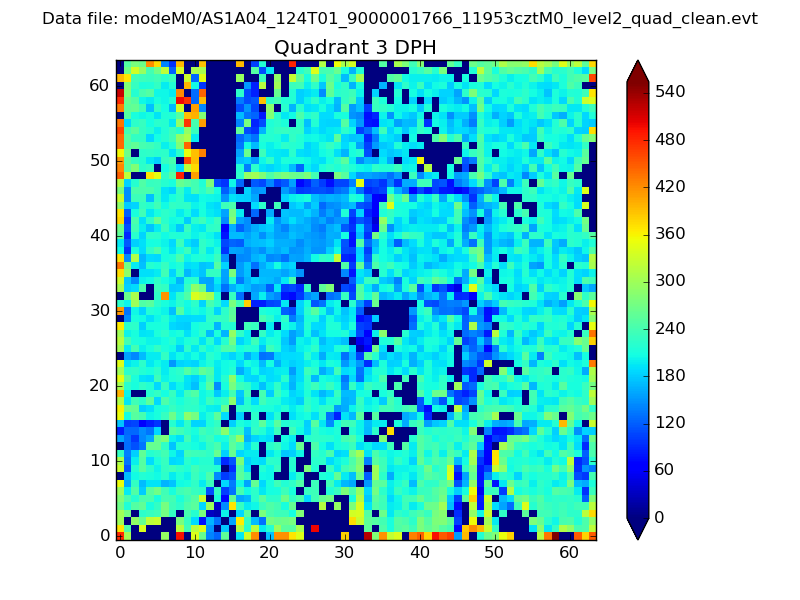 |
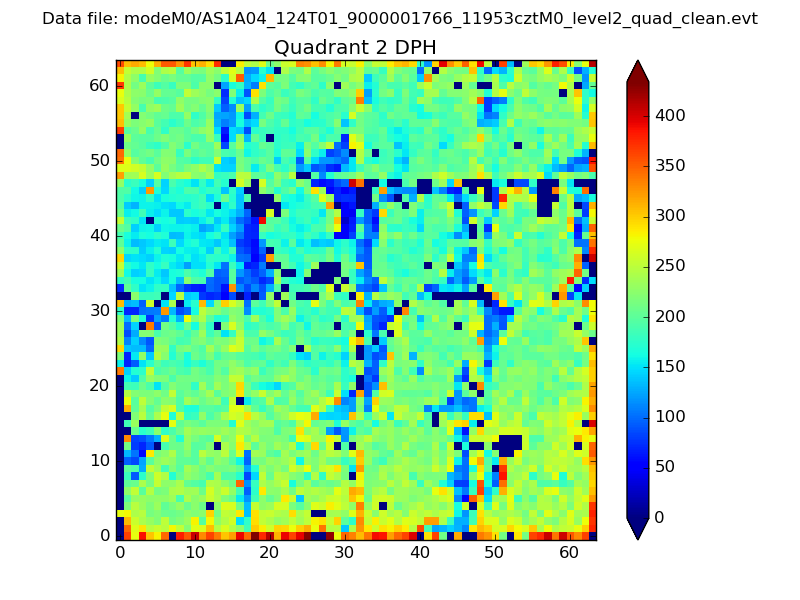 |
Quadrant C |
| Plot type | Count rate plots | Images |
|---|---|---|
| Comparison with Poisson distribution Blue bars denote a histogram of data divided into 1 sec bins. Red curve is a Poisson curve with rate = median count rate of data. |
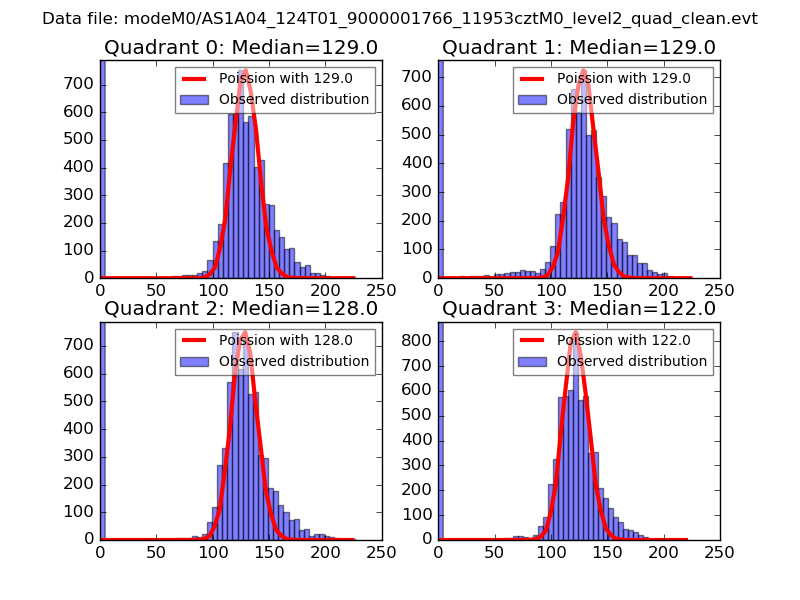 |
 |
| Quadrant-wise count rates Data is divided into 100 sec bins |
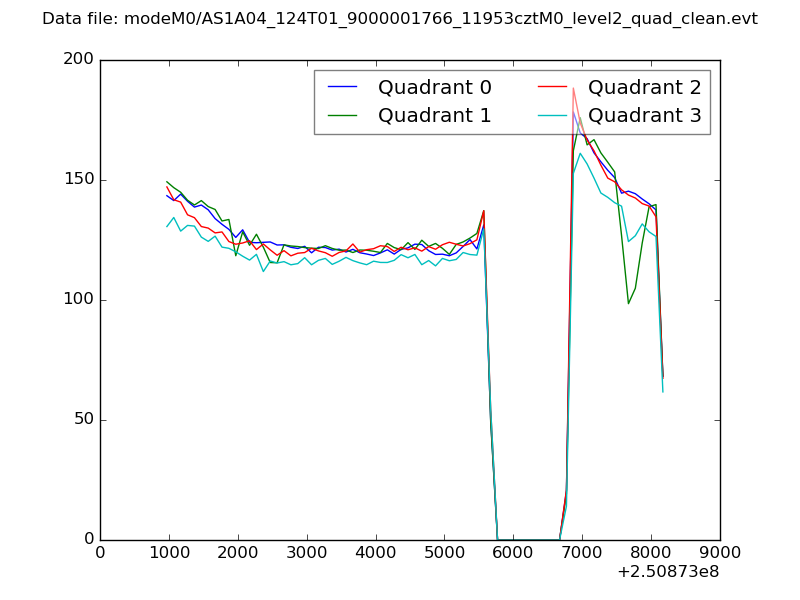 |
|
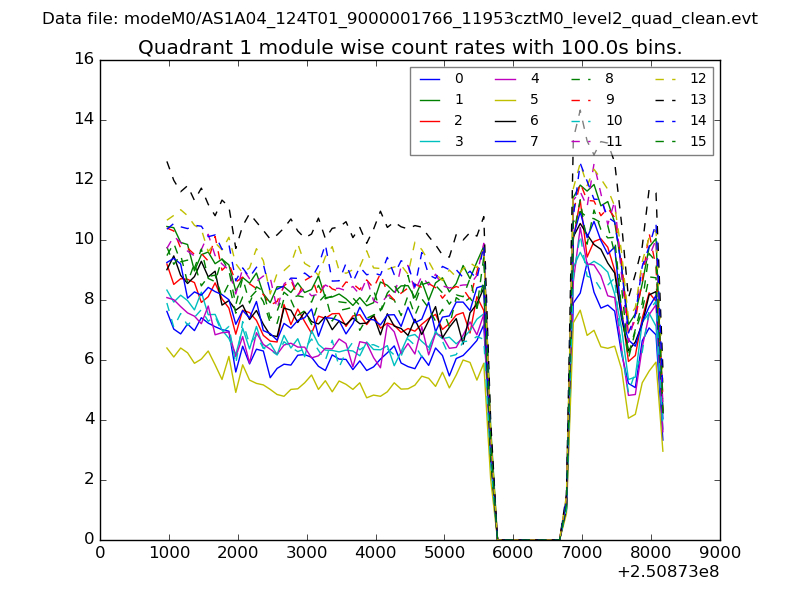
| Module-wise count rates for Quadrant A Data is divided into 100 sec bins |
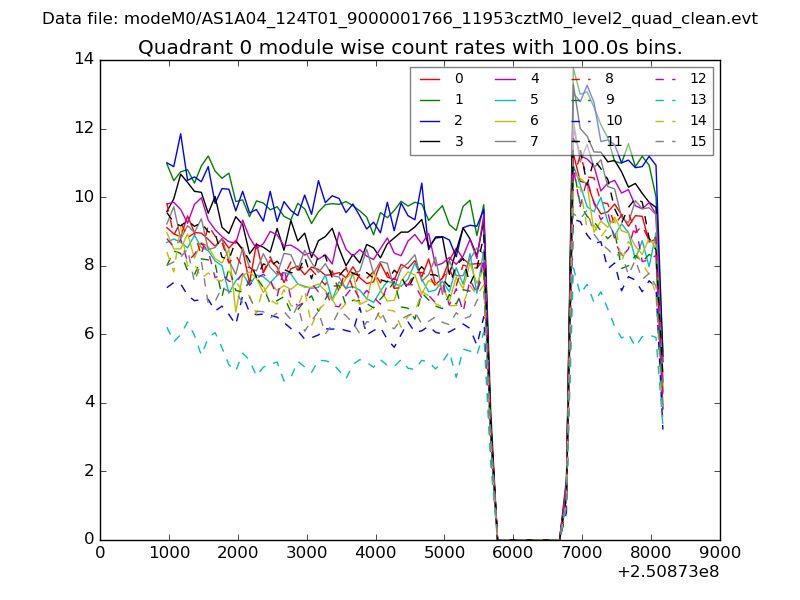 |
 |
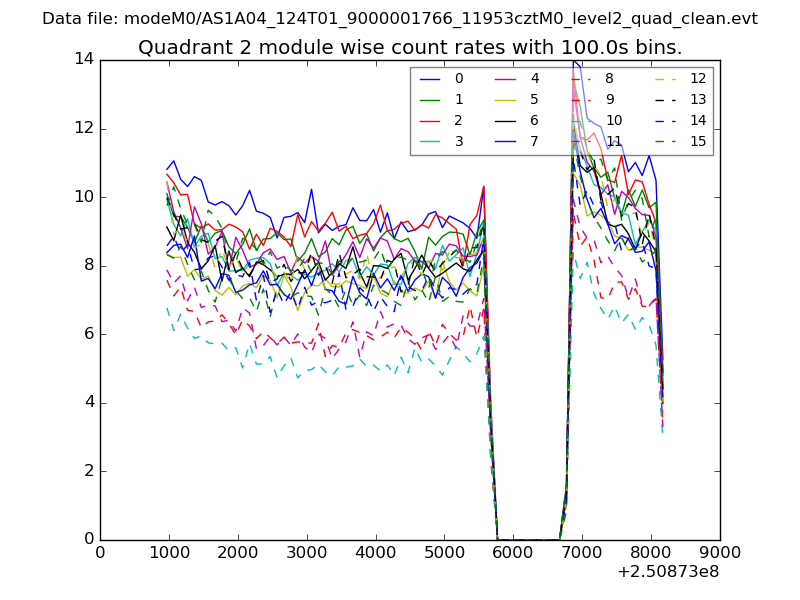
| Module-wise count rates for Quadrant B Data is divided into 100 sec bins |
 |
 |
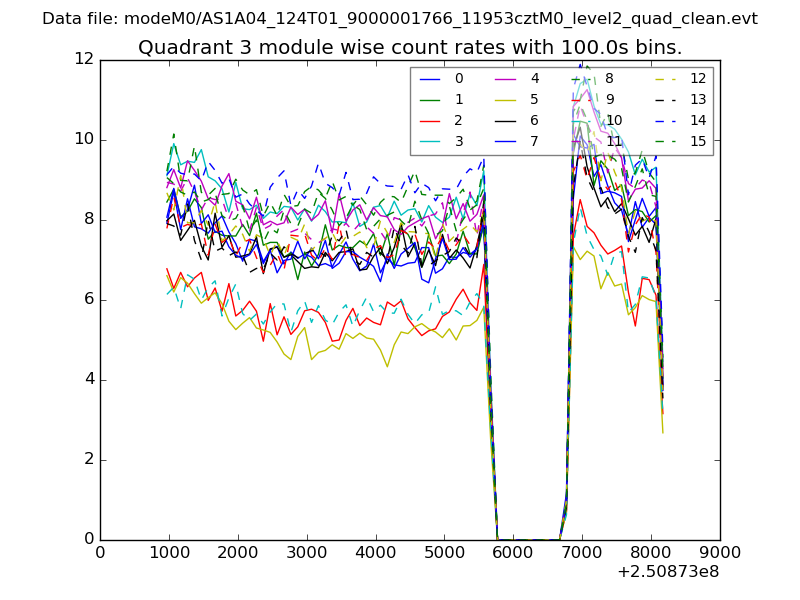
| Module-wise count rates for Quadrant C Data is divided into 100 sec bins |
 |
 |
| Module-wise count rates for Quadrant D Data is divided into 100 sec bins |
 |
 |
| Parameter | Plot |
|---|---|
| CZT HV Monitor | 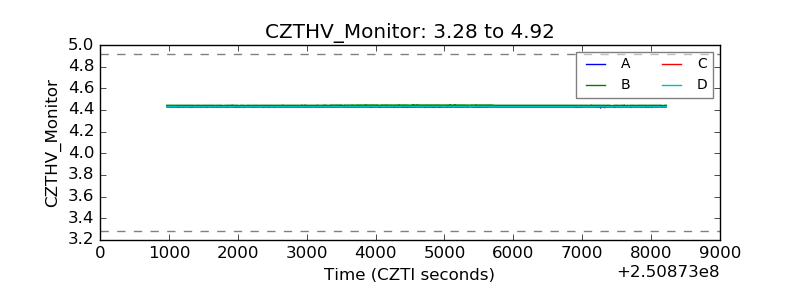 |
| D_VDD | 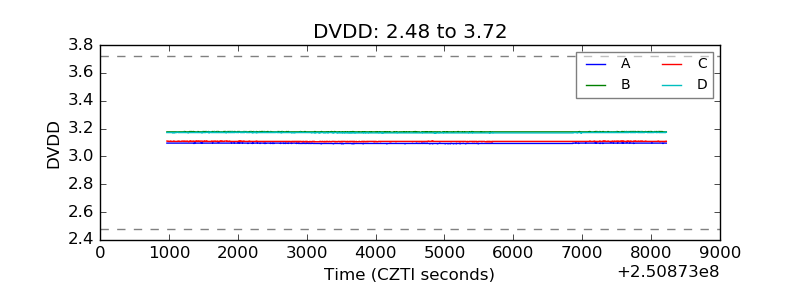 |
| Temperature 1 |  |
| Veto HV Monitor | 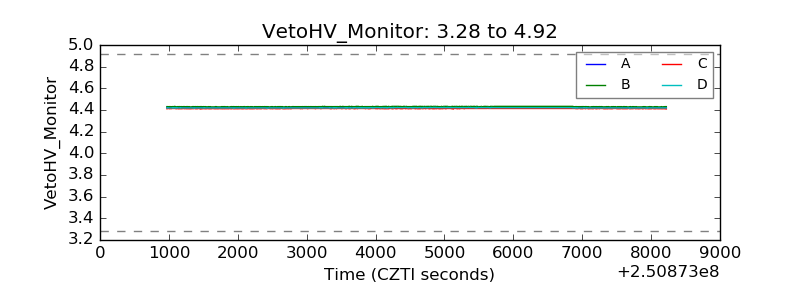 |
| Veto LLD | 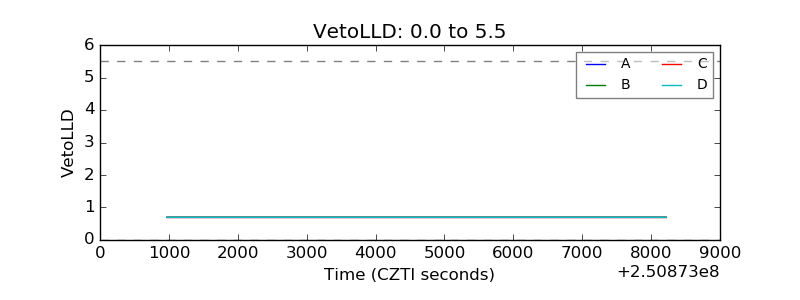 |
| Alpha Counter | 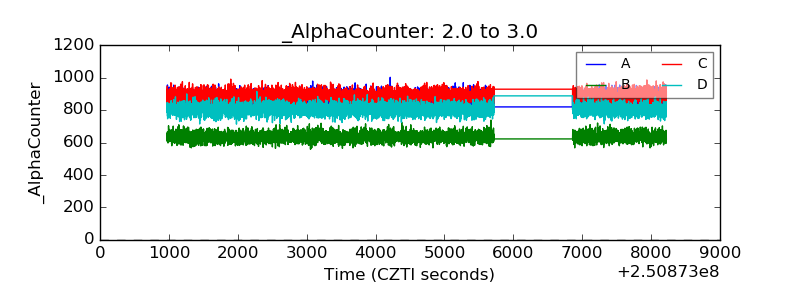 |
| _CPM_Rate | 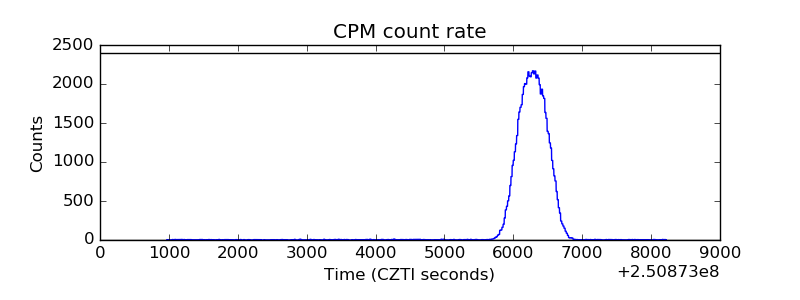 |
| CZT Counter | 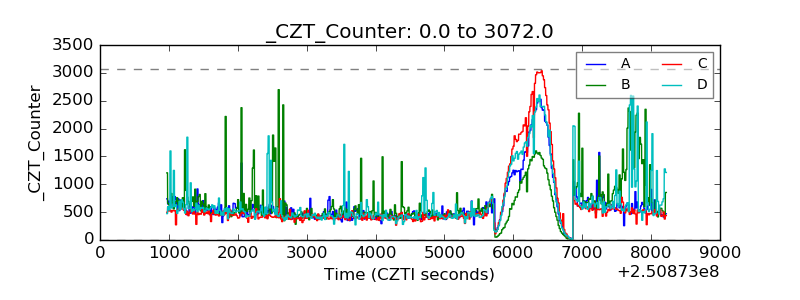 |
| +2.5 Volts monitor | 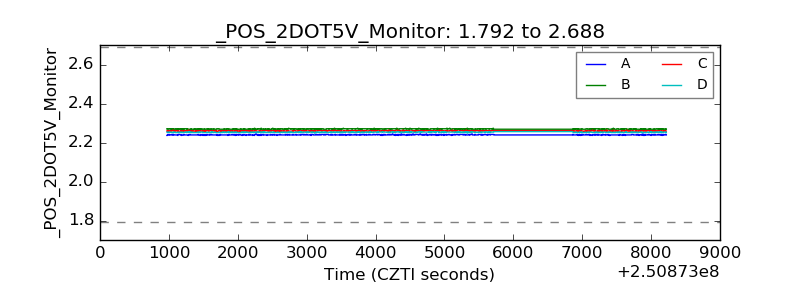 |
| +5 Volts monitor |  |
| _ROLL_ROT | 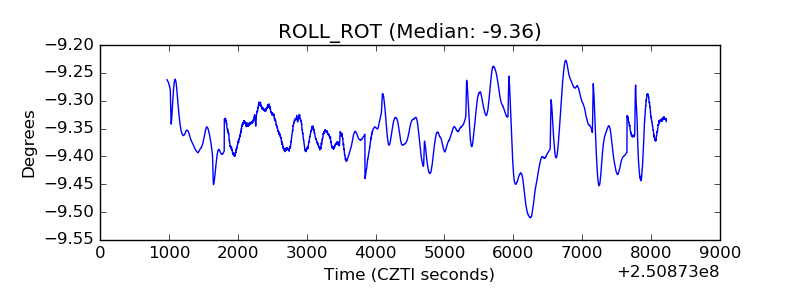 |
| _Roll_DEC | 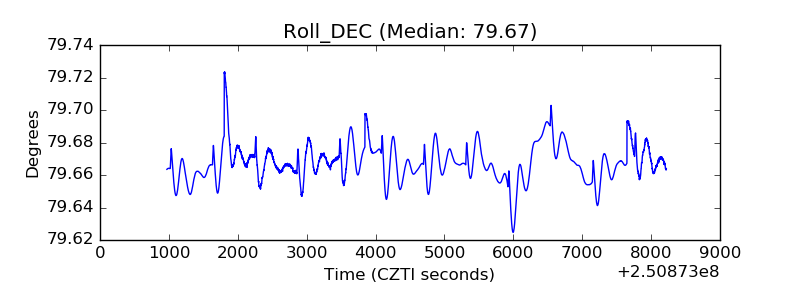 |
| _Roll_RA | 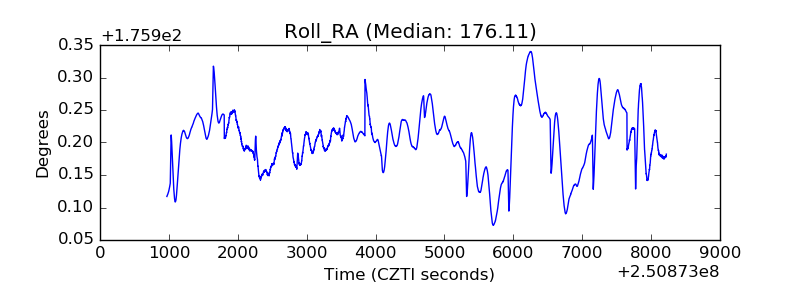 |
| Veto Counter | 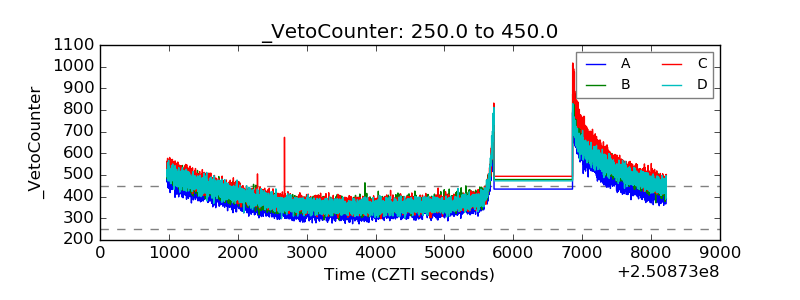 |