| Param | Original file | Final file |
|---|---|---|
| Filename | modeM0/AS1A04_124T01_9000001766_11954cztM0_level2.evt | modeM0/AS1A04_124T01_9000001766_11954cztM0_level2_quad_clean.evt |
| Size (bytes) | 534,064,320 | 127,615,680 |
| Size | 509.3 MB | 121.7 MB |
| Events in quadrant A | 3,386,769 | 871,578 |
| Events in quadrant B | 4,503,066 | 865,208 |
| Events in quadrant C | 3,013,587 | 879,224 |
| Events in quadrant D | 4,841,400 | 807,245 |
| Mode SS | |||
|---|---|---|---|
| Quadrant | BADHDUFLAG | Total packets | Discarded packets |
| A | 0 | 128 | 0 |
| B | 0 | 128 | 0 |
| C | 0 | 128 | 0 |
| D | 0 | 128 | 0 |
| Mode M9 | |||
|---|---|---|---|
| Quadrant | BADHDUFLAG | Total packets | Discarded packets |
| A | 0 | 16 | 0 |
| B | 0 | 16 | 0 |
| C | 0 | 16 | 0 |
| D | 0 | 17 | 0 |
| Mode M0 | |||
|---|---|---|---|
| Quadrant | BADHDUFLAG | Total packets | Discarded packets |
| A | 0 | 14413 | 3 |
| B | 0 | 17859 | 2 |
| C | 0 | 13332 | 2 |
| D | 0 | 18948 | 2 |
| Quadrant | Total seconds | Saturated seconds | Saturation percentage |
|---|---|---|---|
| A | 6332 | 92 | 1.452937% |
| B | 6332 | 463 | 7.312066% |
| C | 6332 | 32 | 0.505370% |
| D | 6332 | 512 | 8.085913% |
Noise dominated data is calculated using 1-second bins in cleaned event files. If a bin has >2000 counts, and if more than 50% of those come from <1% of pixels, then it is considered to be noise-dominated and hence unusable.
| Quadrant | # 1 sec bins | Bins with >0 counts | Bins with >2000 counts | High rate bins dominated by noise | Noise dominated (total time) | Noise dominated (detector-on time) | Marked lightcurve |
|---|---|---|---|---|---|---|---|
| A | 7588 | 6333 | 6 | 6 | 0.08% | 0.09% | 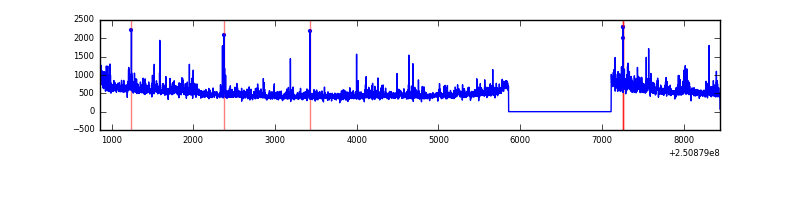 |
| B | 7588 | 6333 | 296 | 296 | 3.90% | 4.67% | 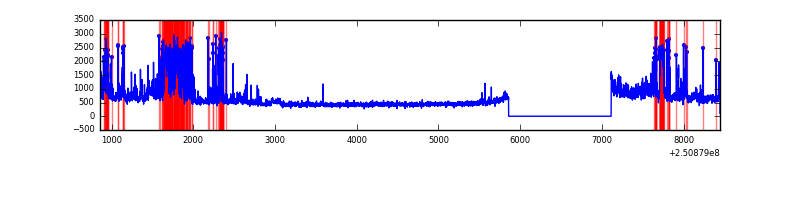 |
| C | 7588 | 6333 | 0 | 0 | 0.00% | 0.00% | 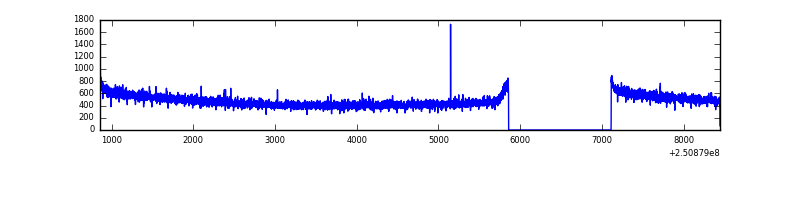 |
| D | 7587 | 6332 | 447 | 447 | 5.89% | 7.06% | 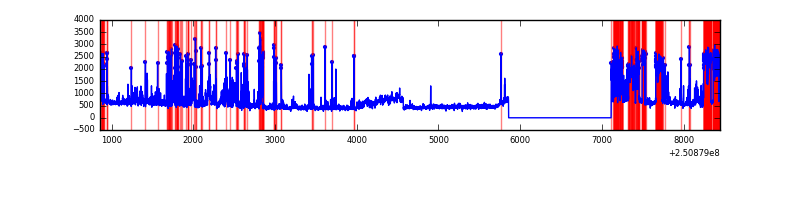 |
Top three noisy pixels from each quadrant. If the there are fewer than three noisy pixels in the level2.evt file, extra rows are filled as -1
| Pixel properties | Quadrant properties | ||||||
|---|---|---|---|---|---|---|---|
| Quadrant | DetID | PixID | Counts | Sigma | Mean | Median | Sigma |
| A | 1 | 162 | 119935 | 763.91 | 777 | 761 | 156.0 |
| A | 1 | 178 | 63104 | 399.62 | 777 | 761 | 156.0 |
| A | 1 | 161 | 55554 | 351.22 | 777 | 761 | 156.0 |
| B | 4 | 239 | 1010359 | 7191.91 | 764 | 745 | 140.4 |
| B | 15 | 204 | 374197 | 2660.26 | 764 | 745 | 140.4 |
| B | 0 | 218 | 49714 | 348.83 | 764 | 745 | 140.4 |
| C | 13 | 61 | 5870 | 28.89 | 771 | 776 | 176.3 |
| C | 14 | 234 | 4599 | 21.68 | 771 | 776 | 176.3 |
| C | 0 | 207 | 2419 | 9.32 | 771 | 776 | 176.3 |
| D | 13 | 122 | 816227 | 4617.24 | 745 | 724 | 176.6 |
| D | 1 | 52 | 697947 | 3947.56 | 745 | 724 | 176.6 |
| D | 8 | 195 | 120323 | 677.15 | 745 | 724 | 176.6 |
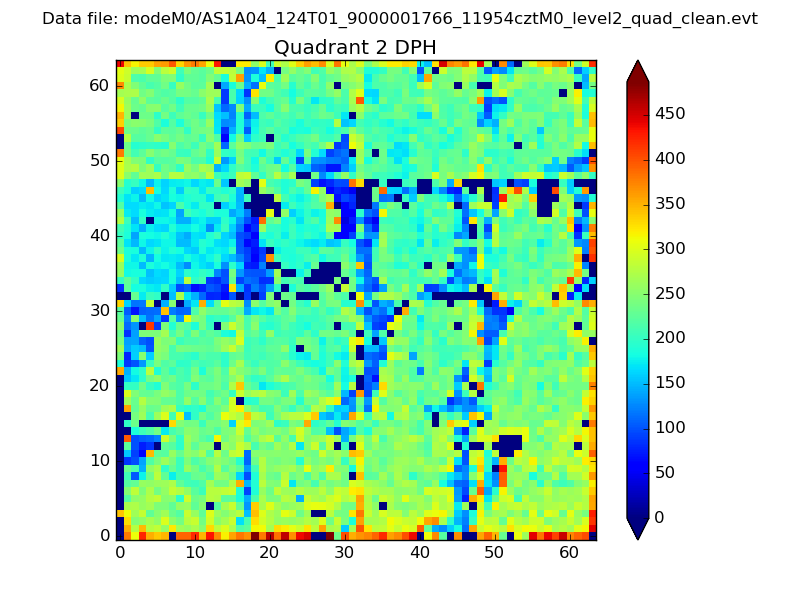
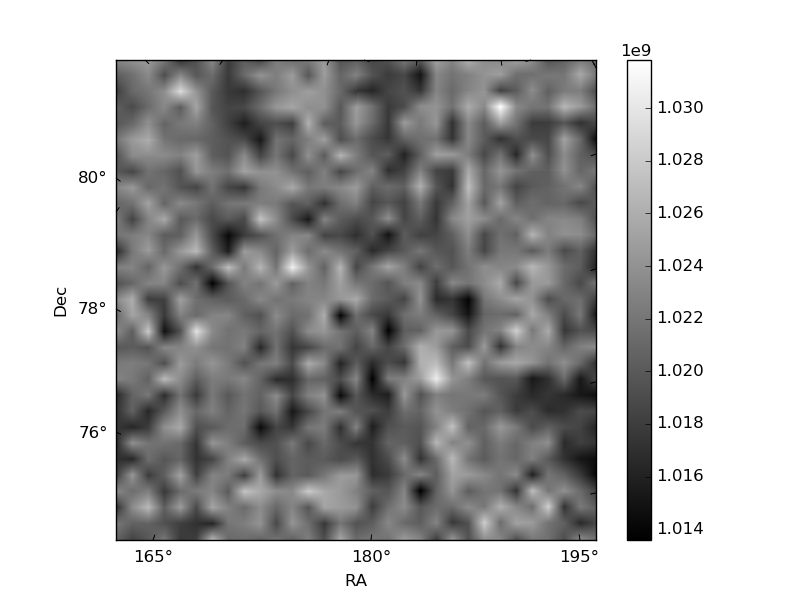
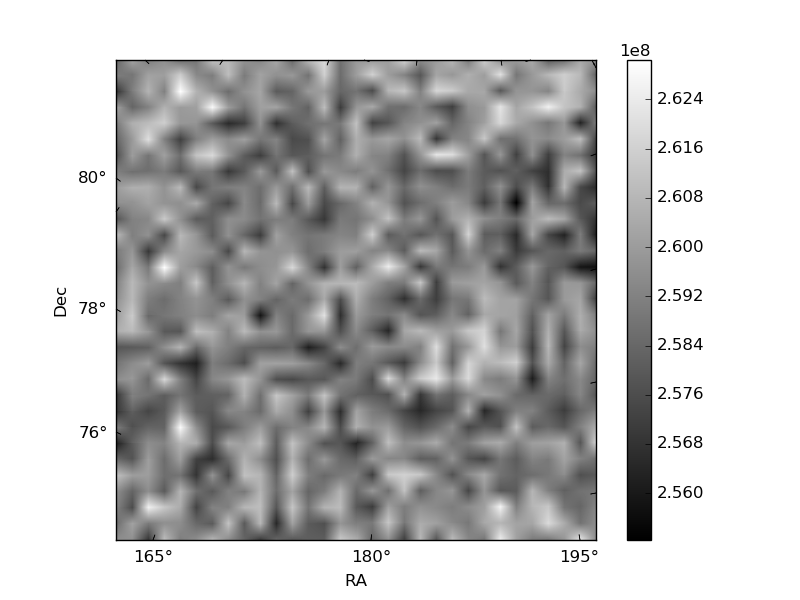
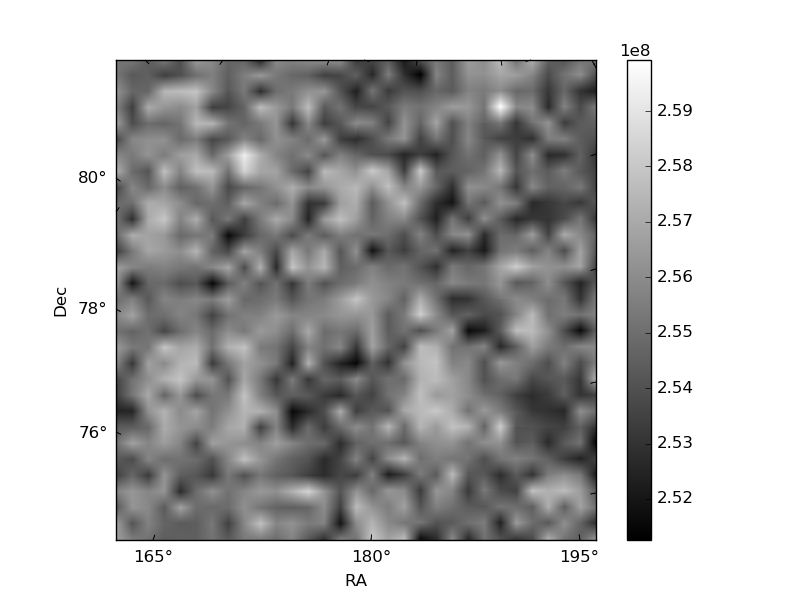
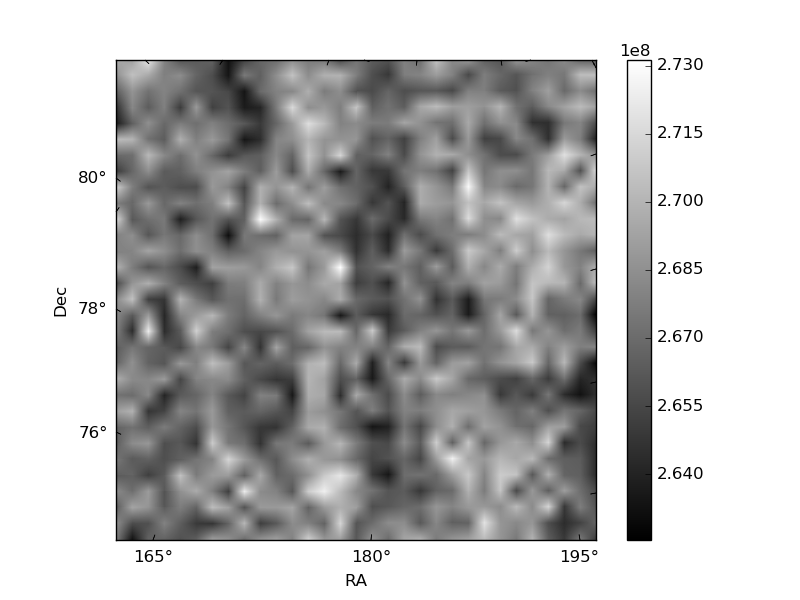
Histogram calculated using DETX and DETY for each event in the final _common_clean file
| Quadrant A | 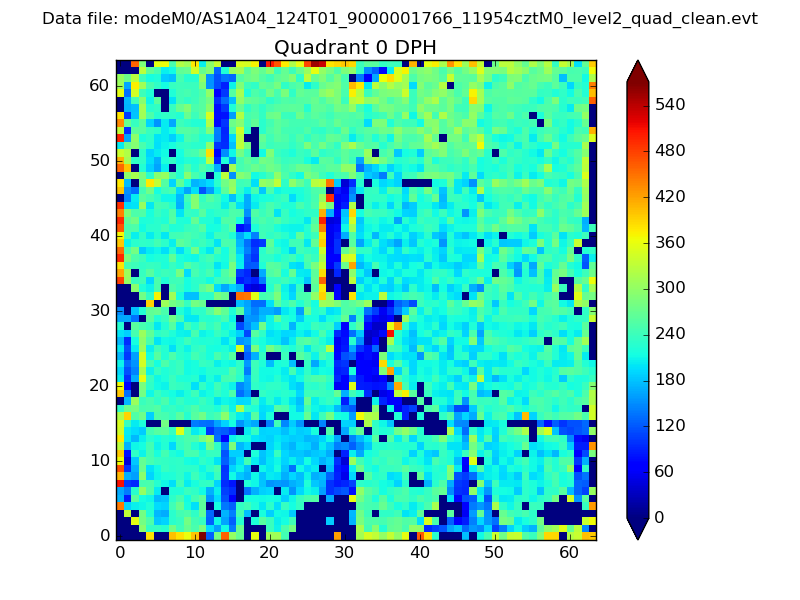 |
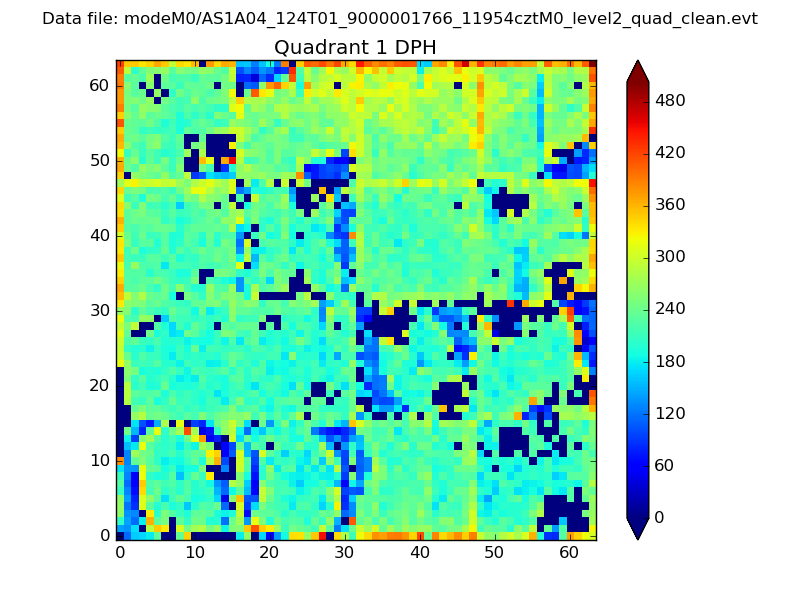 |
Quadrant B |
|---|---|---|---|
| Quadrant D | 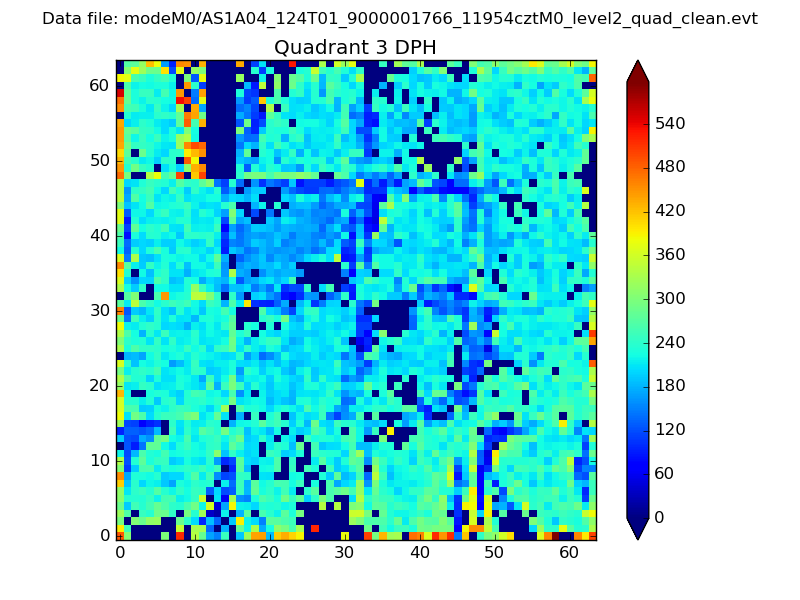 |
 |
Quadrant C |
| Plot type | Count rate plots | Images |
|---|---|---|
| Comparison with Poisson distribution Blue bars denote a histogram of data divided into 1 sec bins. Red curve is a Poisson curve with rate = median count rate of data. |
 |
 |
| Quadrant-wise count rates Data is divided into 100 sec bins |
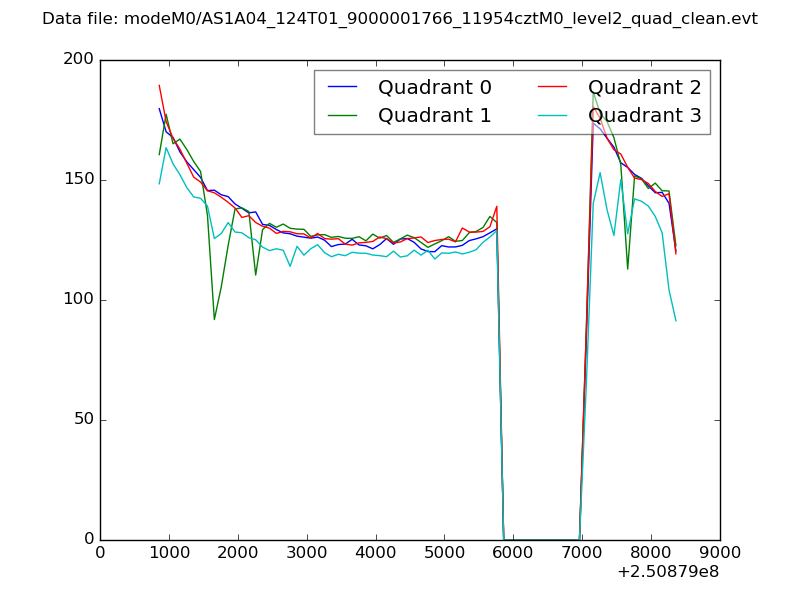 |
|
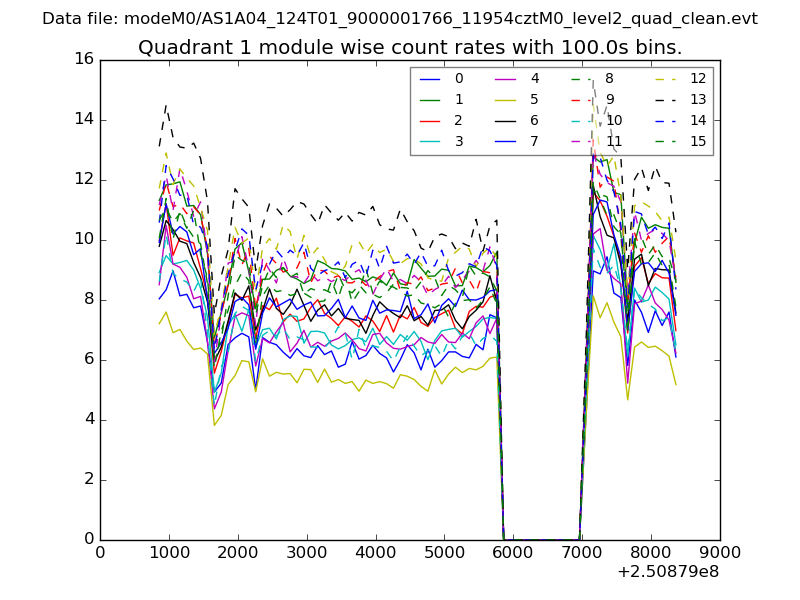
| Module-wise count rates for Quadrant A Data is divided into 100 sec bins |
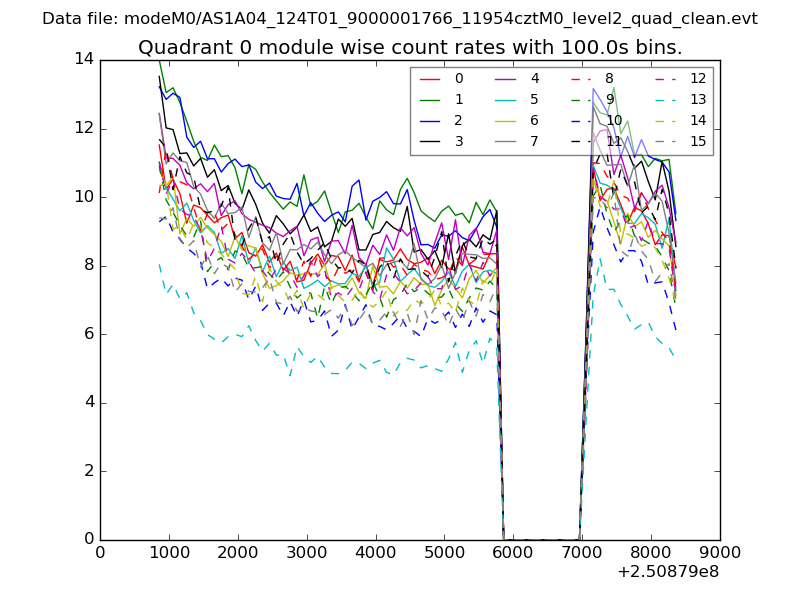 |
 |
| Module-wise count rates for Quadrant B Data is divided into 100 sec bins |
 |
 |
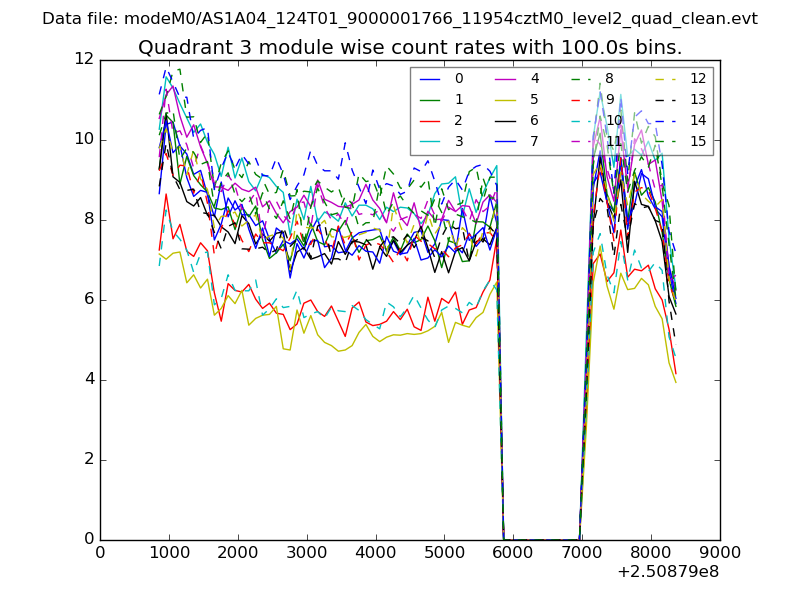
| Module-wise count rates for Quadrant C Data is divided into 100 sec bins |
 |
 |
| Module-wise count rates for Quadrant D Data is divided into 100 sec bins |
 |
 |
| Parameter | Plot |
|---|---|
| CZT HV Monitor | 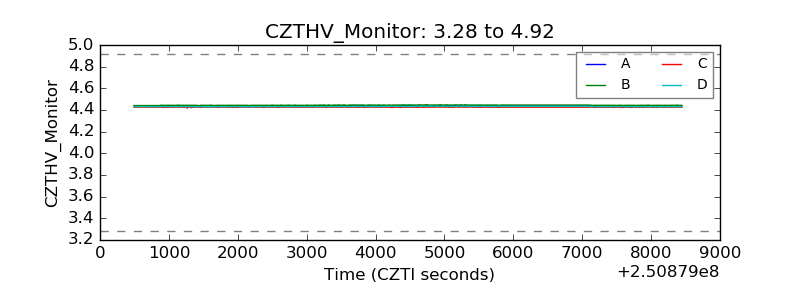 |
| D_VDD | 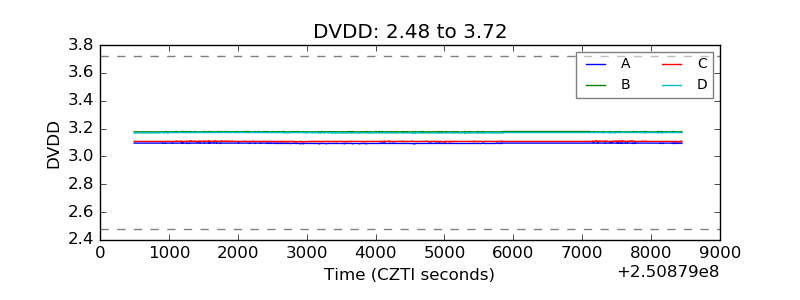 |
| Temperature 1 | 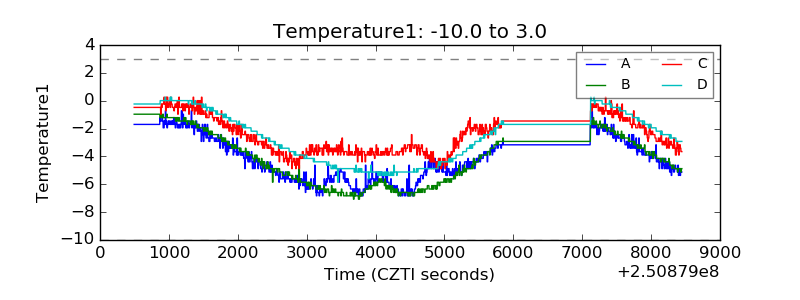 |
| Veto HV Monitor | 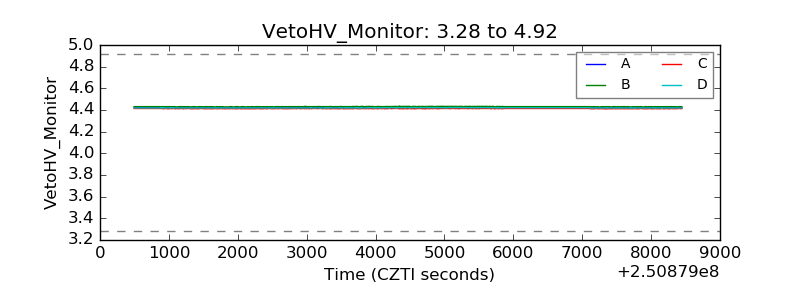 |
| Veto LLD | 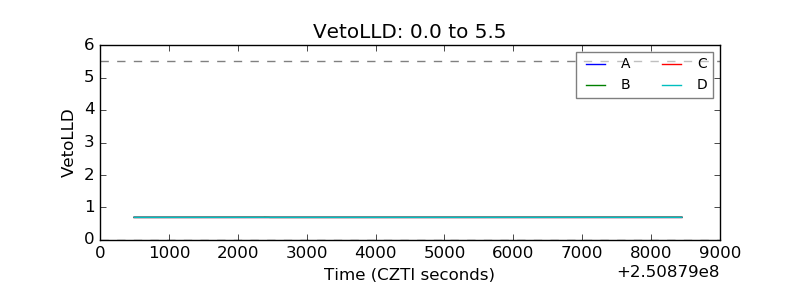 |
| Alpha Counter | 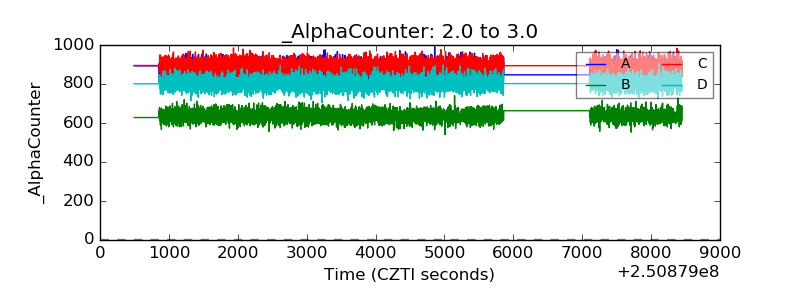 |
| _CPM_Rate | 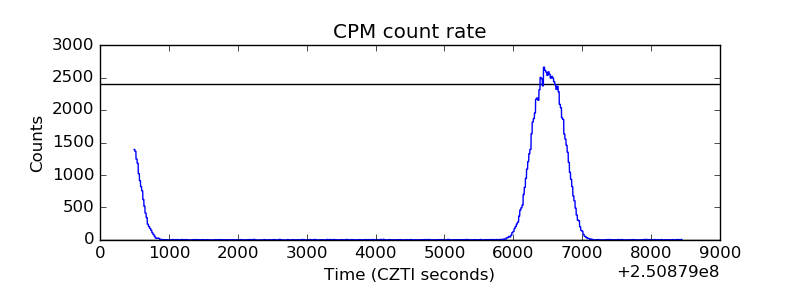 |
| CZT Counter | 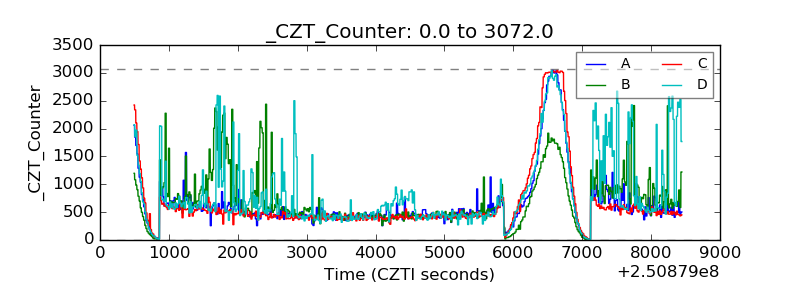 |
| +2.5 Volts monitor |  |
| +5 Volts monitor |  |
| _ROLL_ROT |  |
| _Roll_DEC | 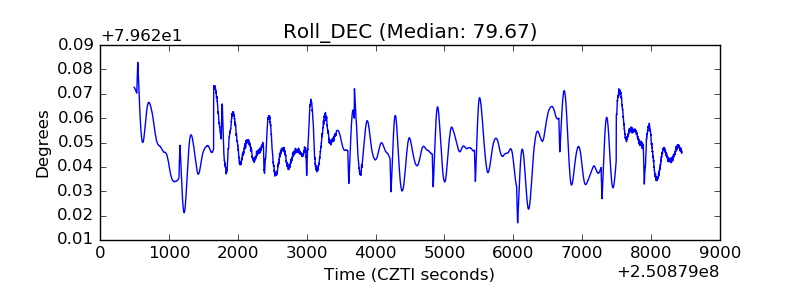 |
| _Roll_RA | 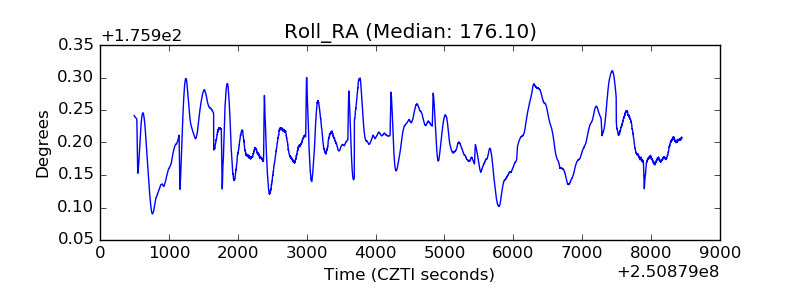 |
| Veto Counter |  |