| Param | Original file | Final file |
|---|---|---|
| Filename | modeM0/AS1A04_124T01_9000001766_11955cztM0_level2.evt | modeM0/AS1A04_124T01_9000001766_11955cztM0_level2_quad_clean.evt |
| Size (bytes) | 519,465,600 | 125,758,080 |
| Size | 495.4 MB | 119.9 MB |
| Events in quadrant A | 3,359,785 | 855,692 |
| Events in quadrant B | 4,087,485 | 863,482 |
| Events in quadrant C | 2,959,751 | 869,751 |
| Events in quadrant D | 4,904,200 | 786,749 |
| Mode SS | |||
|---|---|---|---|
| Quadrant | BADHDUFLAG | Total packets | Discarded packets |
| A | 0 | 126 | 0 |
| B | 0 | 126 | 0 |
| C | 0 | 126 | 0 |
| D | 0 | 126 | 0 |
| Mode M9 | |||
|---|---|---|---|
| Quadrant | BADHDUFLAG | Total packets | Discarded packets |
| A | 0 | 17 | 0 |
| B | 0 | 17 | 0 |
| C | 0 | 17 | 0 |
| D | 0 | 18 | 0 |
| Mode M0 | |||
|---|---|---|---|
| Quadrant | BADHDUFLAG | Total packets | Discarded packets |
| A | 0 | 14139 | 3 |
| B | 0 | 16327 | 2 |
| C | 0 | 13084 | 2 |
| D | 0 | 18873 | 2 |
| Quadrant | Total seconds | Saturated seconds | Saturation percentage |
|---|---|---|---|
| A | 6203 | 102 | 1.644366% |
| B | 6203 | 319 | 5.142673% |
| C | 6203 | 65 | 1.047880% |
| D | 6203 | 697 | 11.236498% |
Noise dominated data is calculated using 1-second bins in cleaned event files. If a bin has >2000 counts, and if more than 50% of those come from <1% of pixels, then it is considered to be noise-dominated and hence unusable.
| Quadrant | # 1 sec bins | Bins with >0 counts | Bins with >2000 counts | High rate bins dominated by noise | Noise dominated (total time) | Noise dominated (detector-on time) | Marked lightcurve |
|---|---|---|---|---|---|---|---|
| A | 7484 | 6204 | 3 | 3 | 0.04% | 0.05% | 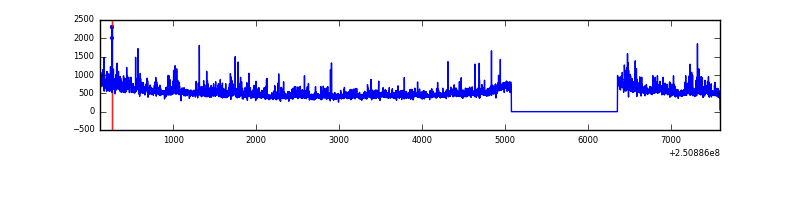 |
| B | 7484 | 6204 | 178 | 178 | 2.38% | 2.87% | 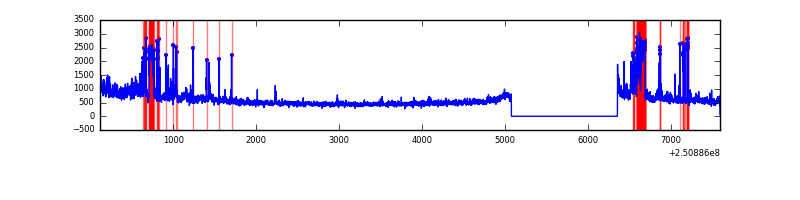 |
| C | 7484 | 6204 | 0 | 0 | 0.00% | 0.00% | 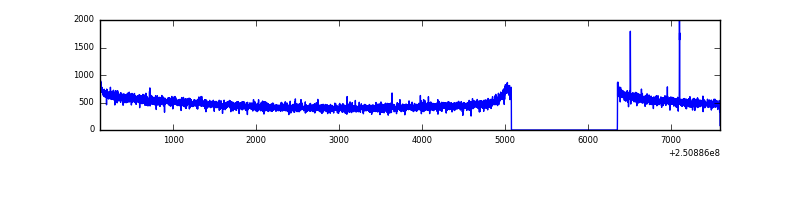 |
| D | 7484 | 6204 | 604 | 604 | 8.07% | 9.74% | 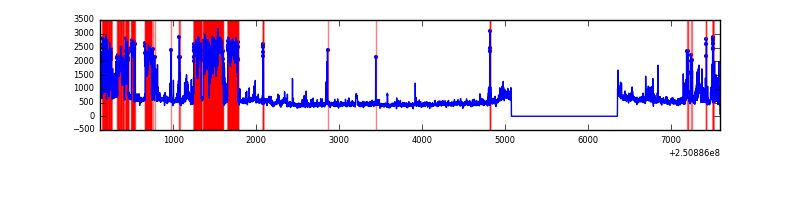 |
Top three noisy pixels from each quadrant. If the there are fewer than three noisy pixels in the level2.evt file, extra rows are filled as -1
| Pixel properties | Quadrant properties | ||||||
|---|---|---|---|---|---|---|---|
| Quadrant | DetID | PixID | Counts | Sigma | Mean | Median | Sigma |
| A | 1 | 162 | 118136 | 770.37 | 758 | 742 | 152.4 |
| A | 6 | 254 | 95392 | 621.12 | 758 | 742 | 152.4 |
| A | 1 | 178 | 61056 | 395.79 | 758 | 742 | 152.4 |
| B | 4 | 239 | 520030 | 3703.89 | 757 | 739 | 140.2 |
| B | 15 | 204 | 488921 | 3482.0 | 757 | 739 | 140.2 |
| B | 0 | 218 | 42785 | 299.9 | 757 | 739 | 140.2 |
| C | 14 | 234 | 7143 | 36.85 | 756 | 760 | 173.2 |
| C | 13 | 61 | 5678 | 28.39 | 756 | 760 | 173.2 |
| C | 0 | 207 | 4853 | 23.63 | 756 | 760 | 173.2 |
| D | 13 | 122 | 1522980 | 8866.89 | 724 | 703 | 171.7 |
| D | 1 | 52 | 173072 | 1004.01 | 724 | 703 | 171.7 |
| D | 8 | 195 | 98412 | 569.13 | 724 | 703 | 171.7 |
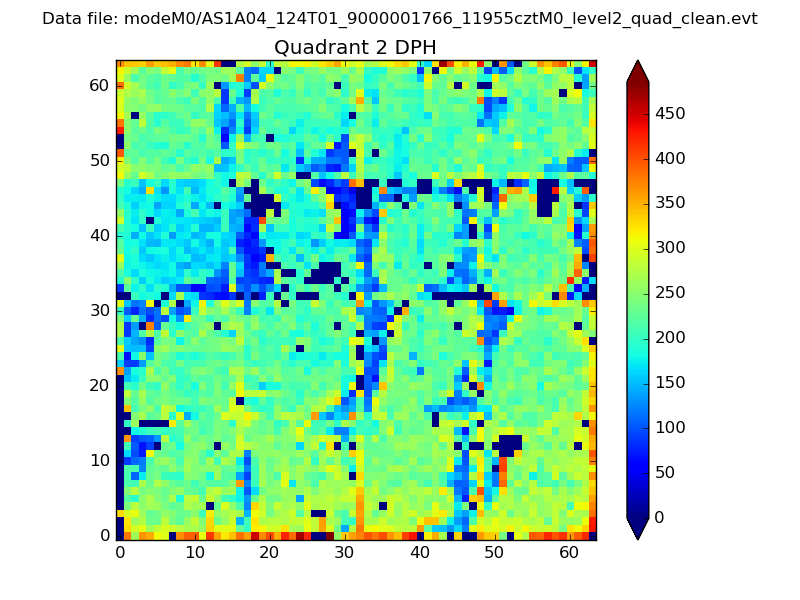
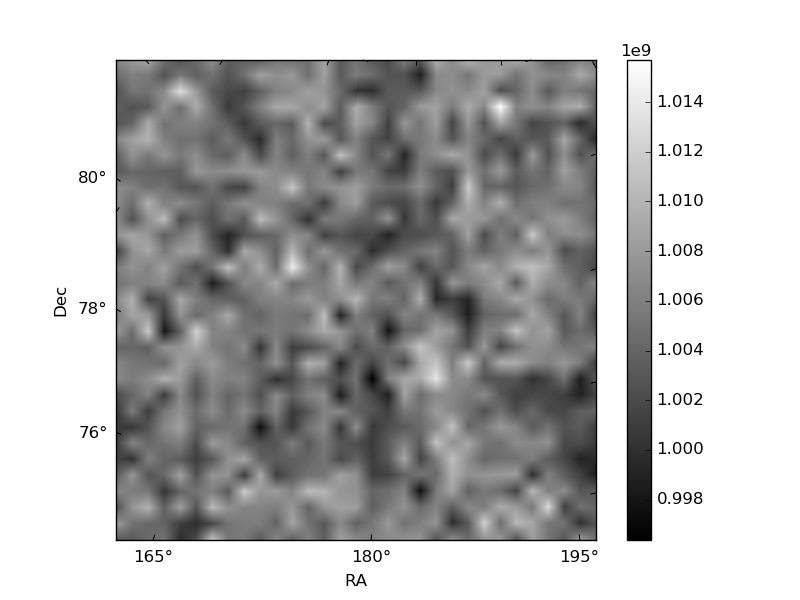
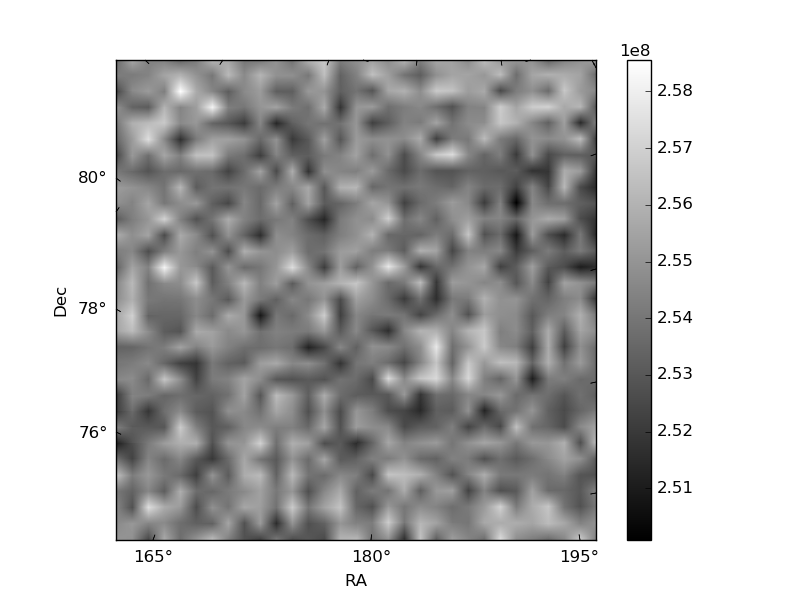
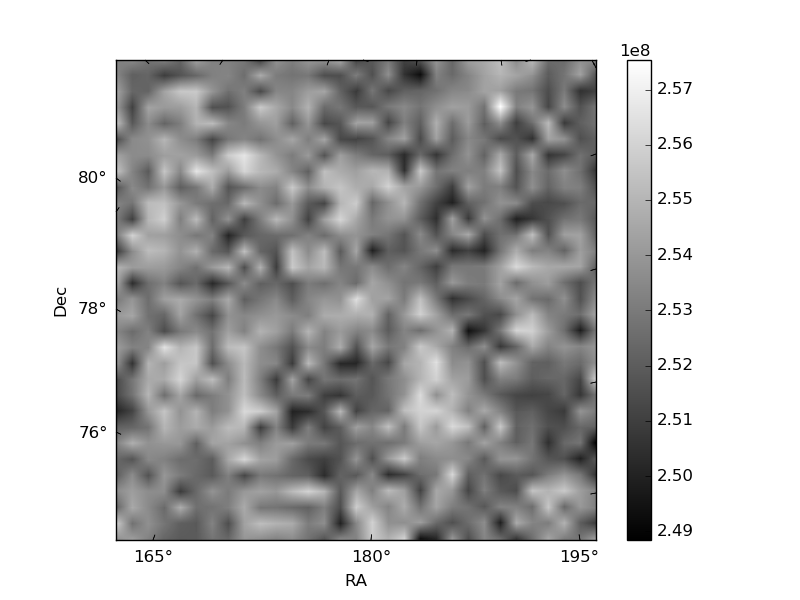
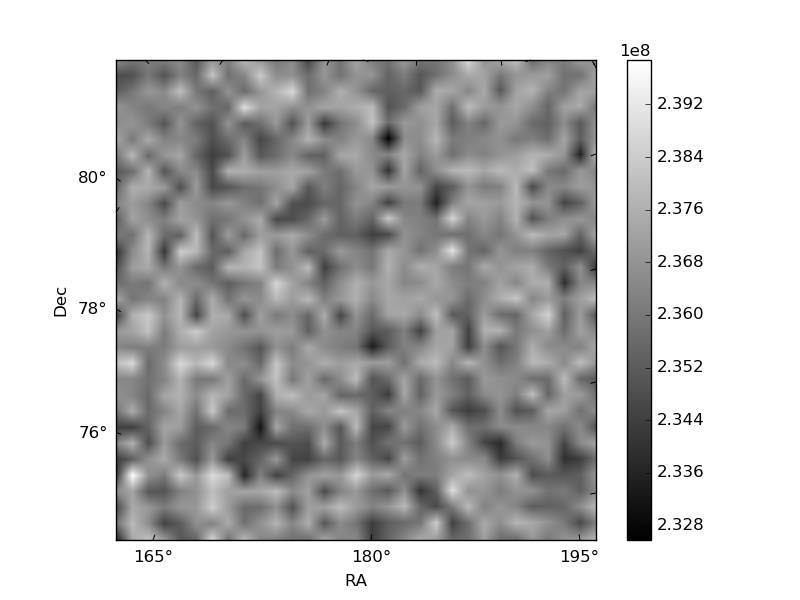
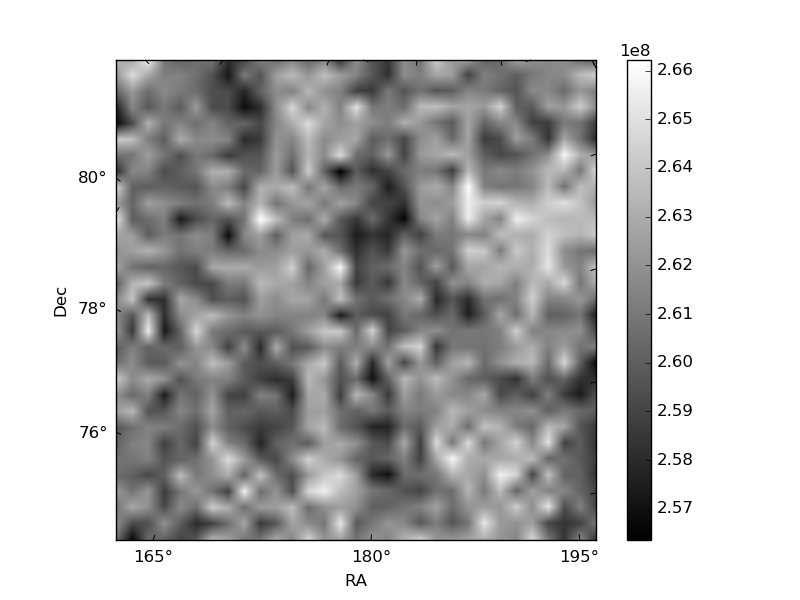
Histogram calculated using DETX and DETY for each event in the final _common_clean file
| Quadrant A | 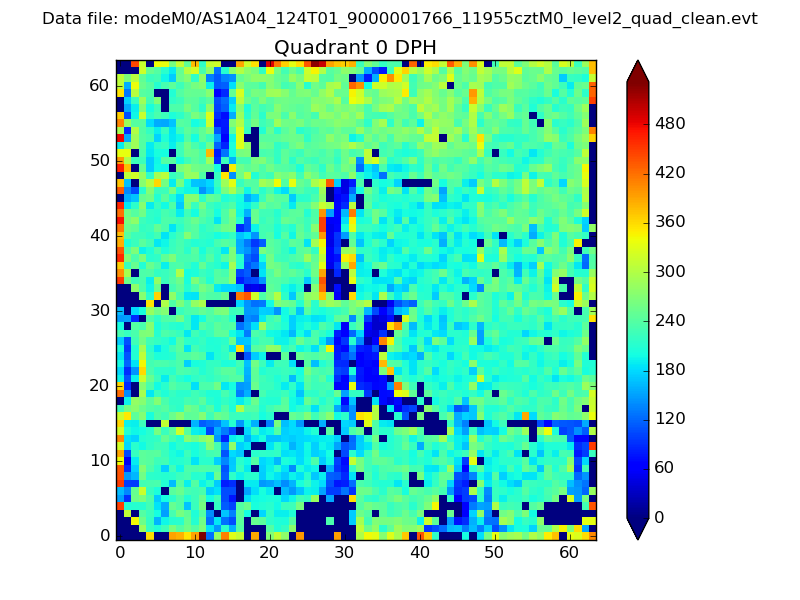 |
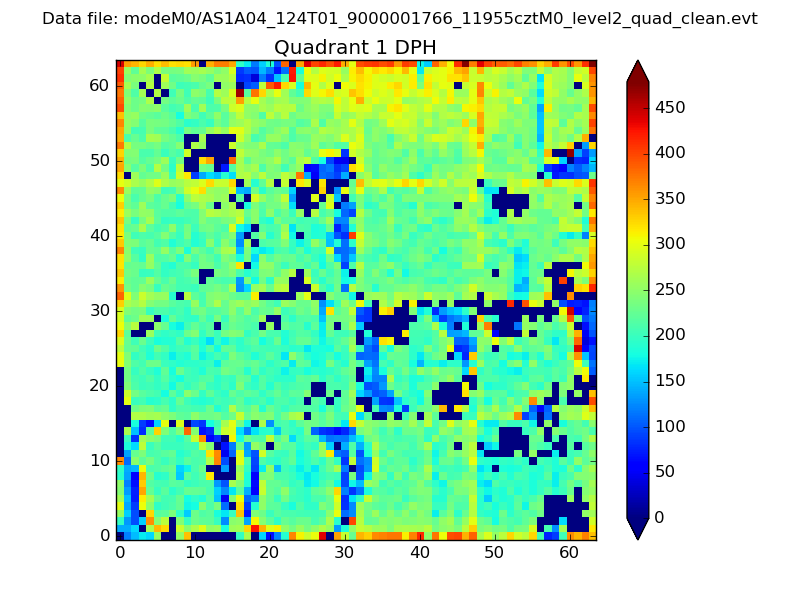 |
Quadrant B |
|---|---|---|---|
| Quadrant D | 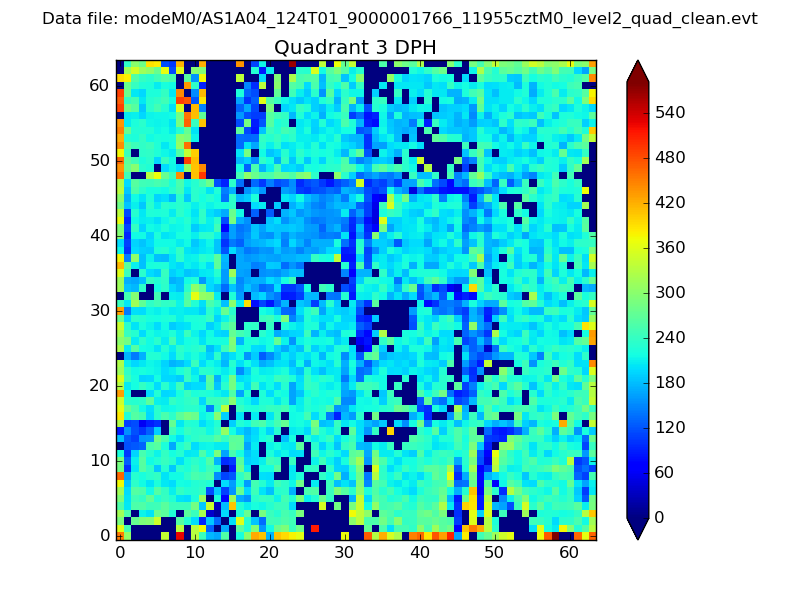 |
 |
Quadrant C |
| Plot type | Count rate plots | Images |
|---|---|---|
| Comparison with Poisson distribution Blue bars denote a histogram of data divided into 1 sec bins. Red curve is a Poisson curve with rate = median count rate of data. |
 |
 |
| Quadrant-wise count rates Data is divided into 100 sec bins |
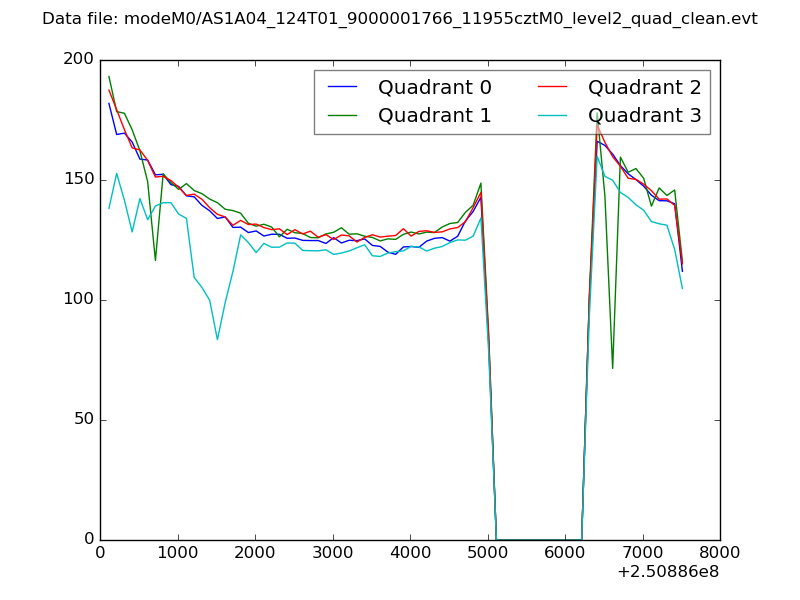 |
|
| Module-wise count rates for Quadrant A Data is divided into 100 sec bins |
 |
 |
| Module-wise count rates for Quadrant B Data is divided into 100 sec bins |
 |
 |
| Module-wise count rates for Quadrant C Data is divided into 100 sec bins |
 |
 |
| Module-wise count rates for Quadrant D Data is divided into 100 sec bins |
 |
 |
| Parameter | Plot |
|---|---|
| CZT HV Monitor | 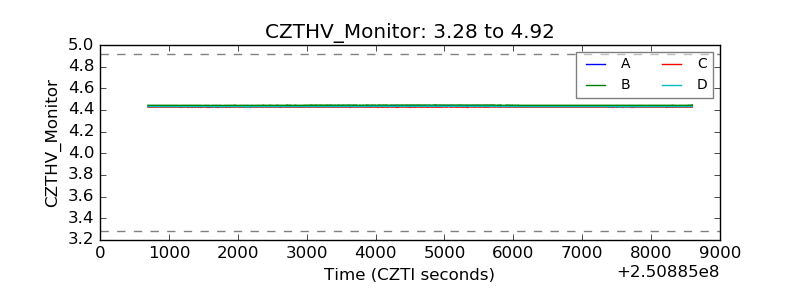 |
| D_VDD | 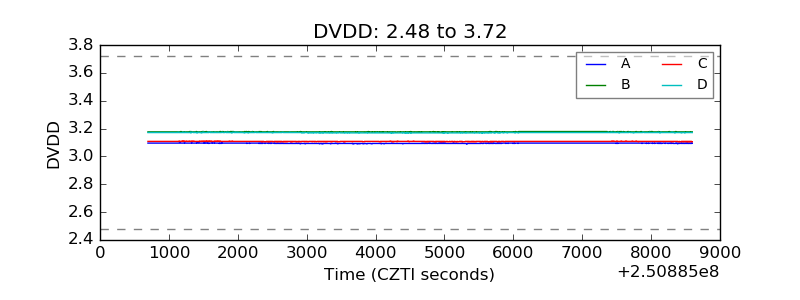 |
| Temperature 1 | 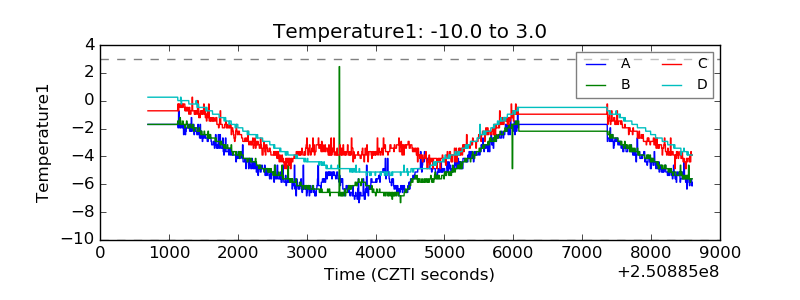 |
| Veto HV Monitor | 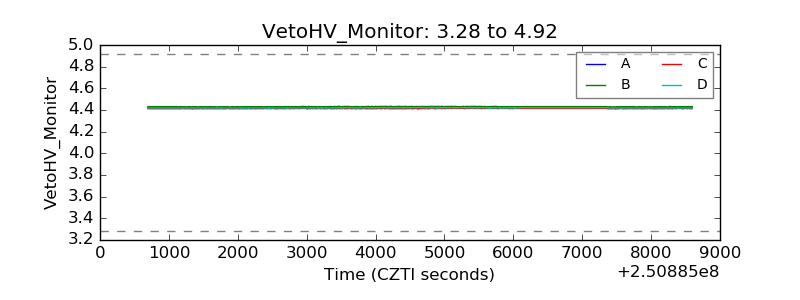 |
| Veto LLD | 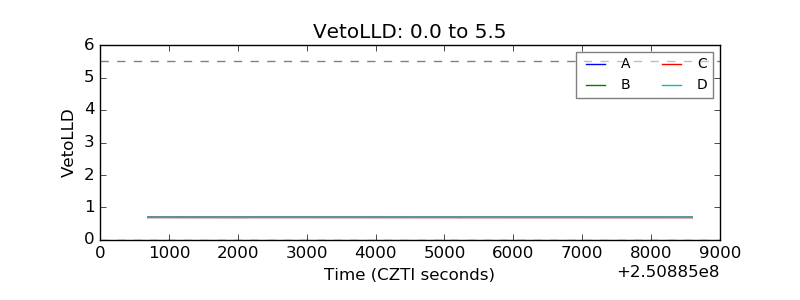 |
| Alpha Counter | 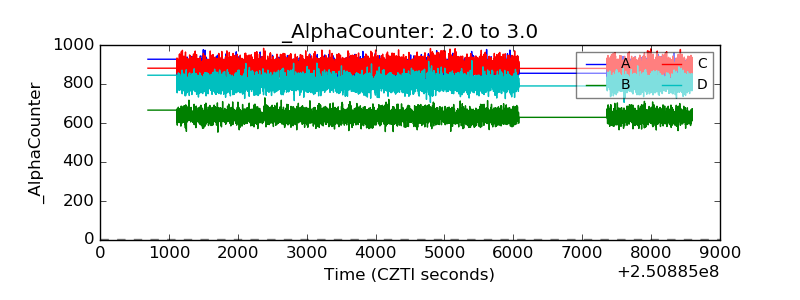 |
| _CPM_Rate | 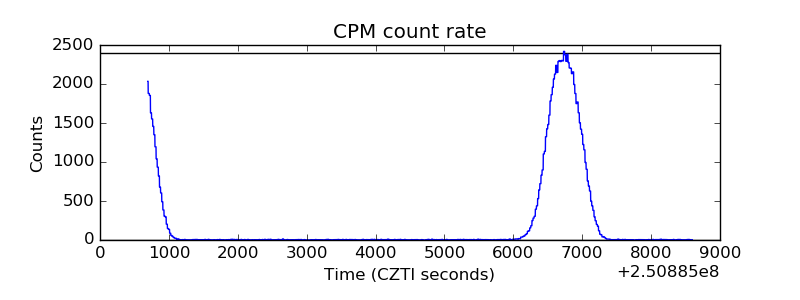 |
| CZT Counter | 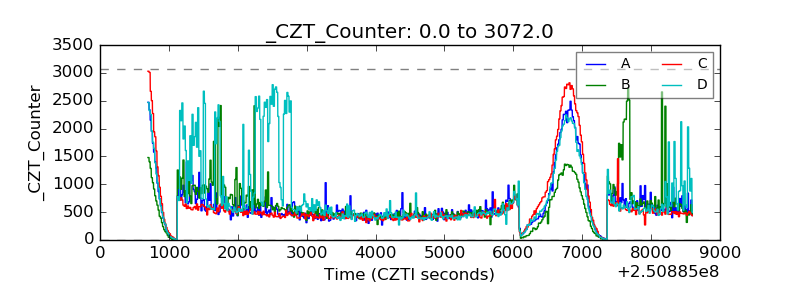 |
| +2.5 Volts monitor |  |
| +5 Volts monitor |  |
| _ROLL_ROT |  |
| _Roll_DEC | 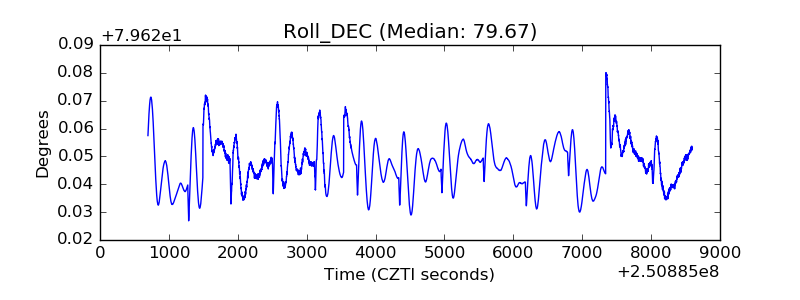 |
| _Roll_RA | 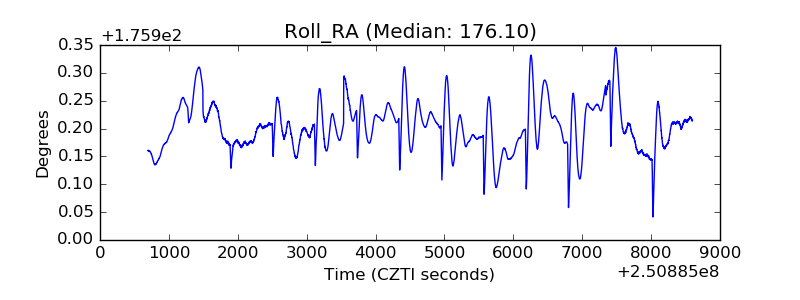 |
| Veto Counter |  |