| Param | Original file | Final file |
|---|---|---|
| Filename | modeM0/AS1A04_124T01_9000001766_11956cztM0_level2.evt | modeM0/AS1A04_124T01_9000001766_11956cztM0_level2_quad_clean.evt |
| Size (bytes) | 466,191,360 | 123,488,640 |
| Size | 444.6 MB | 117.8 MB |
| Events in quadrant A | 3,251,835 | 832,951 |
| Events in quadrant B | 3,758,557 | 841,840 |
| Events in quadrant C | 2,886,539 | 842,628 |
| Events in quadrant D | 3,800,298 | 789,526 |
| Mode SS | |||
|---|---|---|---|
| Quadrant | BADHDUFLAG | Total packets | Discarded packets |
| A | 0 | 126 | 0 |
| B | 0 | 126 | 0 |
| C | 0 | 126 | 0 |
| D | 0 | 126 | 0 |
| Mode M9 | |||
|---|---|---|---|
| Quadrant | BADHDUFLAG | Total packets | Discarded packets |
| A | 0 | 17 | 0 |
| B | 0 | 17 | 0 |
| C | 0 | 17 | 0 |
| D | 0 | 18 | 0 |
| Mode M0 | |||
|---|---|---|---|
| Quadrant | BADHDUFLAG | Total packets | Discarded packets |
| A | 0 | 13876 | 3 |
| B | 0 | 15418 | 2 |
| C | 0 | 12904 | 2 |
| D | 0 | 15616 | 2 |
| Quadrant | Total seconds | Saturated seconds | Saturation percentage |
|---|---|---|---|
| A | 6206 | 57 | 0.918466% |
| B | 6206 | 283 | 4.560103% |
| C | 6206 | 36 | 0.580084% |
| D | 6206 | 121 | 1.949726% |
Noise dominated data is calculated using 1-second bins in cleaned event files. If a bin has >2000 counts, and if more than 50% of those come from <1% of pixels, then it is considered to be noise-dominated and hence unusable.
| Quadrant | # 1 sec bins | Bins with >0 counts | Bins with >2000 counts | High rate bins dominated by noise | Noise dominated (total time) | Noise dominated (detector-on time) | Marked lightcurve |
|---|---|---|---|---|---|---|---|
| A | 7507 | 6208 | 3 | 3 | 0.04% | 0.05% | 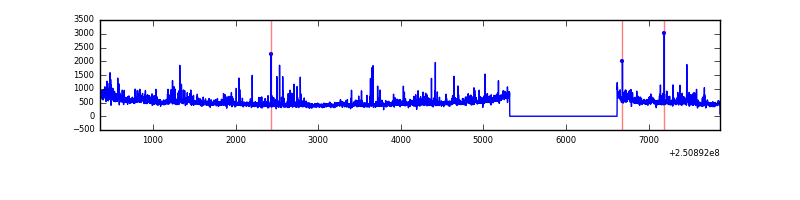 |
| B | 7507 | 6208 | 161 | 161 | 2.14% | 2.59% | 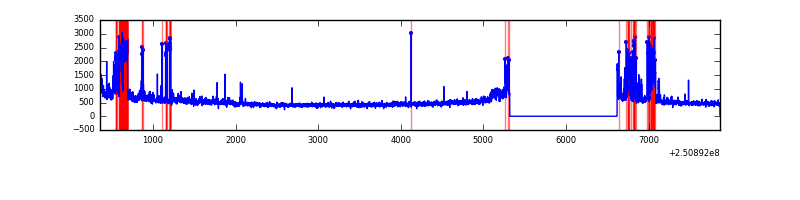 |
| C | 7507 | 6208 | 0 | 0 | 0.00% | 0.00% | 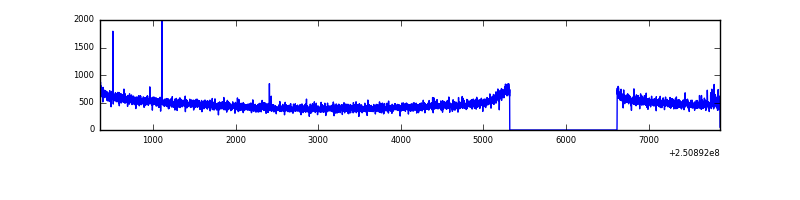 |
| D | 7507 | 6207 | 52 | 52 | 0.69% | 0.84% | 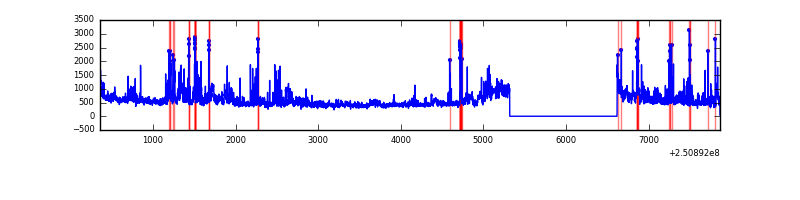 |
Top three noisy pixels from each quadrant. If the there are fewer than three noisy pixels in the level2.evt file, extra rows are filled as -1
| Pixel properties | Quadrant properties | ||||||
|---|---|---|---|---|---|---|---|
| Quadrant | DetID | PixID | Counts | Sigma | Mean | Median | Sigma |
| A | 1 | 162 | 119838 | 795.29 | 740 | 722 | 149.8 |
| A | 1 | 178 | 58772 | 387.57 | 740 | 722 | 149.8 |
| A | 1 | 161 | 51801 | 341.03 | 740 | 722 | 149.8 |
| B | 4 | 239 | 517339 | 3776.51 | 736 | 719 | 136.8 |
| B | 15 | 204 | 192728 | 1403.59 | 736 | 719 | 136.8 |
| B | 10 | 244 | 89311 | 647.61 | 736 | 719 | 136.8 |
| C | 1 | 16 | 12393 | 70.0 | 733 | 737 | 166.5 |
| C | 14 | 234 | 7326 | 39.57 | 733 | 737 | 166.5 |
| C | 13 | 61 | 5441 | 28.25 | 733 | 737 | 166.5 |
| D | 1 | 52 | 452613 | 2659.96 | 718 | 697 | 169.9 |
| D | 13 | 249 | 122944 | 719.54 | 718 | 697 | 169.9 |
| D | 13 | 122 | 119859 | 701.38 | 718 | 697 | 169.9 |
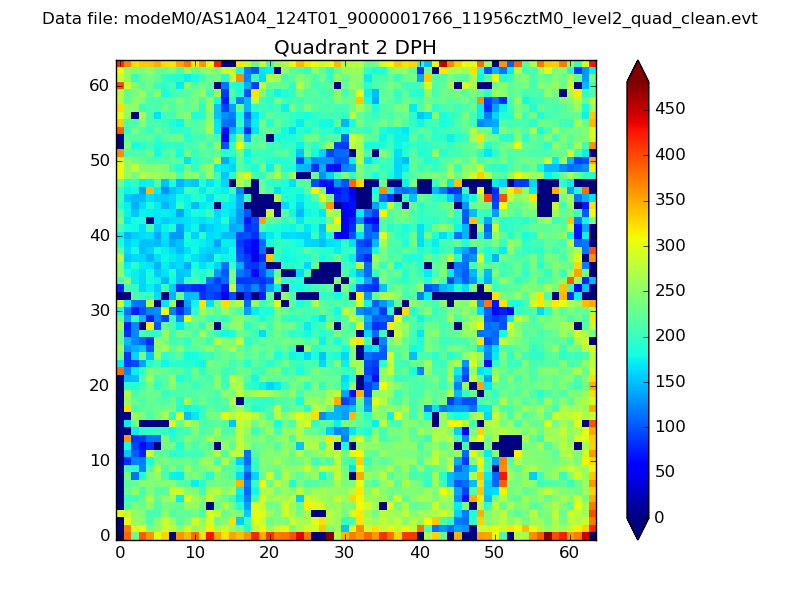
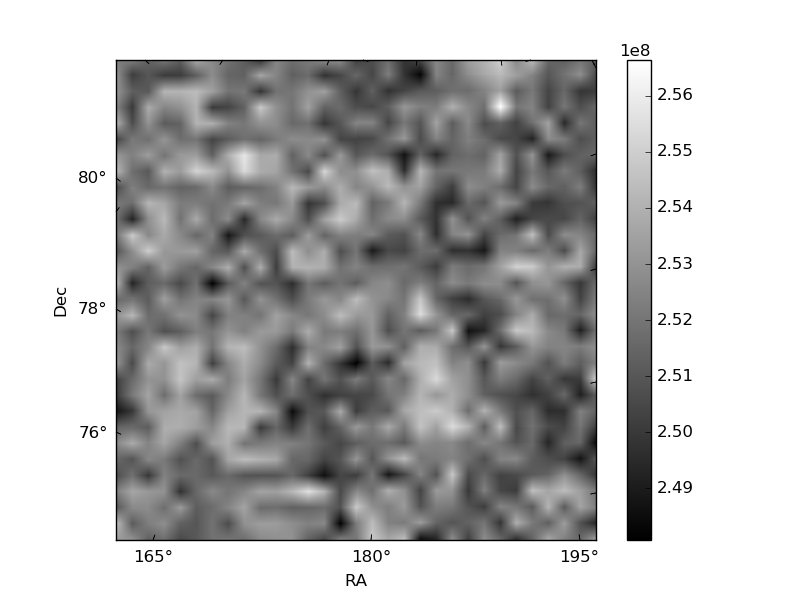
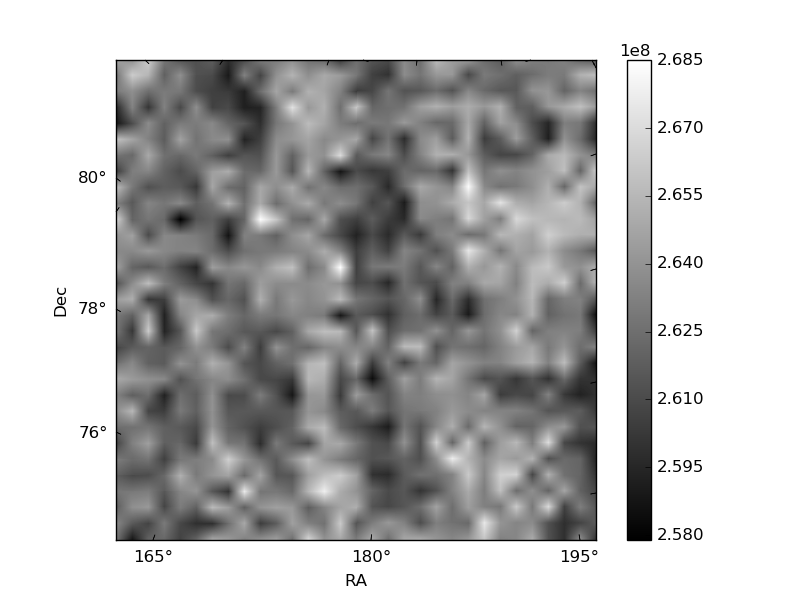
Histogram calculated using DETX and DETY for each event in the final _common_clean file
| Quadrant A | 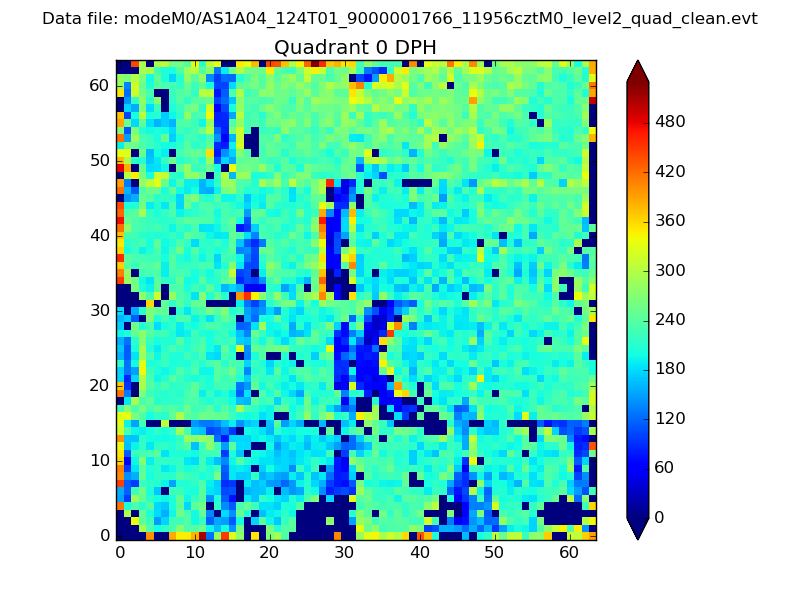 |
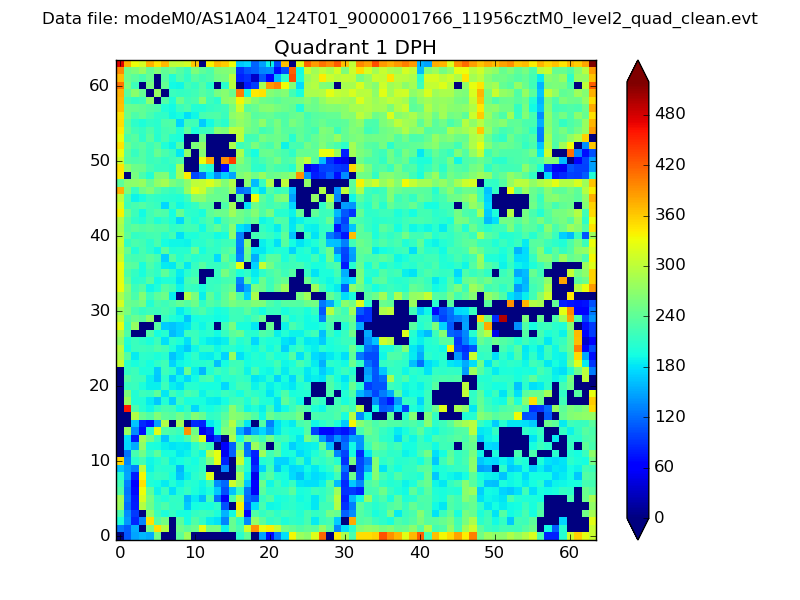 |
Quadrant B |
|---|---|---|---|
| Quadrant D | 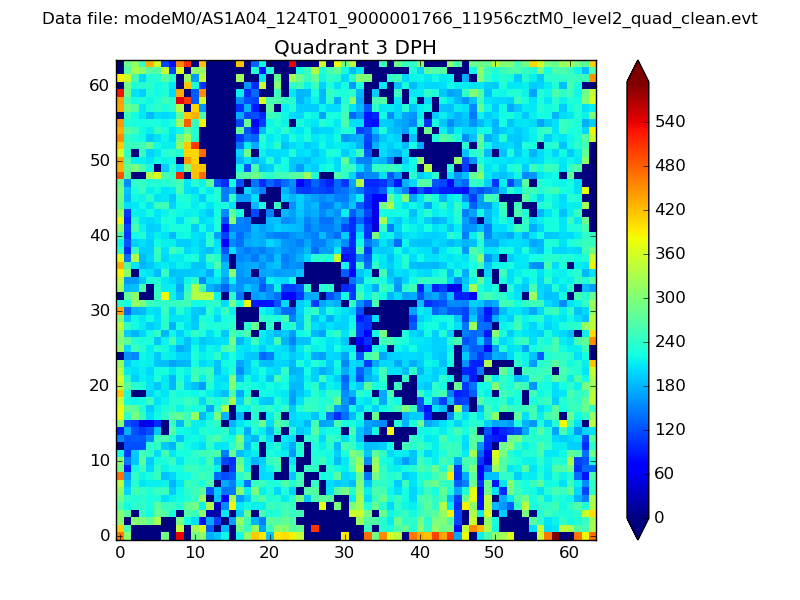 |
 |
Quadrant C |
| Plot type | Count rate plots | Images |
|---|---|---|
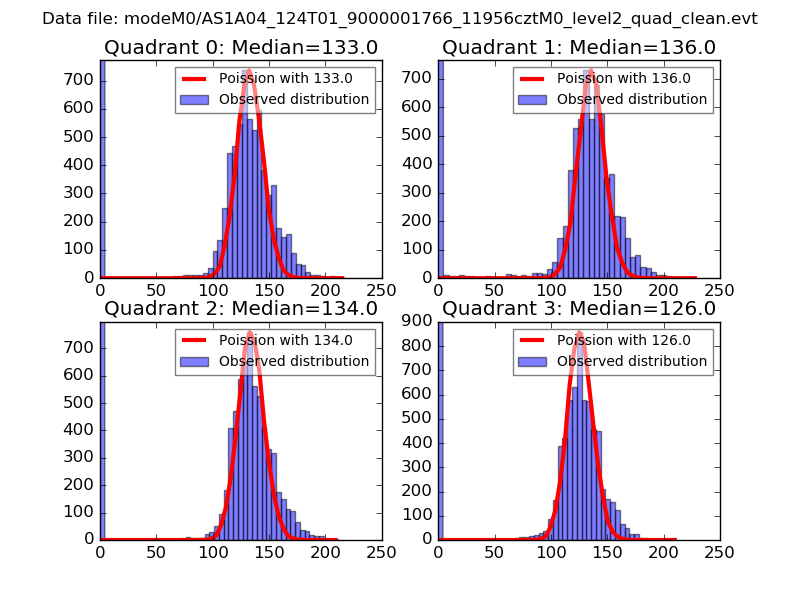
| Comparison with Poisson distribution Blue bars denote a histogram of data divided into 1 sec bins. Red curve is a Poisson curve with rate = median count rate of data. |
 |
 |
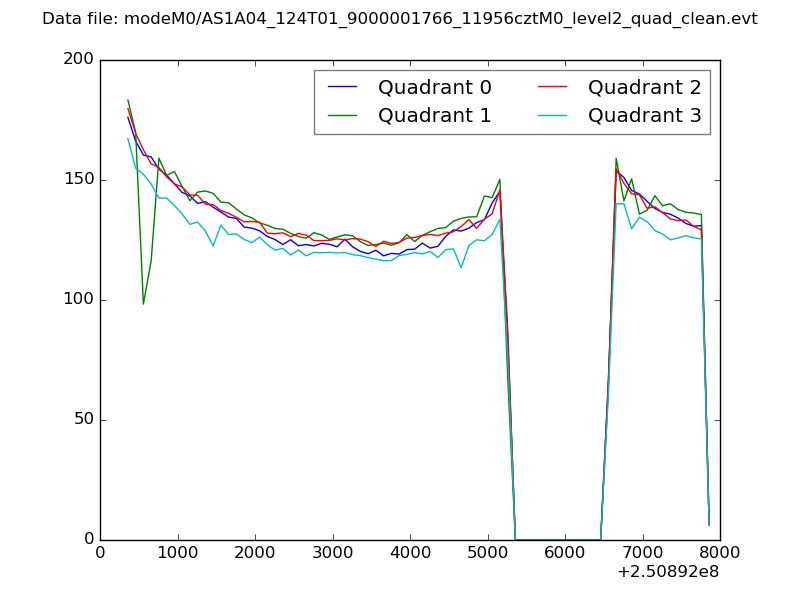
| Quadrant-wise count rates Data is divided into 100 sec bins |
 |
|
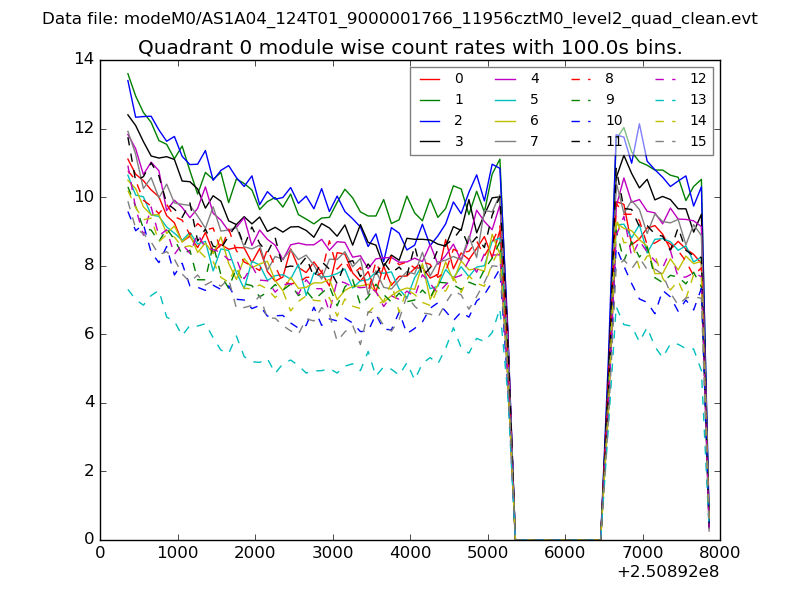
| Module-wise count rates for Quadrant A Data is divided into 100 sec bins |
 |
 |
| Module-wise count rates for Quadrant B Data is divided into 100 sec bins |
 |
 |
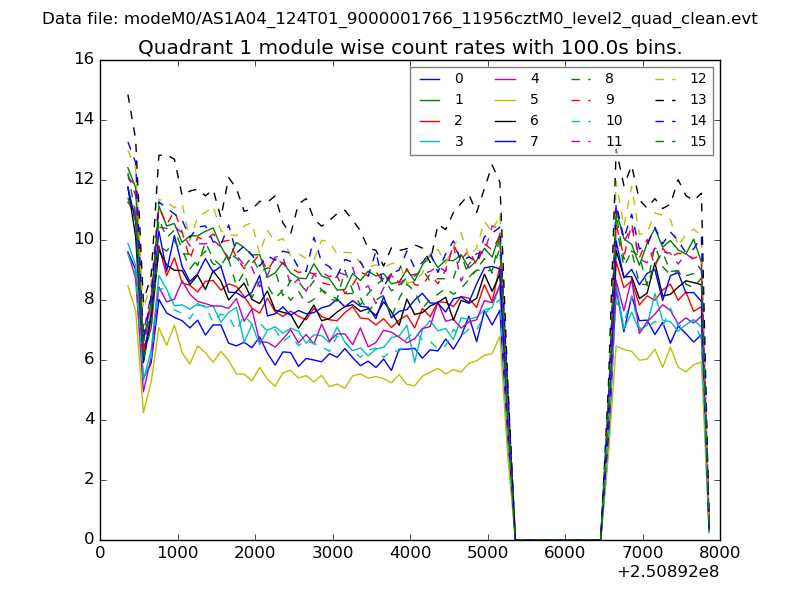
| Module-wise count rates for Quadrant C Data is divided into 100 sec bins |
 |
 |
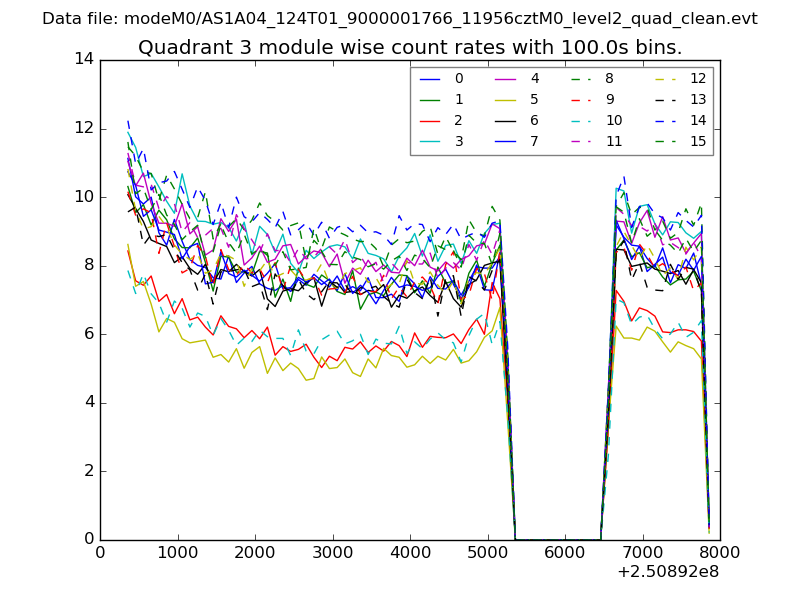
| Module-wise count rates for Quadrant D Data is divided into 100 sec bins |
 |
 |
| Parameter | Plot |
|---|---|
| CZT HV Monitor | 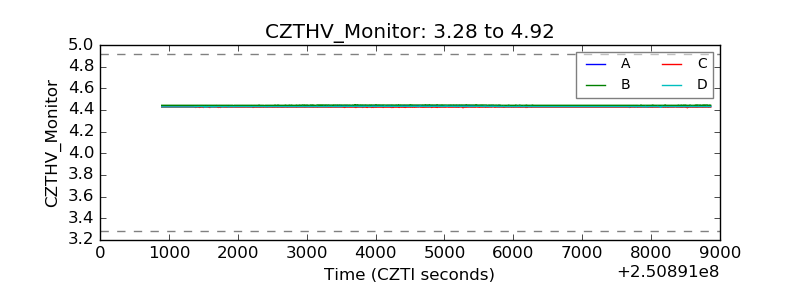 |
| D_VDD | 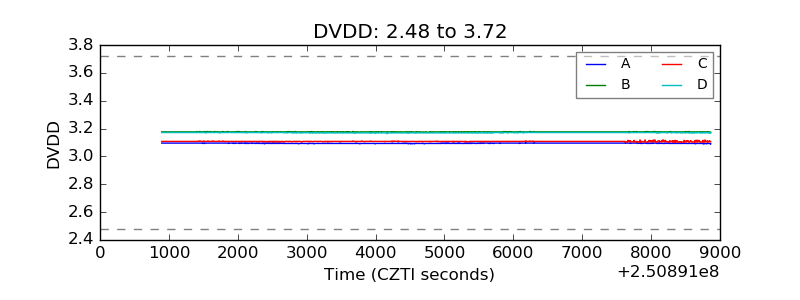 |
| Temperature 1 | 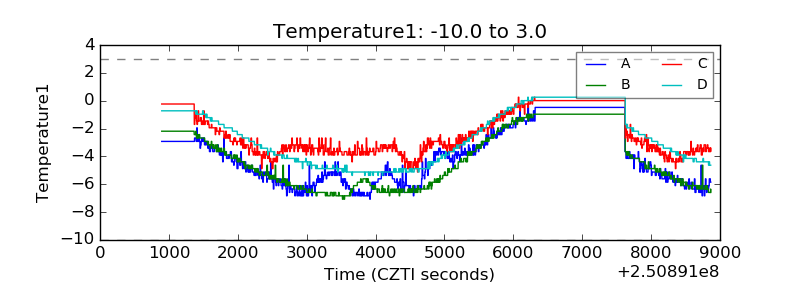 |
| Veto HV Monitor | 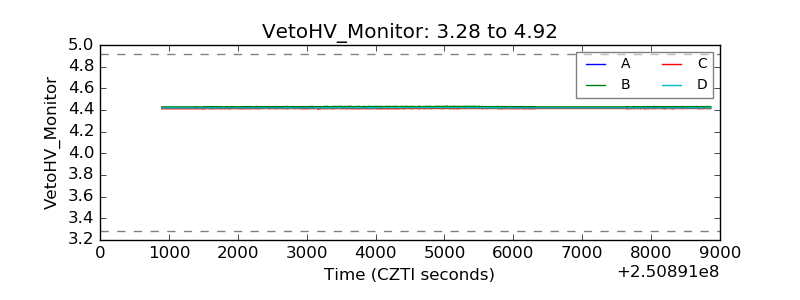 |
| Veto LLD | 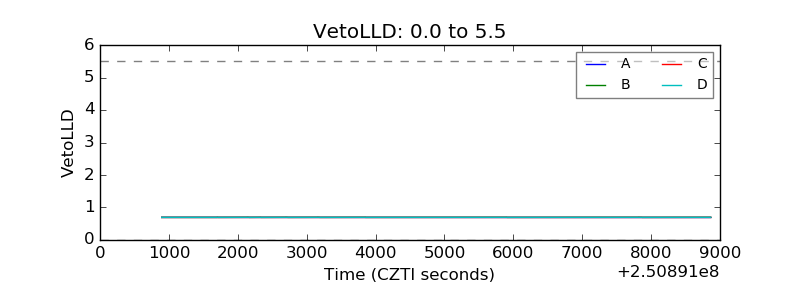 |
| Alpha Counter | 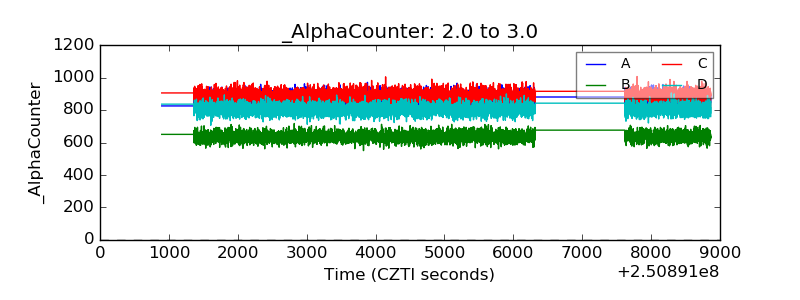 |
| _CPM_Rate | 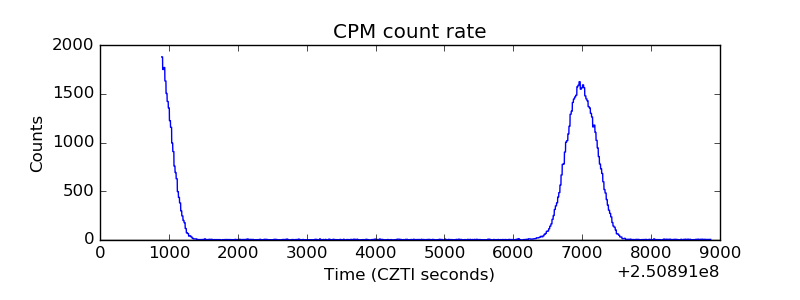 |
| CZT Counter | 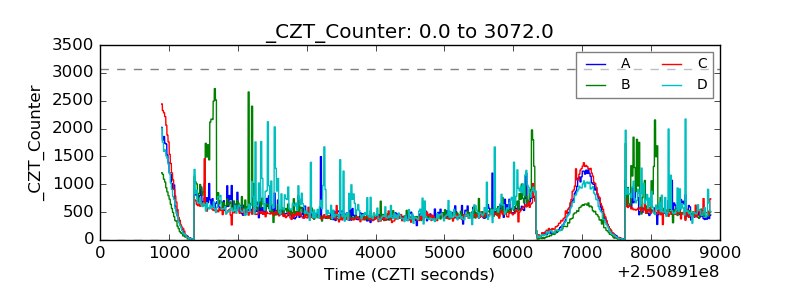 |
| +2.5 Volts monitor |  |
| +5 Volts monitor |  |
| _ROLL_ROT |  |
| _Roll_DEC | 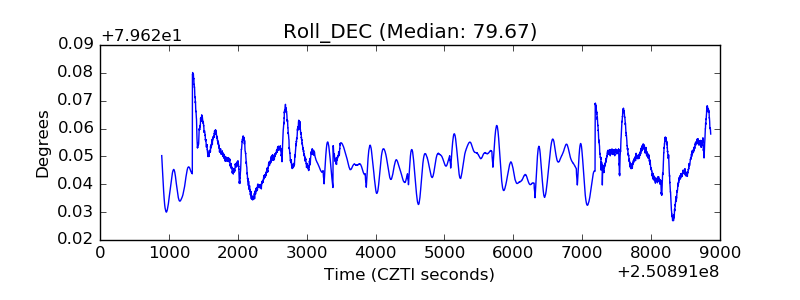 |
| _Roll_RA | 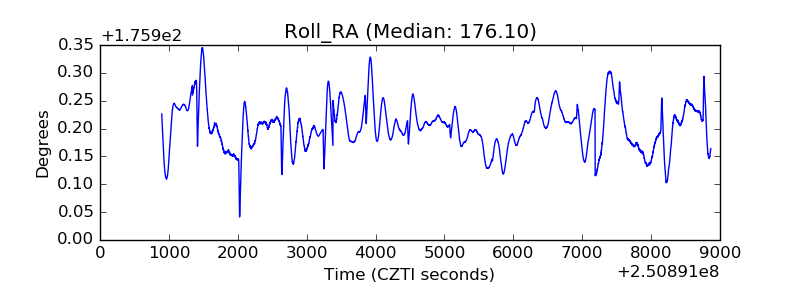 |
| Veto Counter |  |