| Param | Original file | Final file |
|---|---|---|
| Filename | modeM0/AS1A04_124T01_9000001766_11959cztM0_level2.evt | modeM0/AS1A04_124T01_9000001766_11959cztM0_level2_quad_clean.evt |
| Size (bytes) | 491,978,880 | 125,801,280 |
| Size | 469.2 MB | 120.0 MB |
| Events in quadrant A | 3,295,807 | 845,049 |
| Events in quadrant B | 4,222,647 | 842,983 |
| Events in quadrant C | 2,980,776 | 836,073 |
| Events in quadrant D | 3,924,836 | 798,394 |
| Mode SS | |||
|---|---|---|---|
| Quadrant | BADHDUFLAG | Total packets | Discarded packets |
| A | 0 | 142 | 0 |
| B | 0 | 142 | 0 |
| C | 0 | 142 | 0 |
| D | 0 | 142 | 0 |
| Mode M9 | |||
|---|---|---|---|
| Quadrant | BADHDUFLAG | Total packets | Discarded packets |
| A | 0 | 4 | 0 |
| B | 0 | 4 | 0 |
| C | 0 | 4 | 0 |
| D | 0 | 4 | 0 |
| Mode M0 | |||
|---|---|---|---|
| Quadrant | BADHDUFLAG | Total packets | Discarded packets |
| A | 0 | 14650 | 2 |
| B | 0 | 17492 | 1 |
| C | 0 | 14233 | 1 |
| D | 0 | 16681 | 1 |
| Quadrant | Total seconds | Saturated seconds | Saturation percentage |
|---|---|---|---|
| A | 7001 | 43 | 0.614198% |
| B | 7001 | 332 | 4.742180% |
| C | 7001 | 17 | 0.242822% |
| D | 7001 | 105 | 1.499786% |
Noise dominated data is calculated using 1-second bins in cleaned event files. If a bin has >2000 counts, and if more than 50% of those come from <1% of pixels, then it is considered to be noise-dominated and hence unusable.
| Quadrant | # 1 sec bins | Bins with >0 counts | Bins with >2000 counts | High rate bins dominated by noise | Noise dominated (total time) | Noise dominated (detector-on time) | Marked lightcurve |
|---|---|---|---|---|---|---|---|
| A | 7437 | 7003 | 0 | 0 | 0.00% | 0.00% | 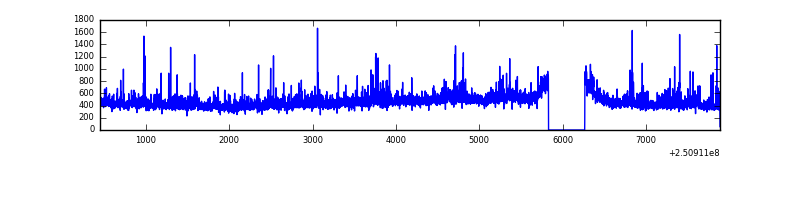 |
| B | 7437 | 7002 | 220 | 220 | 2.96% | 3.14% | 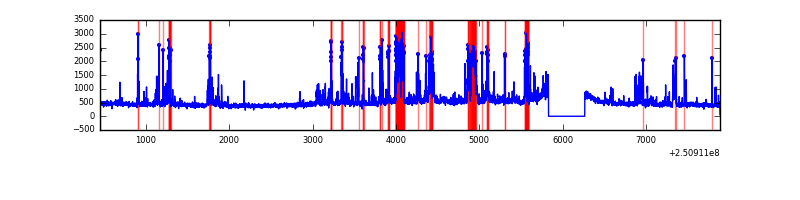 |
| C | 7437 | 7003 | 0 | 0 | 0.00% | 0.00% |  |
| D | 7437 | 7003 | 81 | 81 | 1.09% | 1.16% | 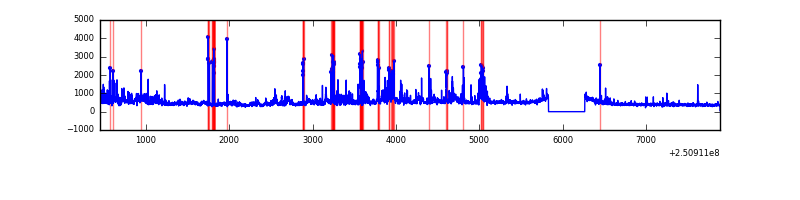 |
Top three noisy pixels from each quadrant. If the there are fewer than three noisy pixels in the level2.evt file, extra rows are filled as -1
| Pixel properties | Quadrant properties | ||||||
|---|---|---|---|---|---|---|---|
| Quadrant | DetID | PixID | Counts | Sigma | Mean | Median | Sigma |
| A | 1 | 162 | 96186 | 597.79 | 787 | 769 | 159.6 |
| A | 1 | 178 | 49601 | 305.93 | 787 | 769 | 159.6 |
| A | 1 | 161 | 43572 | 268.16 | 787 | 769 | 159.6 |
| B | 4 | 239 | 904151 | 6008.08 | 781 | 761 | 150.4 |
| B | 15 | 204 | 140833 | 931.56 | 781 | 761 | 150.4 |
| B | 10 | 244 | 81249 | 535.29 | 781 | 761 | 150.4 |
| C | 13 | 61 | 5525 | 26.92 | 763 | 765 | 176.8 |
| C | 14 | 234 | 2491 | 9.76 | 763 | 765 | 176.8 |
| C | 1 | 16 | 2235 | 8.31 | 763 | 765 | 176.8 |
| D | 1 | 52 | 413965 | 2144.91 | 746 | 728 | 192.7 |
| D | 13 | 104 | 150791 | 778.9 | 746 | 728 | 192.7 |
| D | 13 | 122 | 149655 | 773.01 | 746 | 728 | 192.7 |
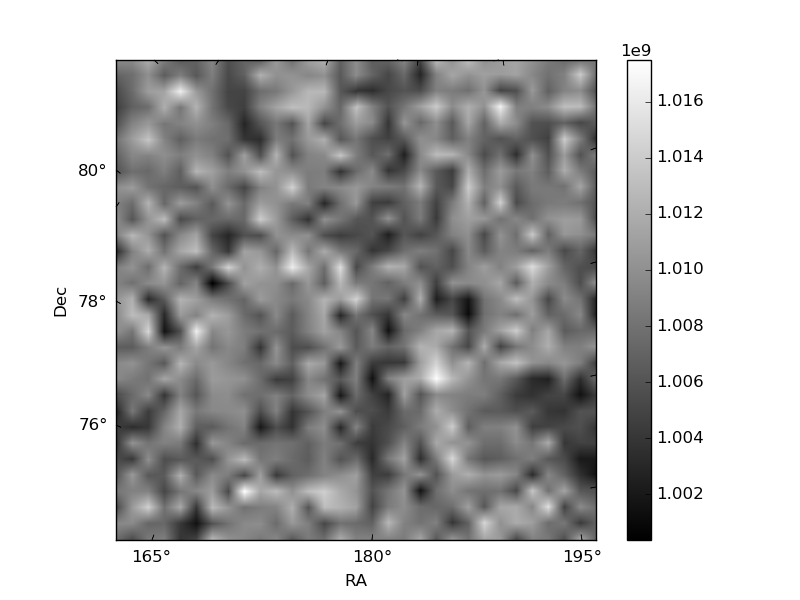
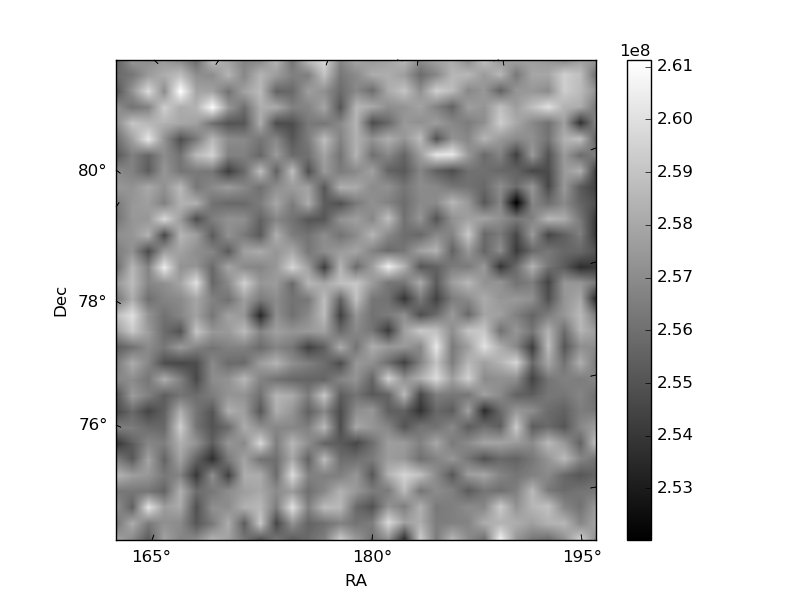
Histogram calculated using DETX and DETY for each event in the final _common_clean file
| Quadrant A | 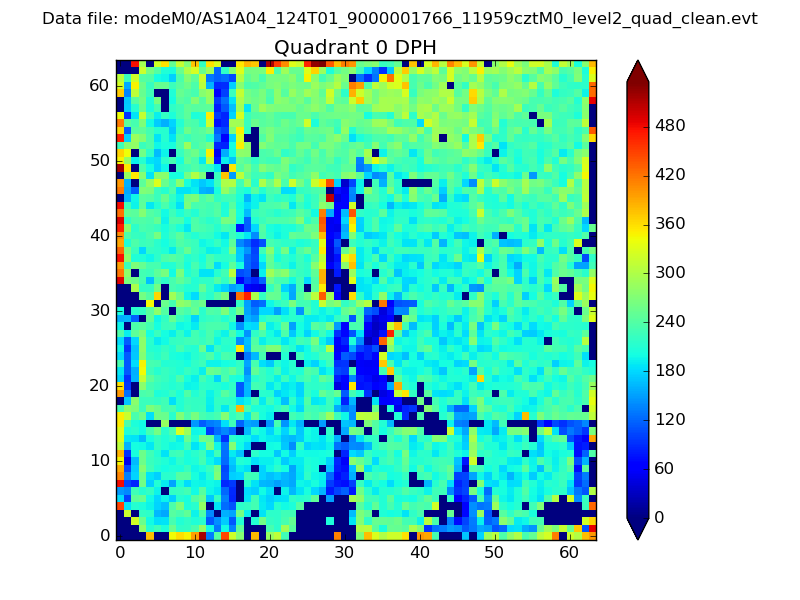 |
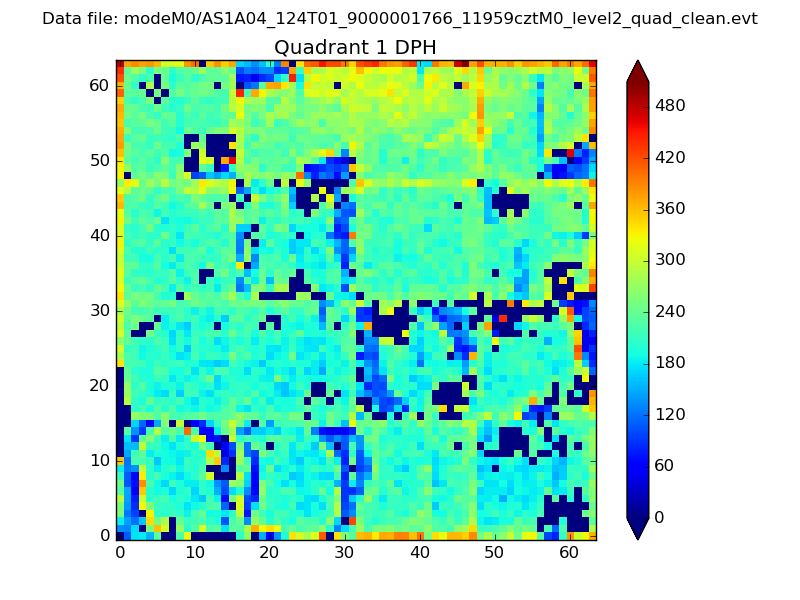 |
Quadrant B |
|---|---|---|---|
| Quadrant D | 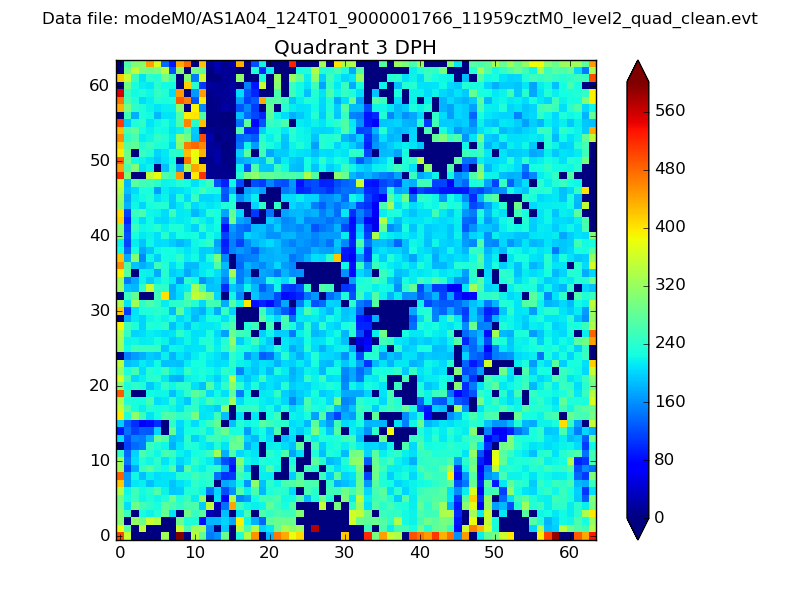 |
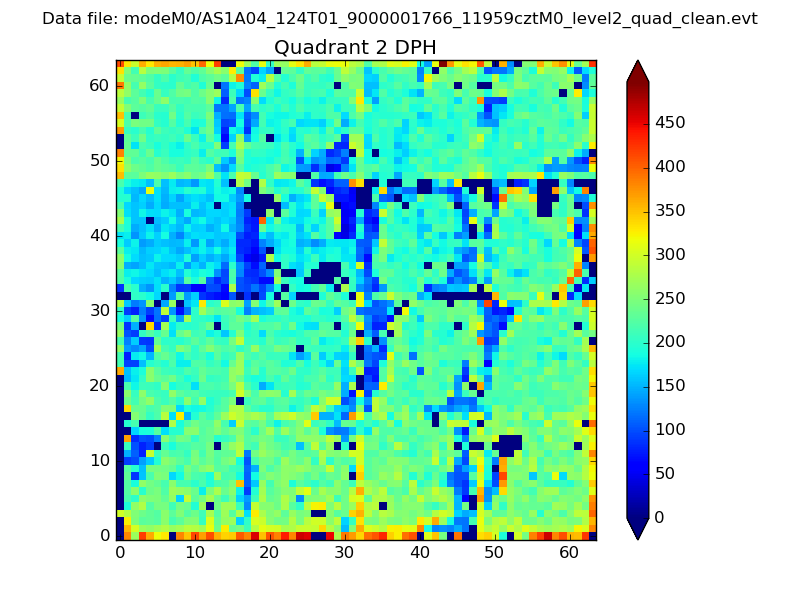 |
Quadrant C |
| Plot type | Count rate plots | Images |
|---|---|---|
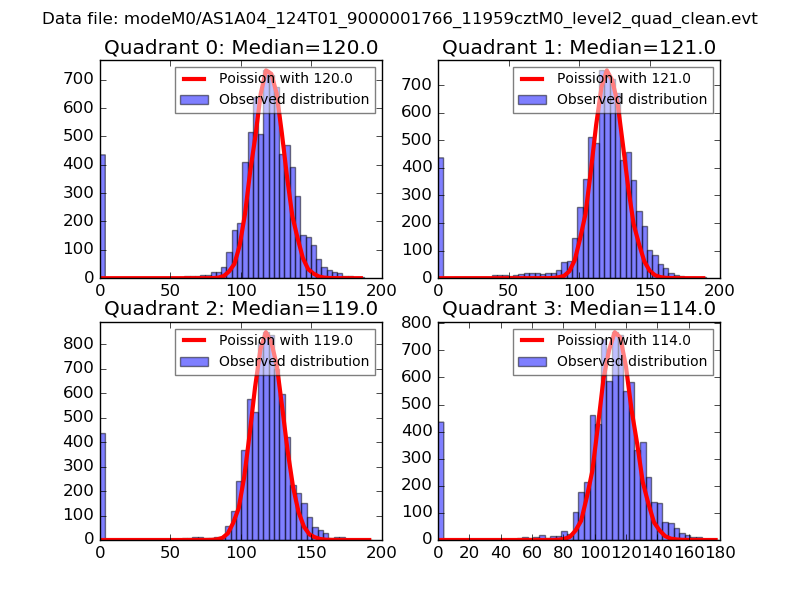
| Comparison with Poisson distribution Blue bars denote a histogram of data divided into 1 sec bins. Red curve is a Poisson curve with rate = median count rate of data. |
 |
 |
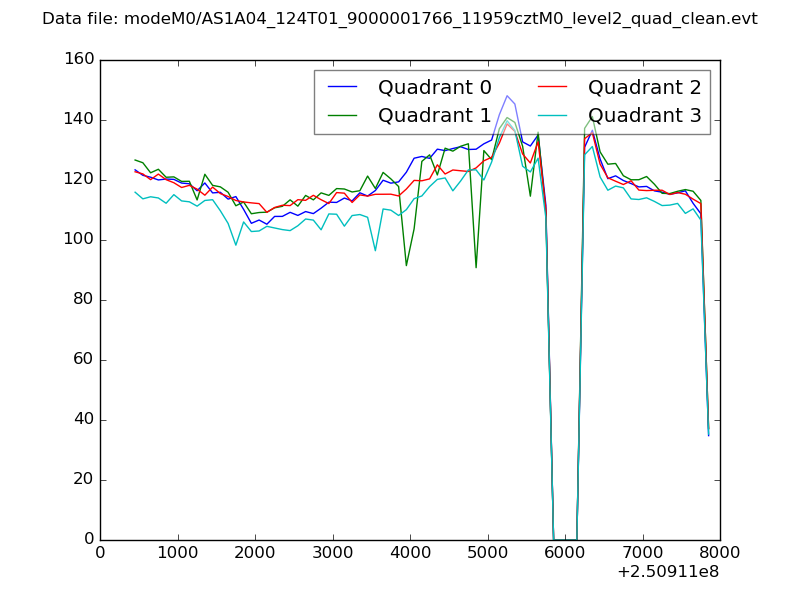
| Quadrant-wise count rates Data is divided into 100 sec bins |
 |
|
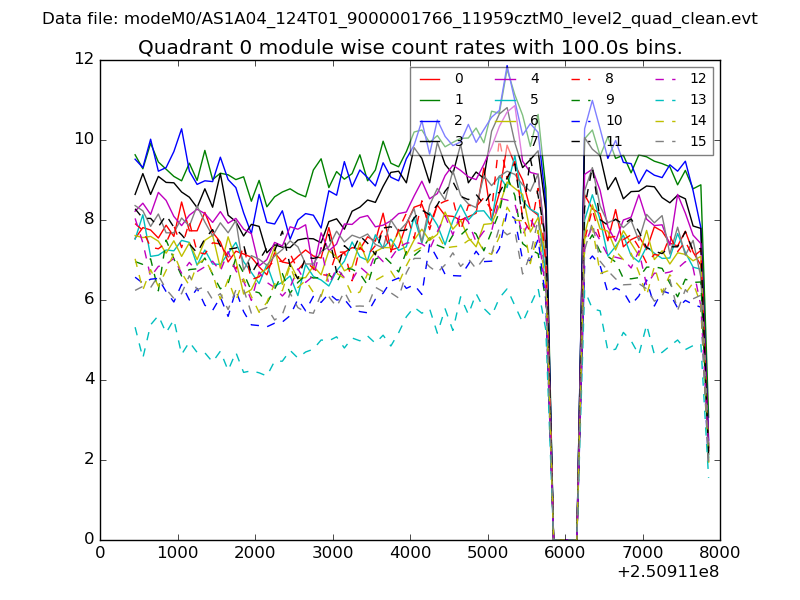
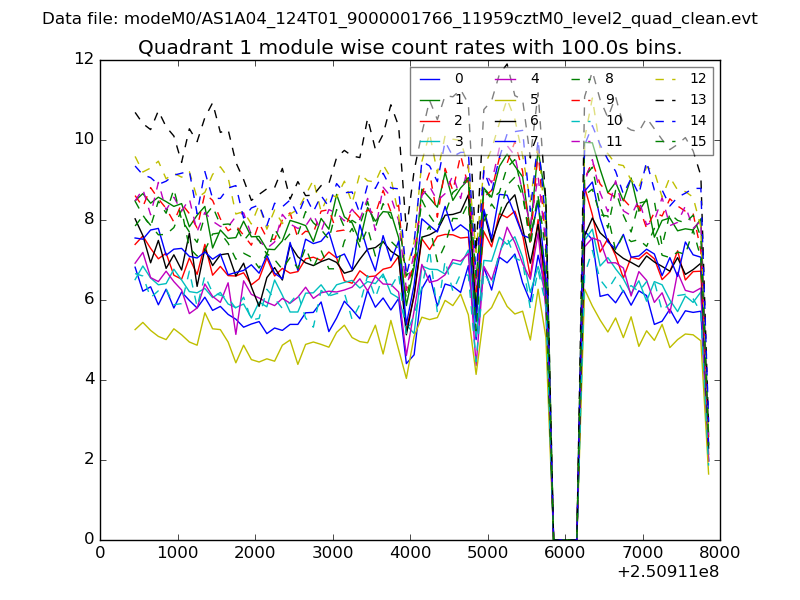
| Module-wise count rates for Quadrant A Data is divided into 100 sec bins |
 |
 |
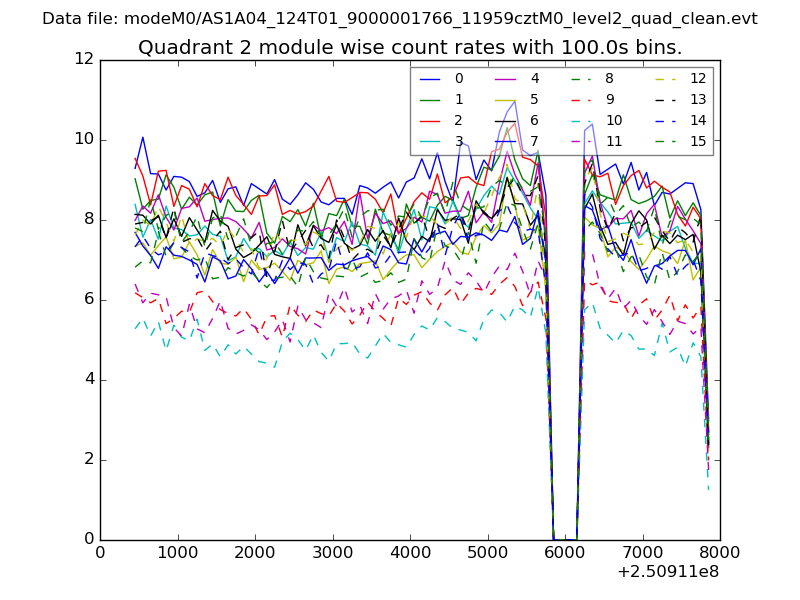
| Module-wise count rates for Quadrant B Data is divided into 100 sec bins |
 |
 |
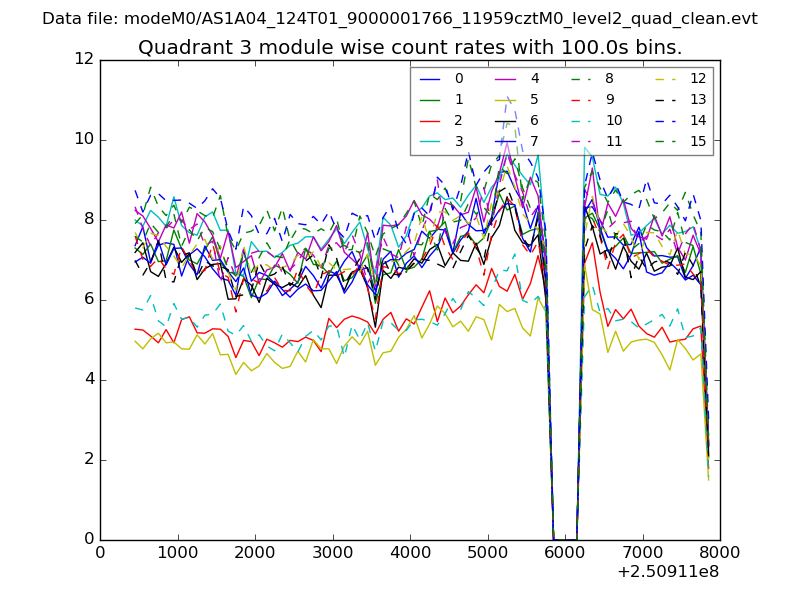
| Module-wise count rates for Quadrant C Data is divided into 100 sec bins |
 |
 |
| Module-wise count rates for Quadrant D Data is divided into 100 sec bins |
 |
 |
| Parameter | Plot |
|---|---|
| CZT HV Monitor | 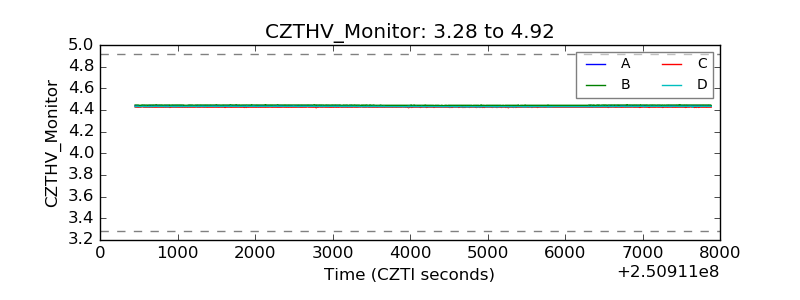 |
| D_VDD | 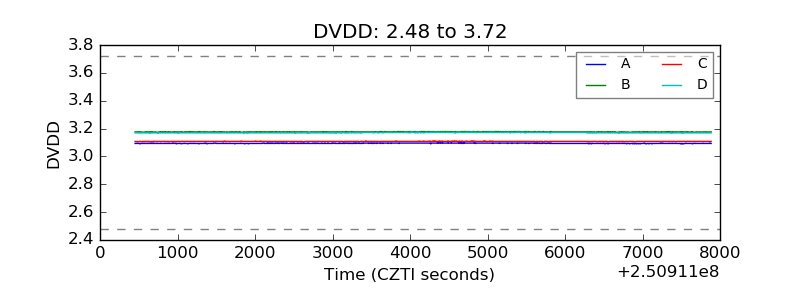 |
| Temperature 1 | 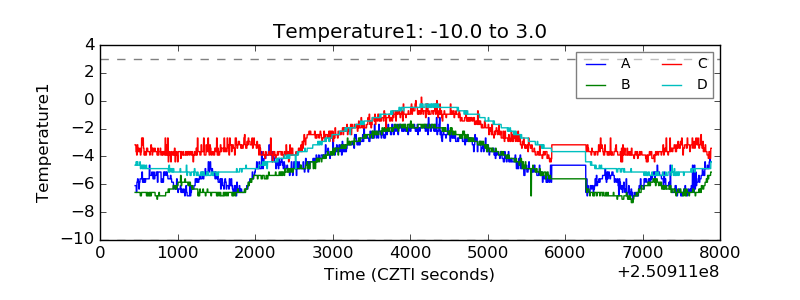 |
| Veto HV Monitor | 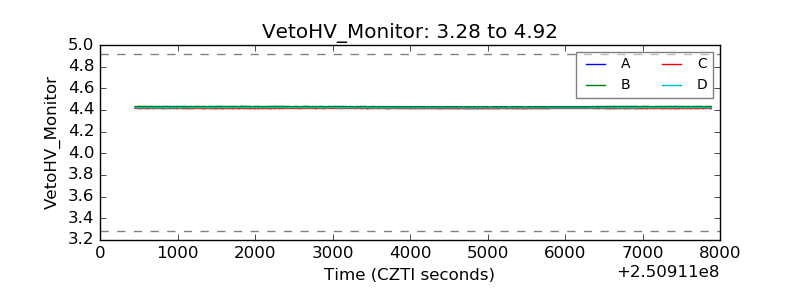 |
| Veto LLD | 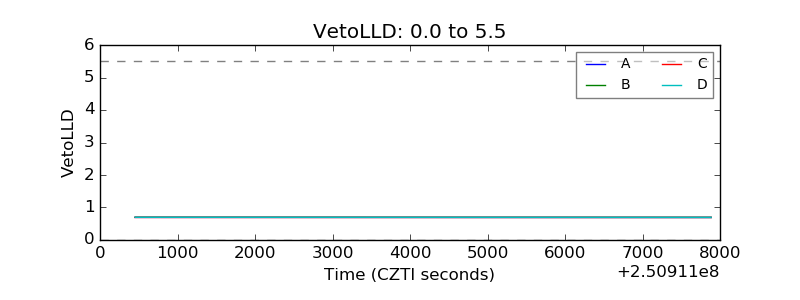 |
| Alpha Counter | 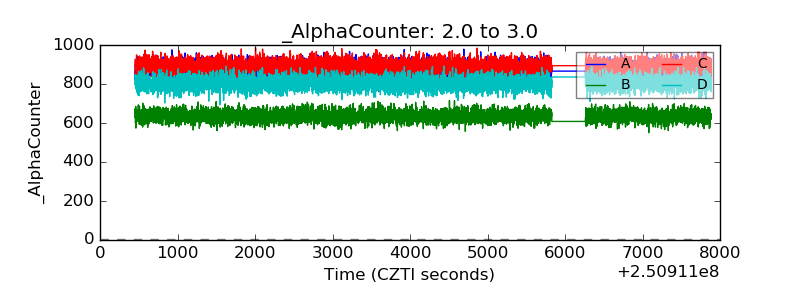 |
| _CPM_Rate | 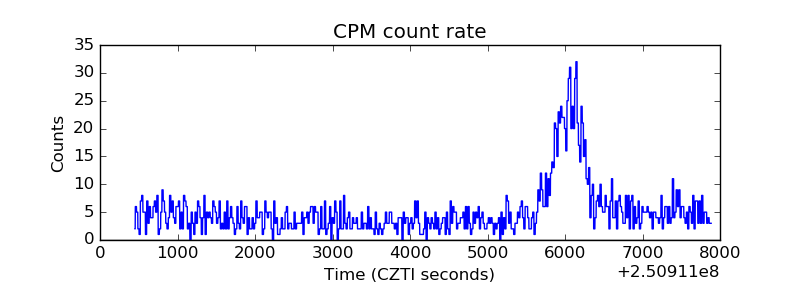 |
| CZT Counter | 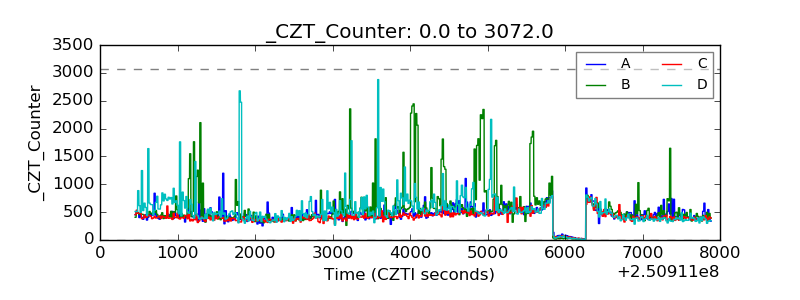 |
| +2.5 Volts monitor |  |
| +5 Volts monitor |  |
| _ROLL_ROT | 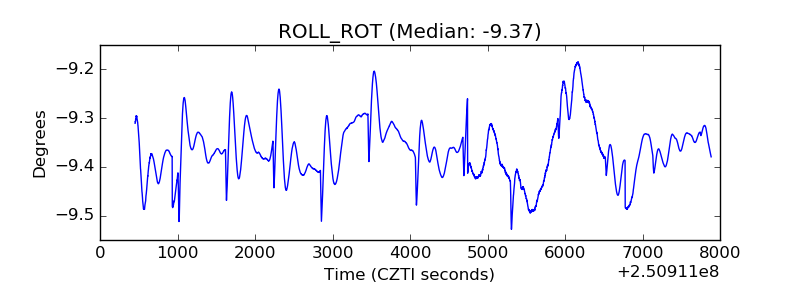 |
| _Roll_DEC | 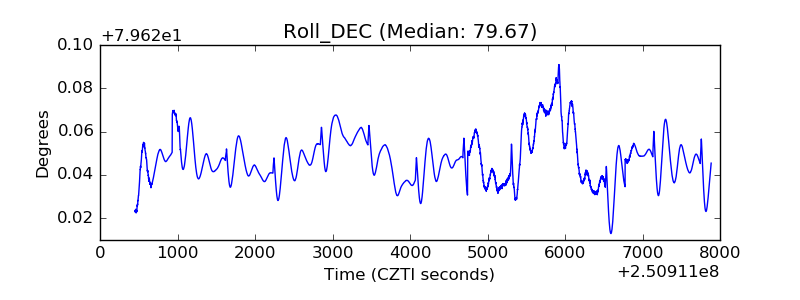 |
| _Roll_RA | 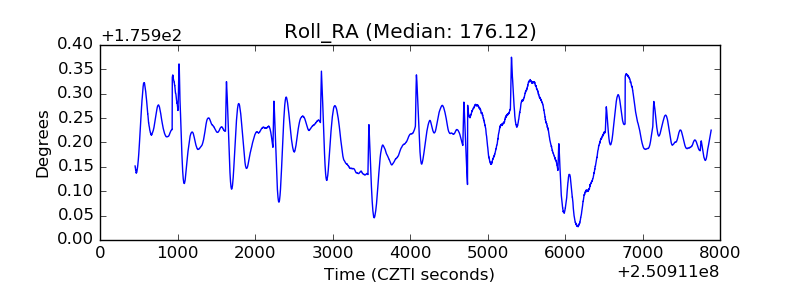 |
| Veto Counter | 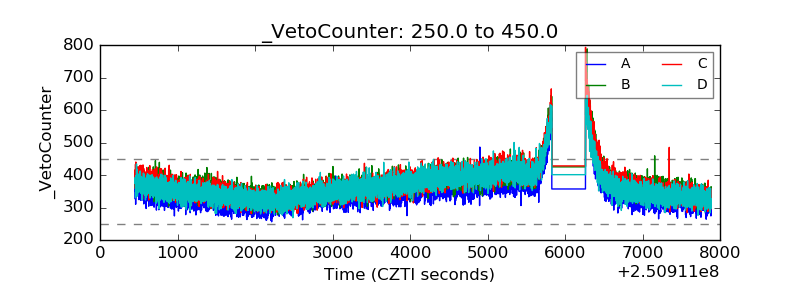 |